Potential use of lichens as an indicator of air polution in urban airshed
Bạn đang xem bản rút gọn của tài liệu. Xem và tải ngay bản đầy đủ của tài liệu tại đây (781.77 KB, 51 trang )
THAI NGUYEN UNIVERSITY
UNIVERSITY OF AGRICULTURE AND FORESTRY
NGO DUC GIANG
Potential use of Lichens as an indicator of air polution in urban airshed
BACHELOR THESIS
Study Mode: Full-time
Major
: Environmental science and management
Facully : International Training and Developing centre
Batch
: 43 Advance Education Program
Thai Nguyen, 21/09/2015
Thai Nguyen University of Agriculture and Forestry
Degree Program
Bachelor of Environment science and Management
Student name
Ngo Duc Giang
Student ID
DTN1153110179
Thesis title
Potential use of Lichens as an indicator of air polution
in urban airshed
Duong Van Thao
Supervisors
David Blake
Andrea Hinwood
Will Stock
Abstract:
The aim of this study was to assess the effectiveness lichens as an indicator of air
pollution in the Perth Metropolitan Region (PMR) urban airshed. Sample sites
were selected by identifying regions of high, medium and low NOx concentrations
based on interpolation models using data from a previous study. In each of these
regions 40 rooves were sampled for the presence and abundance of lichen species.
Additionally sites within Kings Park and within 1km and 5km of the park were
selected. It was hypothesized that large regions of urban vegetation would improve
air quality and therefore the presence and abundance of lichen species.
Environmental variables such as road density and vegetation density within a
specified distance of the sample location were collected for each of the sample
sites using GIS. Two way analysis of variance (ANOVA) was used to evaluate the
i
relationship between lichen abundance at each site of sample and each
environmental variable. Correlations between lichen abundance and each
environmental variable at each site were also undertaken. Vegetation cover was
significantly associated with lichen abundance. Generalized linear model to
examine those environment variables which best predicted a response in lichen
abundance. Results show that urban bushland has significantly associated with
lichen abundance. Other final conclusions were contrary to what have expected
that areas containing greater NOx concentration had higher lichen abundance, more
lichen abundance with an increasing of road density.
The results of this investigation suggest that lichens have the potential to evaluate
the air quality in urban bushland but some others factors were influencing the
result.
Keywords:
Lichens, air quality, Perth Metropolitan Region, NOx
concentration, environment variables, vegetation cover
Number of pages:
46
Date of submission:
September 30, 2015
Supervisor’s signature
ii
ACKNOWLEDGEMENT
I would like to express my sincere thanks and appreciations to my
supervisor David Blake for his continuous support throughout the project, from
initial advice and every step of the way. Furthermore, I am also my immensely
grateful to Prof Andrea Hinwood, Dr Duong Van Thao and Prof Will Stock for
comments that greatly improved the manuscript and for guiding me from very
first steps of this project.
Many thanks and appreciations go to Emily Allen, Jonathon Boeyen for
their contributions and supports throughout the process of this project.
iii
TABLE OF CONTENT
LIST OF FIGURES ............................................................................................... 1
LIST OF TABLES ................................................................................................ 3
LIST OF ABBREVIATIONS ............................................................................... 4
PART I. INTRODUCTION .................................................................................. 5
1.1
Research rationale .................................................................................... 5
1.2
Research’s objectives.............................................................................. 8
1.3
Research questions and hypotheses ......................................................... 8
1.4
Limitations .............................................................................................. 8
1.5. Definitions................................................................................................... 9
PART II: LITERATURE REVIEW.................................................................... 11
PART III: METHODS ........................................................................................ 13
3.1
Material .................................................................................................. 13
3.2
Methods.................................................................................................. 14
3.2.1
Study area........................................................................................ 14
3.2.2
Sites selection.................................................................................. 16
3.2.3
Sampling.......................................................................................... 18
PART IV: RESULT ............................................................................................ 24
4.1
Air quality categories ............................................................................. 24
4.2
Environmental variables ........................................................................ 27
4.3
Generalized linear model (GLZ)............................................................ 33
PART V: DISCUSSION AND CONCLUSION................................................. 35
5.1
Discussion .............................................................................................. 35
iv
5.1.1
Air quality categories ...................................................................... 35
5.1.2
Environmental variables.................................................................. 36
5.1.3
Generalized linear model ................................................................ 38
5.2
Conclusion ............................................................................................. 38
REFERENCES .................................................................................................... 41
v
LIST OF FIGURES
Figure 2.1: Lichens (light grey) living on rooves top of house…………………….…11
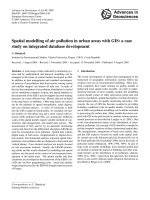
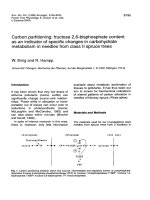
Figure 3.1: Perth metropolitan region…………………...………………………………16
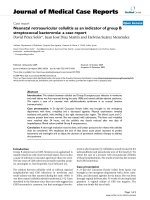
Figure 3.2: NOx interpolations model at PMR using DER AQMS and HIMAQs study
sites. Interpolations were modeled using data collected in autumn…………………18
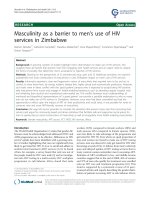
Figure 3.3: 300m Buffer vegetation regions…………………………………………….20
Figure 3.4: 300m buffer road density regions…………………………………………..22
Figure 3.5: Distances from each house to Industrial facility…………………………23
Figure 4.1: Mean and standard error bars of lichen abundance at High, Medium
and Low concentration zones……………………………………………………………..27
Figure 4.2: Distribution of lichens in correlation with 300m road density in each
house at Kings Park sites………………………………………………………………..…30
Figure 4.3: Distribution of lichens in correlation with 300m road density at 1km
buffer to Kings Park………………………………………………………………......……31
Figure 4.4: Distribution of lichens in correlation with proximity to industry at 1km
buffer to Kings Park……………………………………………………………………….31
Figure 4.5: Distribution of lichens in correlation with vegetation cover at Low
concentration of NOx sites…………………………………………………………………32
1
Figure 4.6: Distribution of lichens in correlation with 500m road density at Medium
concentration NOx sites……………………………………………………………………33
Figure 4.7: Distribution of lichens in correlation with proximity to industry at high
concentration of NOx sites………………………………………………………………..34
2
LIST OF TABLES
Table 4.1: Anova test between groups and within groups of lichen abundance in
each sites of NOx concentration ................................................................................ 25
Table 4.2: Multiple Comparisons lichen abundance between Low, medium and high
concentration of NOx ................................................................................................. 25
Table 4.3: Correlation of environment variable with each category sites................ 28
Table 4.4: Generalized linear model of lichen abundance with environment
variables .................................................................................................................... 34
3
LIST OF ABBREVIATIONS
Abbreviations
Meaning
DER AQMS
Department
of
Environment
Regulation Air Quality Monitoring
Sites.
NDVI
Normalized
Difference
Vegetation Index.
GIS
Geographic information system
RL
Road length
PM
Particle material
VOCs
Volatile organic compound
4
PART I. INTRODUCTION
1.1. Research rationale
Urbanization and industrial development impact significantly on air quality
globally. In urban areas that are surrounded by industry and that have high traffic
use; emissions to the atmosphere can be high. The World Health Organization
indicates that air pollution is a major environment-related health threat to children
and a risk factor for both acute and chronic respiratory disease (WHO 2015). Poor
air quality can also impact the respiratory system, circulation and other organs of the
body (Kampa & Castanas, 2008). Health effects range from minor upper respiratory
irritation, chronic respiratory and heart disease, lung cancer and acute respiratory
infections in children chronic bronchitis in adults and aggravating pre-existing heart
and lung disease, or asthmatic attacks (Kampa & Castanas, 2008).
There are specific pollutants which are emitted to the atmosphere in high
concentrations. They are: carbon monoxide, nitrogen dioxide, ozone and particles
(PM10 PM2.5) (NEPM 1998). Most of the research on assessing the impacts of air
pollution has been focused on human health. However air pollutants also impact
upon plants resulting in foliage disease or mortality of weak plants (Vike, 1999).
The uptakes of phytotoxic amounts of metals have also been shown to affect enzyme
inhibition (Assche & Clijsters, 1990). Plants can be injured when SO2 damages the
stomata of plants (Mudd, 2012).
5
Conversely, vegetation may improve air quality. Where large areas of natural
vegetation exist, air quality is likely to be better than in less vegetated areas (Nowak,
et. al, 2006). This may be because if vegetation is present then it is less likely that
heavier polluting activities such as vehicles or industry are also present. Vegetation
has also been shown to improve air quality by interrupting air flow and causing the
deposition of particulate matter (Vos, et. al, 2013). In the United States, the studied
of Nowak, et. al, (2006) showed that urban trees remove large amounts of air
pollution such as O3, PM10, NO2, SO2, CO. Moreover, grass on rooves (extensive
green roof) can enhance the effectiveness of trees and shrubs in air pollution (Currie
& Bass, 2008).
Traditional methods to measure air quality are expensive because of the time
and effort involved in collecting and analyzing samples. This often means that the
thoroughness of air quality monitoring or sampling is compromised due to a lack of
available resources. Hoek, et. al, (2008) showed that passive sampling for NOx with
40 sites with 4 weekly survey cost 10000-12000 Euros or the same survey for active
PM sampling costs up to 30000 Euros. Measurements of VOCs for example can cost
in the order of $600 per sample. Or particle material equipment consisting of pump
and injectors used in the TRAPCA study was estimated to cost 5000 Euros (Brauer,
et. al, 2002). However plants, especially lichens can be used as indicators of air
pollutions in local areas.
6
An alternative to expensive, traditional monitoring methods is the use of bioindicators. As mentioned previously vegetation in particular, can be sensitive to poor
air quality (Nowak, et. al, 2006). Bioindicators are organisms that can be used for
identification, qualitative determination of human-generated environmental factors
or evaluating the quality of the air corresponding with Environmental Impact
Assessment (EIA) (Conti & Cecchetti, 2001). “Lichens are the result of a symbiotic
association of a fungus or algae and are very sensitive to air quality” (Ahmadjian, V,
1993) and have been used to monitor air pollution in many research fields such as
metal (Assche & Clijsters, 1990); ammonia emissions and nitrogen (Frati, et. al,
2007); organic air pollution (Van der Wat & Forbes, 2015); air pollution of lichens
near the Strathcona Industrial area Alberta (Elsinger, et. al, 2007). For comparing
the air quality in the differences areas, we might see the quantity of lichens may
change and have abnormal symptoms.
From the above mentioned studies, it is clear that lichens are sensitive to
changes in air quality and are commonly found in urban areas, but lichens are not
commonly applied in air quality assessments in Australia, particularly in urban
environments. Lichens provide a cost-effective method of determining air quality as
they are easy to find out in bark of trees, clay rooves of house, but further research is
required into their accuracy. This study will determine the effectiveness of using
lichens as a bioindicator for air quality in an urban airshed.
7
1.2. Research’s objectives
The objective of this research was to investigate the relationship between
lichens presence on the roof tops of houses in residential areas in a gradient of air
quality. Specially, study aimed to investigate the relationship between lichen
presence and air quality levels across the PMR as well as from proximity to Kings
Park Botanic Garden in central Perth.
1.3. Research questions and hypotheses
The aim of this study is to investigate whether lichens are useful bio-indicators
of air pollution in an urban airshed? In order to achieve this aim, this study will
investigate the following hypotheses:
Areas of poor air quality will result in lower lichen abundance.
Areas containing large areas of vegetation will have higher lichen abundance
compared with areas containing less vegetation.
Which environmental/land-use variables influence lichen abundance.
1.4. Limitations
In an urban airshed, the presence and abundance of lichens may be affected by
a number of factors besides air quality. These include the type of roof substrate, the
age of the building/roof and whether the roof had been cleaned recently (survey
asked). The roof substrate will have an effect on the presence of lichens, as
mentioned above the lichens could survive on the rooves with types of materials
such as: clay (red color), asbestos-cement (gray color).
8
The modeling was based on road density over the study sites due to the fact
that road density is a proxy measure for vehicle density over a given area; road
density however, may not be an accurate reflection of the traffic and emission in that
area.
The data of this study was calculated based on 2 week sampling period for
autumn, which may not be a true reflection of the annual air quality in that region
due to seasonal variations
Several studies were state that good air quality will have higher lichens
abundance but some lichens species need some chemicals to grow, but in certain
amount. Białońska and Dayan, 2005, has shown that the added of physodic acid is
defensing against stressed caused by pollution. It means some type of lichens will be
stronger with the existence of chemical substances.
1.5. Definitions
Abbreviation
Buffer
Meaning
A zone around a map feature
measured in units of distance or time. A
buffer is useful for proximity analysis.
DER AQMS
Department
of
Environment
Regulation Air Quality Monitoring Sites
NDVI
Normalized Difference Vegetation Index
9
GIS
Geographic information system.
An
integrated
collection
of
computer software and data used to view
and
manage
geographic
relationships,
information
places,
and
about
analyze
spatial
model
spatial
processes. A GIS provides a framework
for gathering and organizing spatial data
and related information so that it can be
displayed and analyzed.
RL
Road length
10
PART II: LITERATURE REVIEW
“Lichens are the result of a symbiotic association of a fungus or algae and are
very sensitive to air quality” (Ahmadjian, V, 1993). Lichens absorb atmospheric
moisture gases and other components directly through thalli (Ahmadijian, V, 2012).
Thallus are single cell or mass of cell not distinguish as stems, root or leaves
(Ahmadijian, V, 2012). Most lichens are gray or brown when they dry but with wet
thalli the color will be more or less green. Lichens can live on trunk, bark of trees,
rock or on the rooves of houses and they never stop growing in any condition, they
just grow faster or slower during the time (Ahmadijian,V, 2012).
Figure 2.2: Lichens (light grey) living on rooves top of house
Unlike higher plants, lichens absorb water and nutrients through their surface
(thalli) so they are very sensitive to air quality and the local conditions (Loppi,
11
Ivanov & Boccardi, 2002). Correlations between high concentrations of emissions in
air quality and decreased lichen presence/abundance is well documented (Elsinger,
et. al, 2007). An investigation of lichens in the USA noted that lichen communities
were strongly associated with vegetation cover (Root & McCune, 2012). Another
investigation showed that lichens were sensitive to pollution caused by traffic and
abundance declined significantly when close to roads (Llop, et. al, 2012).
Furthermore, lichens can be accumulative bioindicators; accumulative
bioindicators means that they have the ability to store contaminants in their tissues
and the host remains unharmed (Conti & Cecchetti, 2001).
Lichens have been used to monitor air pollution in many research fields in
rural areas or highly focus on industrial zones such as: lichens can be used to
identify the type and possible sources of pollution (Jeran, et. al, 2002). Frati, et. al,.
(2007) showed the diversity of nitrophytic lichens species was highly correlated
with the concentration of NH3 and bark pH. Moreover, essential information
required for ecological impact assessment, and waste management may be provided
by lichens (Paoli, et. al, 2012).
The above studies have shown that lichens were successfully used to monitor
air quality or assess the ecological impacts in rural or industrial zones but very few
studies have focused on urban areas. Urban airsheds are affected by road density and
other environmental variable such as industrial emission, fire emission etc…
12
PART III: METHODS
3.1. Material
This study was designed to investigate the relationship between the presence
and abundance of lichens and different levels of air quality in PMR. Perth people
require and depend heavily on their vehicles for business or other demands. This can
release high amounts of air pollutants to urban airshed (Newman & Kenworthy,
2006).
This study made use of visual inspection of roof tops using binoculars to count
lichen presences/absences and GPS to record the location of each house. This was
the enable the use of GIS to investigate the relationship between lichen presence and
environmental variables.
This study was divided into three parts:
Using NOx interpolations modeled for PMR: to categorize into regions of high,
medium and low air pollution. Additionally categorize into regions of 0km buffer,
1km buffer and 5km buffer to Kings Park.
Environmental variables: to examine the influence of road density, vegetation
cover and proximity to industrial area, using GIS.
Generalized linear model to examine the influence of environment variables
which best predicted a response in lichen abundance.
13
3.2. Methods
3.2.1. Study area
The study area was the metropolitan Perth area bounded by Joondalup in the
North, Fremantle in the South and Midland in the East (Figure 3.1). Perth has a dry
summer in the months of December, January and February with the weather
changing in March, April and May to a cooler environment before winter in June,
July and August, then the weather increases in temperature in September, October
and November (Rennie, et. al, 2006).The PMR covers an area of 1,300 km2 and has
an estimated population of 1.6 million (Curtis 2006). PMR is reputation as one of
the most car-dependent cities. Car owner and use are the highest of all Australian
cities with 723 vehicles per thousand people (Curtis 2006).
14
Figure 3.1: Perth metropolitan region
15
3.2.2. Sites selection
Sample sites were selected based on the interpolated model of air pollution
(figure 3.2). Three major zones of air pollutions (high, medium, low) were
determined by using GIS. Zones of high, medium and low air quality exposure
zones were determined based upon interpolated model levels of NO x using autumn
data from the Department of Environment Regulation Air Quality Monitoring Sites
(DER AQMS) and the Health in Men’s Air Quality (HIMAQs) study sites.
Additionally, a proximity analysis study was performed in to the vicinity of Kings
Park with sampling sites situated within the park as well as 1km and 5km’s from the
park perimeter. Based on data from DER AQMS and HIMAQs sites, zones were
categorized as follows; the high exposure zones were arranged from 16.21 to 23.9
µg m-3 NOx contours, medium exposure zones falling between 8.51-16.2 µg m-3 NOx
contours and low exposure zones for sites at < 8.5 µg m-3 NOx contours (Figure 3.2).
Four sites per zone were selected for sampling at zones of high medium and
low NOx concentration (n=120), with ten control sites selected as in Kings Park
Garden (n=22). Four sites were selected within 1km of the perimeter of Kings Park
(n=40) and three sites within 5km of Kings Park (n=30).
16
Figure 3.2: NOx interpolations model at PMR using DER AQMS and HIMAQs study
sites. Interpolations were modeled using data collected in Autumn.
17
3.2.3. Sampling
Previous studies have shown that, lichens could live in materials with clay, old
concrete tile (Garty & Delarea, 1988) or asbestos-cement (Favero-Longo, et. al,
2009). So at each site, ten residential houses with clay rooves or asbestos-cement
rooves were selected randomly. At each house, a count of the presence/absence of
lichen by a cumulative area of 5x5 quarter roof tile will be taken. The cumulative
area were measured from the bottom left of the roof starting at the 1 st tile beneath the
ridge capping. Those 5x5 roof tile were taken in the same position at each house to
ensure consistency between sample sites.
* Environment variable by GIS
Vegetation (NDVI)
Surrounding greenness at each house of sample was determined using the
Normalized Difference Vegetation Index (NDVI) derived fromfrom Landsat 7 ETM
SCL-off data at a resolution of 30 m x 30 m. The Landsat 7 ETM imagery obtained
was cloud-free, captured during the daytime. NDVI values fall within -1 to 1, where
values of ≤0 indicate areas with no green vegetation content and values approaching
1 indicate areas with high green vegetation density (Wade & Sommers, 2006). 300m
and 500m buffer sizes were selected due to uncertainty in what the optimal buffer
size is in identifying how vegetation may influence the presence/absence of lichens.
This method was based on a study by Lalande, et. al, (2012), using buffer from 30m,
100m, 300m 500m up to maximum of 2400m were tested on land uses impacts on
18
water quality in Germany. Due to limited time, and the quality of the PMR airshed,
it was assumed that small buffer would not have much pollution. (Figure 3.3)
Figure 3.3: 300m Buffer vegetation regions
19