BÀI GIẢNG KHÍ TƯỢNG LÝ THUYẾT CHƯƠNG 19
Bạn đang xem bản rút gọn của tài liệu. Xem và tải ngay bản đầy đủ của tài liệu tại đây (144.13 KB, 11 trang )
Chapter Nineteen
CHAPTER NINETEEN
Forecasting the Mariner's Own Weather
INTRODUCTION
When direct and trustworthy forecasts for a ship's area of interest are being
regularly received by radio from meteorological services ashore (and most ocean
areas are covered today), the shipmaster should have no need to make his own
forecast but it may well be useful for him to study a weather map to better interpret
the official forecast. There may be occasions when he needs, for operational
reasons, to make his own forecast (perhaps against the background of an official
forecast) in order to decide what action, if any, he should take to avoid a weather
hazard or maintain existing favourable conditions, in which it is essential for him
to consult a synoptic map. Today radio facsimile (see Chapter 18) makes readymade weather maps available to him.
Effective use of a weather map calls for a good understanding of the contents of
Chapters 11 to 15 (inclusive), 17, 18, and this chapter, also for familiarity with
the use of the Climatological Atlas, Admiralty Routeing Charts and Sailing
Directions (pilots) .
FRONTAL DEPRESSIONS
The energy to develop and sustain an active frontal depression is derived mainly
from the air in the warm sector. Thus the deepening of a depression having a wide
warm sector will usually continue to increase whilst unoccluded and often during
the early stages of occlusion (See Chapter 13) thereafter it can generally be
expected to decrease as the occluding process continues. A fully occluded
depression seldom deepens.
MOVEMENT OF DEPRESSIONS - See Chapter 13.
MOVEMENT OF FRONTS
The direction of movement is at right-angles to me front.
The speed of movement. A first approximation is obtained directly from the
geostrophic wind scale by measuring the geostrophic wind component at right
angles to the front.
The speed varies along the front and is maximum near the depression's
166
Chapter Nineteen
centre, or wherever the isobars are closest together. Hence to plot the estimated
future position of a front on a weather map, the geostrophic component should
be obtained at several points along the front and adjusted according to the
"Rules".
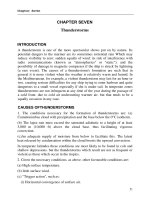
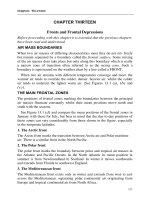
In figure 19.1 let the line FF, represent a front, AB and CD two consecutive
isobars intersecting the front at points Band D respectively.
BE is perpendicular to the isobars and its length on the geostrophic wind scale
is inversely proportional to the wind speed (W) shown on the scale.
Similarly the length of BD is inversely proportional to the required wind
component (V) which is obtained by measuring BD on the geostrophic scale.
Rules to assist in estimating the future position of a front.
1. The speed of a cold front is usually about equal to, or a little more than, the
geostrophic component. The more the pressure rises behind it the faster it
moves.
2. The speed of a warm front is less than that of a cold front and is generally about
two-thirds of the geostrophic value. The more the pressure falls ahead of it the
faster it moves.
3. A front which is parallel to the isobars is slow moving or stationary.
4. When a front is stationary or nearly so. it tends to move from an area where the
pressure is rising towards one where it is falling.
167
Chapter Nineteen
5. An occlusion advances roughly with the speed of the geostrophic wind
component. but there is no definite rule.
6. An occlusion slows down when approaching a stationary (blocking see
Appendix 1) anticyclone.
Provided successive weather maps are available the future position of a front can
be easily estimated by extrapolation (that is. movement can be assumed to
continue as shown by a succession of previous maps). It is recommended that this
method should be used whenever possible; but consideration should be given to the
foregoing rules and also to the likelihood of a change in the geostrophic wind
during the forecast period. A close sequence of weather maps is very advantageous.
ANTICYCLONES
Formation and types of anticyclones are described in Chapter 15.
Intensification and decline
1. The intensity of an anticyclone will not change:
(a) Whilst the pressure in the centre remains constant,
(b) If pressure on one side is rising at the same rate as it is falling on the other.
2. It is intensifying if:
(a) Pressure is rising all round the centre, or
(b) Pressure is rising on one side faster than it is falling on the other.
3.It is weakening if:
(a) Pressure is falling all round the centre, or
(b) Falling faster on one side than it is rising on the other.
Movement of anticyclones
1. Anticyclones are usually slow moving by comparison with depressions.
2. An anticyclone or ridge between two depressions of a "family" (see Chapter 13)
travels with the same speed and direction as the depressions.
3. An anticyclone formed in a surge of Pm (polar maritime) air behind the last
depression of a family moves with the cold air mass; Le. towards lower latitudes.
4. A. warm anticyclone moves slowly and tends to become stationary.
5. Anticyclones move from areas of falling barometric tendencies towards areas of
rising tendencies.
168
Chapter Nineteen
6. The centre of an anticyclone tends to move towards the area in which the
temperature is falling the fastest.
WINDS ALOFT
Some knowledge of the flow patterns in the upper levels of the atmosphere is
useful in estimating the probable movement of depressions.
Terminology:
The free atmosphere is the atmosphere above the friction layer, ie above 600
metres above sea level where the air motion is considered to be free from the
effects of surface friction.
Lower Wind. The wind at 600 metres, which level can be regarded as the base of
the free atmosphere.
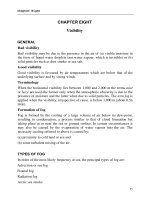
Thermal wind. The effect of horizontal temperature distribution on the upper
wind, i.e. the vector difference between the upper and lower winds (see
Figure 19.2). The thermal wind increases with increasing height; it flows
parallel to the isotherms of mean temperature with higher temperature on the
right in the northern hemisphere and on the left in the southern hemisphere.
Its speed is proportional to the temperature gradient.
The upper wind at any given level is a combination of the lower wind and
the thermal wind at the given level.
Variation of wind with height.
In the free atmosphere the variation of wind with height is caused by changes
in horizontal pressure distribution at successive levels; this in turn, for any
given height depends on the mean horizontal temperature distribution of the
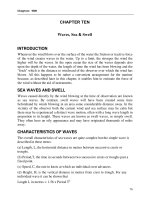
atmosphere below the given height. For a clearer understanding of this refer
to Figure 19.3.
169
Chapter Nineteen
AB and CD represent two air columns of equal height and, for the sake of
simplicity. standing on a surface of uniform pressure - say, 1,000 hPa.
The mean air temperature of column AB is warm, whilst that of CD is
relatively cold. and therefore denser and heavier than AB. Thus the fall in
pressure from B to A is less than from D to C, so pressure at A must be
greater than at C. The pressure difference between the tops of two such
columns of air increases, level for level, as height increases.
In areas where the temperature is high, the pressure at upper levels tends
also to be high, and in areas of low temperature the upper air pressure also
tends to be low.
The mean temperature of the troposphere increases from the poles towards
the equator; hence the average thermal winds are westerly in both
hemispheres (see paragraph on thermal wind) except within the tropics where
conditions are more complicated. In very low latitudes the Earth's rotation is
not effective and the geostrophic rule, on which the theory of thermal 'winds
is based. does not apply. In addition there are other complications which go
beyond the scope of this book.
The main distribution of winds within the tropics consists of a belt of
easterly winds between the NE and SE trade winds: this belt extends over 10°
to 20o of latitude and moves north and south with the sun. This easterly flow
is modified in some regions by monsoon-like effects.
In general. in both hemispheres:
(a) Westerly winds normally increase with height.
(b) Upper winds tend to become increasingly westerly as height increases.
170
Chapter Nineteen
(c) Easterly winds normally decrease with height and later undergo a reversal
of direction.
The relationship between temperature and pressure at the surface, as
shown on a synoptic chart, can give a rough guide to the winds aloft by
applying the following "rules":
1. When surface isotherms are parallel to the isobars:
(a) High temperature in region of high pressure.
Wind increases with height with little or no change in direction.
(b) High temperature ill region of low pressure.
Wind decreases with height and possibly undergoes a reversal in direction and
then an increase with height.
2. When lower wind blows across the isotherms.
(a) If lower wind blows from region of lower temperature.
Upper winds back with height in the northern hemisphere (veer in southern
hemisphere) and increase after a possible initial decrease.
b) If lower wind blows from region of higher temperature.
Upper winds veer with height in the northern hemisphere (back in southern
hemisphere) and increase after a possible initial decrease.
UPPER AIR CHARTS
Today, with the ever increasing extent of the facsimile network (particularly in
the southern hemisphere) and the growing number of ships being equipped
with facsimile recorders (see Chapter 18). the availability of upper air charts to
the mariner is becoming more common.
There are several types of upper air charts and they are of particular value in
the forecasting of developments at the surface. They indicate the large scale
movements of air with greater accuracy and clarity than surface charts which
are complicated by small scale weather systems. topography and other local
effects.
Constant pressure or contour charts show heights above mean sea level at
which fixed (i.e. constant) pressures occur. Isopleths (see Appendix 1) of equal
heights on a given pressure surface are called CONTOURS and they are
usually drawn at height intervals of 60 metres, but at greater intervals on small
scale charts covering very large areas.
171
Chapter Nineteen
Contour charts are most commonly drawn for the pressure surfaces of
1,000,700,500,300,200 and 100 millibars (ie hPa). of these the 500 mb. chart
is generally considered as being the most convenient for use by mariners. The
clear indication of general windflow is useful in forecasting movement of
pressure systems at the surface.
Winds flow parallel to the contour lines with greatest heights to starboard
in the northern hemisphere and to port in the southern hemisphere.
Wind speed is directly proportional to the contour gradient (i.e. inversely
proportional to the perpendicular distance between the contours) and reaches
its maximum near the tropopause.
Note that "Highs" and “low” refer to heights, not pressure.
Long waves
A 500 mb contour chart of the northern hemisphere will show a wavy
circumpolar flow of westerly winds which tend to reach their greatest strength
in the middle latitudes. The length of these "long waves" (measured from crest
to crest) varies considerably and some may exceed 3,700 kilometres. The
amplitude of large scale troughs and ridges also show considerable variation
during periods of a few Jays: if the north and south fluctuations become very
large, closed circulations of air may form and become separated from the main
stream. But there are sometimes periods of many days during which the
position and shape of these long waves change very little. During such periods
settled weather persists in areas south of the ridges (in the northern
hemisphere): but within and a little to the east of the troughs the weather
generally remains very unsettled throughout the period.
Use of 500 mb (or hPa) contour chart for estimating movement of
surface pressure systems
The contours indicate the general direction of movement of small scale surface
pressure systems. such as warm sector depressions and cold ridges of high
pressure between them. These systems travel at about half the speed of the
winds at the 500 mb (or hPa) pressure surface.
As depressions develop their closed circulations extend to higher levels, but
the closed circulation of small shallow depressions are seldom evident on a 500
mb chart.
The airflow round the long waves tends to guide surface depressions and
anticyclones. If the airflow superimposed over either of these systems is
straight in direction and steady in speed, they will be steered by this stream.
172
Chapter Nineteen
173
Chapter Nineteen
Changes in upper air patterns
The movement of “flat" upper air troughs and ridges (i.e. those having only
slight curvature) is fairly rapid.
Upper air troughs and ridges of large amplitude with greatly curved contours
move slowly.
The stronger and more extensive an upper air "high" or "low" the slower is
its displacement.
In the northern hemisphere the circumpolar westerlies reach their greatest
speed near the tropopause between latitudes 25° and 400N during winter. and
between 40° and 45° in summer. The average wind speeds are about 80 knots
in winter and about 50 knots in summer when the thermal gradient is weaker.
In the southern hemisphere the disposition of westerly winds is much the same
as in the north.
In both hemispheres there are variations in speed due to local effects. e.g.
In the vicinity of the south-east coasts of North America and Asia there is a
very large temperature difference between ocean and continent, this increases
the thermal component considerably and. in these areas. the westerly winds
average about 100 knots in winter.
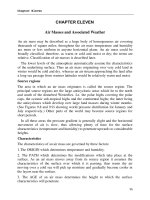
Figure 19.4 shows the contours of a 500 mb pressure surface on September
6 1984. It covers only a very small area on the original chart, from which
some information has had to be omitted for the sake of clarity. and the scale
has been considerably reduced to fit the book page.
Note the 'long waves' and closed contours mentioned previously.
Figure 19.5 is a sample of the distance and geostrophic wind speed scales
taken from the original contour chart. These scales have not been reduced.
Our grateful thanks are due to the Meteorological Office, at Bracknell, for
their kind help and permission to use their chart for these illustrations.
174
Chapter Nineteen
QUESTIONS
1. Describe how you would measure the speed of movement of fronts drawn
on a weather chart. What factors would you take into consideration when
estimating their future positions?
2 Describe how a comparison of pressure tendencies in different parts of an
anticyclone can give indication of an intensification or weakening of the
system.
3. Discuss the movement of anticyclones: (a) In general. (b) Formed in cold
Pm air behind the last depression in a “family". (c) A warm anticyclone. (d)
An anticyclone or ridge between two depressions of a ··family".
4. Of what practical value in forecasting is a knowledge of wind flow at upper
levels?
175
Chapter Nineteen
5. Why are upper air charts of value in the forecasting of developments at the
surface?
6. (a) Which pressure surfaces are commonly drawn by the meteorologist? (b)
In which direction does the wind flow in relation to the contours?
7. Discuss circumpolar long waves (Rossby waves) shown on a 500 mb
contour chart.
176