APPLICATION HGM THEORY TO CALCULATE THE MITIGATION RATIO OF RESTORED WETLAND AND REFERENCE WETLAND IN XUAN THUY NATIONAL PARK, NAMDINH CITY, VIETNAM
Bạn đang xem bản rút gọn của tài liệu. Xem và tải ngay bản đầy đủ của tài liệu tại đây (283.9 KB, 15 trang )
Group 9 – K55TTKHMT– Environmental Science – HUS
HANOI UNIVERSITY OF SCIENCE, VNU
FACULTY OF ENVIRONMENT
---------------o0o---------------
WETLANDS - BIOLOGY AND REGULATION
Topic:
APPLICATION HGM THEORY TO CALCULATE THE MITIGATION RATIO OF RESTORED WETLAND
AND REFERENCE WETLAND IN XUAN THUY NATIONAL PARK, NAMDINH CITY, VIETNAM.
Instructor: Prof. Nguyen Thi Loan
Group 9:
1.
2.
3.
4.
5.
6.
Duong Thi Kim Anh
Tran Vu Diem Huyen
Ngo Thi Huyen
Chu Thi Nham
Nguyen Thi Minh Trang
Duong Thi Thu Trang
1
Group 9 – K55TTKHMT– Environmental Science – HUS
Contents
I.
II.
III.
IV.
V.
INTRODUCTION
METHOD
1.
Site description
2.
HGM approach
COLLECTING DATA AND CALCULATION USING HGM THEORY
1. LONG-TERM SURFACE WATER STORAGE
2. NUTRIENT CYCLING
3. MAINTAIN CHARACTERISTIC PLANT COMMUNITY
4. MAINTAIN SPATIAL STRUCTURE OF HABITAT
RESULT AND DISCUSSION
CONCLUSION
2
Group 9 – K55TTKHMT– Environmental Science – HUS
APPLICATION HGM THEORY TO CALCULATE THE MITIGATION RATIO OF RESTORED WETLAND
AND REFERENCE WETLAND IN XUAN THUY NATIONAL PARK, NAMDINH CITY, VIETNAM.
I.
II.
INTRODUCTION
We were assigned using HGM theory to calculate the mitigation ratio of restored wetland and reference
wetland in a coastal area in Vietnam (suppose success ratio is 30%). We choose to calculate in Xuan Thuy National
Park, Namdinh city, Vietnam. Hydrogeomorphic HGM approach was applied to calculate the mitigation ratio by
evaluating wetland functions of the mitigation site compared to the reference site.
METHOD
1. Site description
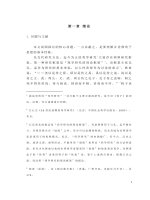
Xuan Thuy National Park is a national park in Red River Biosphere Reserve in the province of
Namdinh, Vietnam.The park was the first wetland area to be announced a Ramsar site in south-east Asia and
is internationallysignificant as a migratory bird habitat, being the 50th site worldwide.
Landscape and Climate: Xuan Thuy National Park is located in Giao Thuy district (Namdinh province). It is
the largest coastal wetland ecosystem in the north of Vietnam and placed in the south of the Red River mouth.
The Core Zone has a total area of 7.100 hectares. There are two types of soil formed from the alluvium of the
Red River. One is alluvial mud (which becomes loam) and one is sand. Transported by water the alluvial
forms the coastal soil like light soil ( sand and light loam and pure sand), medium soil and heavy soil ( loam
and clay )
Biological characteristics: biodiversity of fauna and flora
3
Group 9 – K55TTKHMT– Environmental Science – HUS
Fingure 1: Xuan Thuy National Park (sources: Google Earth)
2. HGM approach
The HGM classification system is based on three main criteria including landscape position, water
source, and hydrodynamics (Craft 2011). This approach was applied to evaluate the functional indices of the
mitigation wetland in comparing with the reference wetland of the same type. Wetlands deliver a wide range
of functions associated with four general categories: Hydrology, biogeochemistry, plant habitat, and animal
habitat (Hauer1998). In this case, we evaluated only one function for each category as following:
Table 1: Ecological functions evaluated in HGM method
4
Group 9 – K55TTKHMT– Environmental Science – HUS
No.
1
2
3
4
Category
Hydrology
Biogeochemistry
Plant habitat
Animal habitat
Evaluated function
Long-term surface water storage
Nutrient cycling
Maintain characteristic plant communities
Maintain spatial structure of habitat
The detail information and results are summarized in data table.
Strategy:
The reference site was given a score of one for each index of variable.
The scores assigned for variables of the mitigation site were based on their likeness to the reference site.
The total function index was the average scores of the four functional categories.
The ratio of total function index of the reference site to the mitigation site is called the HGM mitigation ratio.
Because forested wetlands have a failure rate of 70%, an adjusted HGM mitigation ratio is necessary (Robb 2002).
The below equation is used to calculate the adjusted HGM mitigation ratio.
Adjusted HGM mitigation ratio =
(the success rate is 30% or 0.3)
III.
COLLECTING DATA AND CALCULATION USING HGM THEORY
1. LONG-TERM SURFACE WATER STORAGE
1.1. Definition:
Long-term surface water storage is the capacity of a wetland to store (retain) surface water for long durations;
associated with standing water not moving over the surface. Sources of water may be overbank flow, direct
precipitation, or upland sources such as overland flow, channel flow, and subsurface flow.
1.2. Description of variables
5
Group 9 – K55TTKHMT– Environmental Science – HUS
VSURWAT, Indications of surface water presence. For the Long-Term Surface Water Storage function to occur, a
wetland must be inundated by ponded or retained water for a continuous period of not less than 1 week. Site
assessments are not always possible when there is the presence of surface water for the requisite continuous
duration...
VMACRO, Macrotopographic relief. For long-term storage to occur, particularly when a stream has retreated to within
its banks, there must be topographic relief on the floodplain that consists of restricted outlets thus allowing surface
water to be trapped for the requisite duration. Relief features on a sloping landscape that will not serve to trap water
for long periods do not contribute to the expression of this variable.
When the macrotopographic relief features are similar to reference standards, such as being well formed on a
wetland with little or no surface gradient, the variable index is 1.0.
Where relief features have been altered so that they do not serve to trap water for long periods, the site should be
scored lower (0.5 or 0.1), depending on the rate at which surface drainage might occur relative to the reference
standard.
If macrotopographic relief is not significant and the surface gradient is moderate to steep, indicating a rapid loss
of water or that no ponding occurs relative to reference standards, the variable index is zero.
Altered wetlands may have their macrotopographic features reduced or made ineffective through filling, leveling,
and drainage.
2. NUTRIENT CYCLING
2.1. Definition: Abiotic and biotic processes that convert nutrients and other elements from one form to another;
primarily recycling processes.
2.2. Description of variables
VPROD Aerial net primary productivity. Aerial net primary productivity (ANPP) is one of two variables for the
function that can be directly measured. VPROD is determined by measuring thickness of leaf litter layer. In addition,
ANNP can be indirectly estimated from estimates of leaf area, or leaf area index (as determined from interception of
coming solar radiation). Other components of ANNP have been estimated in some forested wetland from the
relationships between age, basal area, and biomass for developing stands. The presence of living biomass is an
indicator that nutrient uptake processes are occurring.
We took data about the thickness of leaf litter layer in Xuan Thuy National Park. If categorical variables may be
assigned using:
6
Group 9 – K55TTKHMT– Environmental Science – HUS
1.0 for 75 to 125 percent of reference standard
0.5 for 25 to 75 percent or >125 percent of reference standard
0.1for 0 to 25 percent of reference standard
0.0 for the absence of variable and indicators
VTURNOV Annual turnover of detritus. Detritus turnover is “the other half” of nutrient cycling. Detrital stocks are
represented by snags, down and dead woody debris, organic debris on the forest floor (leaf litter, fermentation, and
humus layers), and organic components of minerals soil.
Most detrital components can be observed directly and compared with reference standards. Additional
indicators could include fungi and mycorrhizae, as well as arthropods and other invertebrates, for assessments
conducted in more detail:
Sites within:
75 to 125 percent of reference standards in detrital stocks score 1.0.
Where detrital stocks are significantly reduced (25 to 75 percent) or overabundant (>125 percent), the variable
should score 0.5;
If major disturbance has depleted the site of most soil and detrital organic matter (1 to 25 percent), the function
should receive a 0.1.
If there are no detrital stocks and the potential for recovery is absent the score should be zero
3. MAINTAIN CHARACTERISTIC PLANT COMMUNITY
3.1. Definition: Species composition and physical characteristics of living plant biomass. The emphasis is on the
dynamics and structure of the plant community as revealed by the dominant species of trees, shrubs, seedlings,
saplings, and ground cover, and by the physical characteristics of vegetation.
3.2. Description of variables
V
COMP, Species composition for tree, sapling, shrub, and ground cover strata.
Species composition is one of five variables used to assess the plant community function.
If three of the dominant species in each of the four strata (tree, sapling, shrub, and ground cover) match three of
the four dominants in equivalent strata of reference standard, the variable should be assigned a 1.0.
If only the ground cover does not meet this condition, the site should receive 0.75 for the variable score.
7
Group 9 – K55TTKHMT– Environmental Science – HUS
The score decreases to 0.5 if neither ground cover nor saplings match three of the four dominants of reference
standards.
If only the tree stratum shares its three dominants with reference standards, a 0.25 should be assigned to the
variable.
Finally, if none of the strata meets reference standards, then a score of zero should be assigned.
V
REGEN, Regeneration from seedlings/saplings and/or clonal shoots. Death is REGEN a natural process in
ecosystems, and the maintenance of plant communities requires replacement of individuals that die.
If the ratio of sapling and seedling species to canopy species is between 50 and 75 percent of its reference
standard (a mature forest), an assessment site has a high probability of being stable and an index of 1.0 should be
given for the variable.
If the measure is 25 to 50 percent of the reference standard, A score of 0.5 should be given.
If the measure is 0 to 25 percent of the reference standard, a score of 0.1 should be given
If species composition of seedlings or saplings has no similarities with the reference standard sites, or if a site is
devoid of vegetation, an index of 0.0 should be given.
CANOPY, Canopy covers. Canopy cover is an estimate of spatial continuity in the upper layers of a forest
V
canopy. The measurement of canopy cover can be done most simply by making a visual estimate of how much of
the sky is covered by leaves when one looks into the canopy.
If the percent cover in an assessment site is >75 percent from reference standard sites, a score of 1.0 should be
given.
If canopy cover is from 25 to 75 percent, Index score is 0.5.
If an assessment site is from 0 to 25 percent, score should be 0.1.
A zero is given when there is no tree layer.
V
DTREE, Tree density. Density (VDTREE) and basal area (VBTREE below) of trees can be used to evaluate the
successional status and stability of plant communities.
8
Group 9 – K55TTKHMT– Environmental Science – HUS
If tree density at an assessment site is between 75 and 125 percent of reference standards, it may be assumed that
the site is stable and a score should be 1.0.
If the range is either from 25 to 75 percent or from 125 to 200 percent, a score of 0.5 should be assigned.
If densities beyond the foregoing ranges (i.e., higher or lower), a score should be assigned 0.1.
The absence of tree species receives a zero.
V
BTREE, Tree basal area. Basal area of trees (VBTREE ) is proportional to aboveground plant biomass of trees
and is a dependable indication of forest maturity
4. MAINTAIN SPATIAL STRUCTURE OF HABITAT
4.1. Definition: The capacity of a wetland to support animal populations and guilds by providing heterogeneous
habitats.
4.2. Description of variables
VSNAGS, Density of standing dead trees (snags). Standing dead trees are important in contributing to habitat structure.
Density determinations should focus on the larger size classes of snags (with respect to reference standards), because
large snags provide the widest range of potential habitats for use by animals. The density of snags is most
appropriately determined through direct measurements. However, if measuring is not possible, aerial photographs
may be used if dead and living trees can be discriminated and counted.
1.0 for density >75% of reference standard.
0.5 for density between 25% and 75% of reference standard.
0.1 for density between 0% and 25% of reference standard.
0 for no standing dead trees
VMATUR, Abundance of very mature trees. Standing mature or dying trees provide nesting habitat for a variety of
animal species, including invertebrates, birds, reptiles, amphibians, and mammals. Index scores may be determined
as in VSNGS above.
VSTRATA, number and attributes of vertical strata of vegetation. Vertical stratification must be measured directly and
compared with the reference standard when assessing a site. No indirect measure is available. The number of strata,
density, or cover of plants in each stratum, or some composite index, should be developed that is appropriate to the
reference domain.
A condition >75 percent of reference standards, a variable index score of 1.0.
9
Group 9 – K55TTKHMT– Environmental Science – HUS
Conditions between 75 and 25 percent of the reference standard should score 0.5.
Assessment sites that possess between 0 and 25 percent of the reference standard (with potential for restoration)
should be scored 0.1.
Sites that have no potential to recover vertical stratification similar to that of the reference standard should score a
zero.
VPATCH, Vegetation patchiness. The scale at which patchiness is measured and evaluated determines the reliability
and usefulness of measurements.
Patchiness between 75 and 125 percent of its reference standard should receive a variable index score of 1.0.
Patchiness between 75 and 25 percent or >125 percent of its reference standard should score 0.5.
Assessment sites that are between 0 and 25 percent of this reference standard for patchiness should be scored 0.1.
Sites have no potential for restoring patchiness to the reference standard should receive a zero score.
VGAPS, Canopy gaps. Death of canopy trees is a normal process that has important implications for the dynamics of
ecosystems.
Gap area or density that is between 75 and 125 percent of reference standards should receive a variable index
score of 1.0.
Conditions between 75 and 25 percent or >125 percent of the reference standard should score 0.5.
Assessment sites that are between 0 and 25 percent of the reference standard should be scored 0.1.
Sites than have no potential for recovery to the reference standard (development of gaps not possible) should
receive a zero score.
Table: Summary of values and calculation for wetland functions using hydrogeomorphic index at
Xuan Thuy National Park, Namdinh city, Vietnam.
Model measure
Measure
Reference wetland
Index of Restored wetland
Variable
LONG-TERM WATER STORAGE
Indicators
of Visual observation of ̴ 2m flooding observed 1.0
VSURWA surface
water water mark, buttress, from
watermarks,
Index of
Variable
̴ 1.15 flooding observed 0.5
from watermarks on
10
Group 9 – K55TTKHMT– Environmental Science – HUS
buttressing and moss on
trees
Macrotopographic Estimated by viewing Uniformly flat
1.0
VMACRO relief
aerial photograph (Google
Earth)
Index of Function = (VSURWAT + VMACRO)/2
T
present
moss
NUTRIENT CYCLING
Aerial
net Determined by measuring 6cm
1.0
VPROD
primary
thickness of leaf litter layer 7cm
productivity
6cm =6cm average
5cm
6cm
Annual
Measuring the thickness of Very thin organic layer if 1.0
VTURNOV
turnover of A horizontal layer
present <1.0 cm of dark
detritus
organic matter at the top
of the soil sample
trees.
Uniformly flat
0.75
7.0
0.5
6.0
8.0 = 7.6 average
8.0 (127% calc)
9.0
Very thin organic A 0.1
horizon but thickness
leaf litter is high
Index of function if VPROD >VTURNOV then index is VTURNOV otherwise use VPROD
MAINTAIN CHARACTERISTIC PLANT COMMUNITY
Determined 3 dominant T: Bruguiera sexangula,
1.0
Species
species for each strata.
sanneratia caseolaris
composition for Plot size: Tree >5cm DBH SAP: Aegiceras,
10m
radius, corniculatum, bruguiera
tree (T), sapling in
saplings/shrubs
in
5m cylindrical, xylocarpus
(SAP),
and
radius,
herbaceous
in
2m
granatum
VCOMP
groundcover(G radius.
GC: Acanthus ilicifolius,
kandelia candel, phragmites
C) strata
australis
1.0
0.1
T: Bruguiera
gymnorrhiza,
bruguiera cylindrical.
SAP: Aegiceras
corniculatum, bruguiera
cylindrical, sanneratia
caseolaris
GC:Acanthus ilicifolius,
kandelia candel,
phragmites australis,
0.25
11
Group 9 – K55TTKHMT– Environmental Science – HUS
VREGEN Seedlings/sap Estimated ratio of seedlings
lings and/or to saplings (DBH<5 cm)
clonal shoots
VCANOP Canopy cover Visual estimation of 10m
radius on site
Y
VDTREE Tree density
Count number of tree
(>5cm DBH) in 10m radius
VBTREE Tree
basal Measured DBH in a 10m
area
radius plot for all tree
species >5cm DBH using a
standard DBH tape
kandelia obovata.
1:25
1:5
1.0
T: 75%
1.0
T: 50%
0.5
80
1.0
60
0.5
Bruguiera sexangula: 15
1.0
Bruguiera
18 18 20 17 15 22 28 25
gymnorrhiza: 18 17 19
30 36 26
17 26 19 28 30 19 19
Aegiceras corniculatum:
Aegiceras
13 25 17 19 36 21 35 27
corniculatum: 18 13 19
19 24
17 19 21 18
Xylocarpus granatum: 25
Bruguiera cylindrical:
30 26 15 18 22 19 17 28
19 13 18 25 21 12 14
25 23 27 32 35
25
Sanneratia caseolaris:34 23
Sanneratia caseolaris:
35 33 25 17 27 19 15 15
19 18 23 27 18 25 27
19 20 27 25 40
17 18 14 20 21
Total: 1224
Total: 754(62%)
Index of function = [(VComposition+VRegeneration+VCanopy Cover) + (VTree Density+VBasal Area)/2]/4
MAINTAIN SPATIAL STRUCTURE HABITAT
Density of Counted standing dead 10
VSNAGS standing
trees in 10m radius plot
dead trees
Abundance
Counted very mature trees 20
of
very as far as able to view
VMATUR mature trees
0.1
0.5
0.34
1.0
3
0.1
1.0
11
0.5
12
Group 9 – K55TTKHMT– Environmental Science – HUS
VSTRAT
A
VPATCH
Number and
attributes of
vertical
strata
of
vegetation
Vegetation
patchiness
Gaps
forest
Estimated number of strata Trees: 75%
and their percent coverage
Saplings: 70%
Shrubs: 10%
Ground cover: 30%
1.0
Trees: 30%
Saplings: 50%
Shrubs: 8%
Ground cover: 20%
Viewed aerial photograph Appeared uniform
using Google Earth
1.0
in Viewed aerial photograph Appeared uniform
using Google Earth
1.0
Appropriate measure of 1.0
patchiness >75% and
<125% of reference
standard.
Number, distribution, 1.0
or size frequency of
gaps in the forest
canopy 75% to 125%
of reference standard.
0.62
VGAPS
Index of function = ((VSNAGS + VMATUR +VSTRATA+VPATCH+VGAPS) /5)
0.5
Total function index
Mitigation ratio
Failure adjusted mitigation ration
IV.
RESULT AND DISCUSSION
0.4525
2.21:1
7.37:1
TABLE: Index of variables for reference site and mitigation site at Xuan Thuy National Park, Nam Dinh City, Vietnam
Wetland function
Long-term surface water storage
Nutrient cycling
Maintain characteristic plant communities
Maintain spatial structure of habitat
Total function index
Index of variable
Reference site
Mitigation site
1
0.75
1
0.1
1
0.34
1
0.62
1
0.4525
13
Group 9 – K55TTKHMT– Environmental Science – HUS
Mitigation ratio
1:0.4525 = 2.21:1
Failure adjusted mitigation ratio
(2.21/0.30):1 = 7.37:1
The overall results are shown in table above. Comparing to the reference standard, the mitigation site had the longterm storage score of 0.75. Therefore, it can provide about 75% of ecological functions related to long-term surface water
storage delivered by the reference site. This result is logical since the mitigation site is adjacent to the reference site
accounting for their similar macrotopography. The nutrient cycling score of the restored site was only 0.1 proving that the
restored site was not good at providing biogeochemical functions. The scores for maintaining characteristic plant
community and spatial structure of habitat were 0.34 and 0.62 respectively. In other words, the mitigation wetland can
deliver a one-third level of functions as plant and three-quarters level as animal habitats compared to those provided by the
reference wetland.
The total function index based on the above four wetland ecological functions was 0.4525. It means that the
mitigation site can perform about 45% of ecological functions provided by the reference site. The mitigation ratio was 2.21
indicating that we need 2.21 hectares of mitigation wetlands to deliver the same level of functions provided by 1 hectare of
reference wetlands. Due to a failure rate of 70% for forested wetlands, 7.37 hectares of constructed forest wetland was
recommended to compensate for the loss of 1 hectare of natural forested wetland.
V.
CONCLUSION
The a mitigation ratio is 7.37: 1 which means that 7.37 hectares of the mitigation wetland is needed to replace 1
hectare of the natural wetland destroyed to ensure successful mitigation rate is 0.3.
Reference:
14
Group 9 – K55TTKHMT– Environmental Science – HUS
Thuy Thi Hong An, Hydrogeomorphic Assessment of Beanblossom Bottoms Nature Preserve Sycamore Land
Trust, 2011.
Prof. Christopher B. Craff, Wetlands: Biology and Regulation, Indiana University, 2011.
Mark M. Brinson, Richard D. Rheinhardt, F. Richard Hauer, Lyndon C. Lee, Wade L. Nutter, R. Daniel Smith,
Dennis Whigham, A Guidebook for Application of Hydrogeomorphic Assessments to Riverine Wetlands, 1995.
The Regional Training Course on Sustainable Use and Management of Coastal Wetlands, Mahidol University,
Thailand; A successful case in wetland resource management: Xuan Thuy National Park, Vietnam, 2007.
15