Báo cáo thực tập tiếng anh INTERNSHIP COMPANYINSTITUTION tan an company limited
Bạn đang xem bản rút gọn của tài liệu. Xem và tải ngay bản đầy đủ của tài liệu tại đây (247.32 KB, 40 trang )
The forms
(Attached to Directive ...... / KQT-ĐT day ... month ... 2015 of VNU-IS Rector)
Form 1: Cover sheet of the Graduate Internship Report
VIETNAM NATIONAL UNIVERSITY, HANOI
INTERNATIONAL SCHOOL
***
GRADUATE INTERNSHIP REPORT
INTERNSHIP COMPANY/INSTITUTION: Tan An Company Limited
Address: 9th floor JSC34 , lane 164 Khuat Duy Tien, Thanh Xuan, Ha Noi, Viet Nam
Supervisor: Mrs. Do Phuong Huyen
Student’s full name: Kim Thi Minh Hong
Student’s ID: 11071253
Major: International Business
Class: IB2012B
Hanoi,11st March 2016
1
Acknowledgement
To finish this report, I am deeply grateful to all those who have shared ideas,
valuable comments and encouragement during my writing of this paper.
First of all, I would like to express my deepest sense of gratitude to my supervisor,
Mrs. Do Phuong Huyen for her useful guidance, critical comments and valuable
suggestions.
Besides, my sincere thanks are also given to the Faculty of International Business,
International School for the devoted teaching of all the lecturers and for giving
methe knowledge and studying methods. Their teaching not only helps me gain
essential knowledge and skills during 5 years but also lays the foundation for my
future work.
I am greatly indebted to Mr. Nguyen Manh Linh, accountant of Tan An Company,
who introduced me to Export-Import Department and continuously encouraged me
during internship time at Tan An Company.
I must mention the wonderful working environment and group commitment of this
company that has enabled me a lot deal to do and observe the export and import
activities during my internship period of six weeks. I would particularly like to
thank all staff from Export-Import Department and all members of Tan An
company for their help, support and providing related information, data.
Last but not least, I convey my sincere thanks to my family friends who inspire in
different ways to complete the report and the course as well.
However, owing to my lack of experience and knowledge as well as the limited
scope of the research, some shortcomings and mistakes are unavoidable. Please
kindly take into account.
2
Form 3: Supervisor’s graduate internship assessment
VIETNAM NATIONAL UNIVERSITY, HANOI
INTERNATIONAL SCHOOL
SOCIAL REPUBLIC OF VIETNAM
Independence – Liberty - Happiness
Graduate Internship Evaluation
(for Supervisor)
Student’s full name: Kim Thi Minh Hong ………………………………………………………………
Student’s ID: 11071253.................................... Class: IB2012B………………………………
Major: International Business………………………………………………………………………………
Internship Company/Organization: Tan An Company Limited……………………………………………..
Supervisor:Do Phuong Huyen ……………………………………………………………………………………………………..
1. The performance of the schedule:
Internship period starts from 18th Jan 2016 to 11st Mar 2016……..……………………………………………….
………………………………………………………………………………………………………………………….……………………………
2. Awareness, attitude:
………………………………………………………………………………………………………………………………………………………
………………………………………………………………………………………………..
………………………………………………………………………………………………………………………………………………………
………………………………………………………Other
comments:
…………………………………………………………………………………………………………………………..
………………………………………………………………………………………………..
………………………………………………………………………………………………………………………………………………………..
………………………………………………………
Hanoi, …………………………………
Supervisor
(Signature and Full name)
3
Table of Contents
4
LIST OF TABLES, APPENDIXES AND FIGURES:
Figure 1: Tan An’s organizational chart........................................................................
10
Figure 2: Tan An’s value chain......................................................................................
13
Figure 3: Return On Assets of Tan An Company Limited............................................
26
Figure 4: Return On Equity of Tan An Company Limited............................................
28
Figure 5: Tan An’s Solvency Indicators Graph.............................................................
32
Table 1: Return On Assets Tan An Company Limited..................................................
26
Table 2: Return On Equity of Tan An Company Limited.............................................
27
Table 3: Current Ratio of Tan An Company Limited....................................................
29
Table 4: Liabilities to Assets Ratio of Tan An Company Limited................................
29
Table 5: Liabilities to Shareholders’ Equity Ration of Tan An Company Limited......
30
Table 6: Long-term Debt to Long-term Capital Ratio of Tan An Company Limited...
30
Table 7: Schedule of Internship......................................................................................
32
Appendix 1: Income Statement of Tan An Company Limited......................................
16
Appendix 2: Cash Flow Statement of Tan An Company Limited ..............................
18
5
Appendix 3: Balance Sheet of Tan An Company Limited
6
CHAPTER 1: REPORT OVERVIEW OF INTERNSHIP COMPANY/
INSTITUTION: TAN AN COMPANY
1. General information
1.1. Name of the company
Tan An Company Limited
Established in 1995
1.2. Address of headquarters
9th floor, JSC34 Building, lane 164 Khuat Duy Tien, Thanh Xuan , Hanoi, Vietnam
Phone: +844.22111025
Fax: 844.22250750
Email:
Website: www.tananco.com
1.3. Legal representative of the company
Position: General Director
Full name: Truong The Son
1.4. Industry and Business fields
Tan An does up to 73 business lines which are divided mostly into Construction
Industry and Commercial Industry
1.4.1 Exploiting
In order to serve for the manufacturing procedure and exporting raw materials to
foreign countries (especially to China), Tan An company registered to exploiting
-
some natural resources legally:
Wood and forestry products;
Coal, peat, iron ore and mental ore;
Sand, stone, gravel, clay.
Those resources are used for the manufacturing activities of the company as listed
after.
7
1.4.2 Manufacturing
Raw materials after being exploited will be used to produce finished goods which
-
are divided into:
Chemical products
Electronic components, consumer electronic and other machines, measurement
equipment;
Batteries and accumulators;
Wooden products.
These finished goods will be distributed domestically to subsidiaries and also for
exporting purpose.
1.4.3 Business
Tan An Company has been doing its business in both domestic and foreign markets.
The company imports such products as electrical products and other products which
are needed in Vietnamese markets or sometimes re-export to another country. The
-
produced goods or imported goods are wholesaled inbound and exported outbound.
Industrial chemical;
Forestry products, agricultural products;
Electrical products;
Many other products;
In addition, there are two researching centers aiming to develop its projects and
-
products:
Projecting center;
Testing measurement equipment center.
1.4.4 Investing
Besides above business activities, the company penetrated into investment with the
-
launching of:
Building Phu Mau hydropower plants;
MDF wood factories.
The company activates widely in many aspects, especially focuses mostly in
manufacturing activities and export – import activities. By producing products by
themselves, the company has achieved successfully in exporting Vietnamese
wooden items like handicraft as a Vietnamese traditional product to foreign markets
dedicating to the expansion Vietnamese brand to the world.
8
-
2. Key milestones operating history
1995: Tan An Company is founded
2004: In late 2004, Tan An Co., Ltd. started construction cluster of Phu Mau
Hydroelectric plant at Phu Mau village, Liem Phu, Van Ban District, Lao Cai
Province, Vietnam. The company officially inaugurated the plant in 2009. The plant
consists of three shelves, total capacity of 7.5 MW, water column height 250m
approximately.
Phu Mau Hydroelectric Plant 1:
Installed capacity: 1.4 MW.
Water column height calculation is: 80m.
Commercial electric power production: July 2007
• Phu Mau Hydroelectric Plant 2:
Installed capacity: 1.8 MW.
Water column height calculation is: 150m.
Commercial electric power production: October 2006
• Phu Mau Hydroelectric Plant 3:
Installed capacity: 2.4 MW.
Water column height calculation is: 250m.
Commercial electric power production: September 2008
2008: the company has joint ventures with Chinese partners to build Ferro
•
-
Mangan factory. Its main products are ferro-mangan carbon low average, ferromangan carbon high, silinco mangan alloy. These products are essential
materials for molding industry and steel production, total output of about
-
100,000 tons per year.
2009: Tan An MDF Wool Factory- Vinafor Hoa Binh began construction in
2009 and has been running at full capacity since 2013. Main product of the
factory is MDF synthetic wooden plank with thickness from 8-25mm, 2.440mm
height and 1.220mm weight. This kind of plank is convenient for the
construction, interior and exterior works. Total capacity of the factory is 54,000
-
m3 per year.
2015: the company has been researching technological line to produce ferro
mangan carbon low-average, typical products are FeMn 80C0.5, FeMn80C2.0,
FeMn80C1.0, FeMn80C0.7 and FeMn75C2.0, included two refining furnace
1800KVA reaching the output of 28,000 tons per year.
9
3. Mission, Vision and Core Value
With the motto “Cooperation - Development”, Tan An Company expressed
-
determination to quickly make Tan An Co., Ltd become a powerful company.
The work of Tan An Company is to import raw materials of chemicals,
metallurgical materials, machines and equipments to serve for the domestic
industry.
4. Organizational structure
The main structure of the company will be illustrated below:
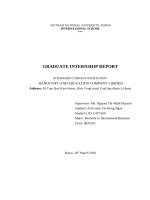
Figure 1: Tan An organizational chart.
Source: www.tanangroup.com
10
Board of Directors
Chairman
General Director
Accounting Department
Export-Import
Department
Hydroelectric Project
Department
General Trading
Test and Measurement
Department
Equipment Depart ment
4.1 Functions and duties of the Board of Directors
4.1.1 Chairman
- Directing and urging the entire operations of the company;
- Planning and specifying corporate development orientation;
- Making decisions about emulation, reward and discipline;
- Signing the company’s expenditure…
4.1.2 General director
- Being a legal representative of the company;
- Being authorized to sign the financial reports, economic contracts;
- Proposing staffing issues, salaries of departments to the chairman of the
company to sign the decision.
11
4.2 Functions and duties of the departments
4.2.1 Accounting Department
- Money out - making payments and keeping the bills paid
- Money printing - processing incoming payments
- Payroll - make sure everyone gets paid (Including the government
-
requirements)
Reporting - Preparing Financial reports, balance sheets and budgets
Financial Controls - to avoid errors, fraud and theft.
4.2.2 Export-Import Department
- Managing and execute external activities, analysis, market expansion and
-
product introduction.
Exploiting domestic and imported alloy for supply of materials, goods for
-
production and business.
Managing exports of products produced and distributed by the company.
4.2.3 Hydroelectric Project Department
- Building all hydroelectric systems of the company
- Combining with foreign partners in order to produce, provide, install
mechanical equipment systems, hydraulic equipment and control all
hydroelectric plants
4.2.4 General Trading Department
- Making the business plans and methods to implement the plans
- Managing the cost of materials, fuel and raw materials
- Managing revenue and customer liabilities
- Drafting of economic contracts, contract of sale, capital contribution ...
4.2.5 Test and Measurement Equipment Department
- Providing equipment and solutions for test and measurement
- Supplying equipment for science and technology, education and health care…
- Information technology and telecommunications.
12
5. Products, market and target customers
Tan An is a general trading company so it has a wide range of products to meet with
different customer demands. However, the company focuses mainly on producing
and developing three main products: hydroelectric plant construction, wood and
alloy.
For wood and alloy, markets that company selling is foreign market such as China,
Korea, Japan, Israel. Because the demand of wood and ore is really huge in these
countries and customs procedures of the countries are not too strict for the
company’s products. Customers of the products are mainly small and medium
enterprises.
Contrast to wood and alloy, hydroelectricity plant construction is for only domestic
market. Customers of this kind of product are hydroelectric systems in Tay Nguyen
where gathers many hydropower plants.
CHAPTER 2: REPORT ON THE TAN AN COMPANY’S BUSINESS
ACTIVITIES
1. Business activities
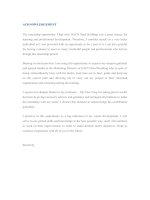
1.1 The company’s value chain
Exploitin
g
Producin
g
Distributio
n
Wholesale
domesticall
y
Importing
Exporting
13
Figure 2: Tan An’s value chain
(Source: General Trading Department)
1.1.1 Exploitation and importation
For the purpose of doing business, every company need to find out the material
resources and then go to get that materials by any methods. In Tan An company,
there are two ways of taking the materials resources: exploiting natural resources or
importing such kind of raw materials or products, machines, technologies, etc.
There will be described deeply about raw materials not machines and technologies
(because of the use of supporting for producing).
Sources of resources:
-
Exploiting: As registered to the Vietnamese law, Tan An company is
allowed to take advantages of natural resources at Northern areas
where are woods from timber forests and mixed forests with bamboo
wood, pure bamboo forests and mixed wood forests; and ore
exploitation mainly in Quang Ninh, Thai Nguyen and Ninh Binh
province but it is just a small partial of mental ore and wood sources
which are main ingredients for producing and doing business at Tan
-
An.
Importing: This is the main source of Tan An for distributing within
boundary and production. With the highly demand of woods
domestically, the company has been importing woods from the Africa
and the Americas for years in such countries as: the Republic of the
Congo, Colombia, Gabon, Cameroon, Angola, etc; whereas China is
always the main land for Tan An company to import mental ores over
a decade.
Workers and employees:
14
-
Blue-collar workers: there is no need to have education-based for
those who want to work in the sites, as long as their health are good
enough, having experiences and especially clearly understand about
-
the objects they are exploiting (normally natives priority).
White-collar employees: normally act as supervisors and importers. In
Tan An, all employees were got at least a bachelor degree and are
trained professionally before working officially for Tan An company.
Standard of importing:
-
For many years co-operation, both parties are in close relationship and
therefore raised the standard of each importing contract: delivery
commodity, international payment, incoterms or insurance are solved
-
rapidly and fairly each time has any problem.
About the products, after delivery, the foreign countries always sent
the samples to Tan An company for comparison afterward. If there are
any miss-matched with the sample or any damage of goods, then both
parties go to deal together. In fact, this case rarely happens while
trading between Tan An and foreign companies.
1.1.2 Production
After the first process, those raw materials will be transferred following 2 ways:
distributing directly to customers (wholesale to other domestic companies) or being
processed until becoming finished goods. The company focuses on investing in
production, because production is fundamental for the company to develop stably.
The importing raw materials is for producing furniture, handicraft items, and also
for supplying to other business within Vietnamese boundary.
Place of factories: Tan An company owns:
-
An iron factory in Ninh Binh province where processing the mental ores to
supply building materials for the Vietnamese market.
15
-
Phu Mau hydroelectric plants in Lao Cai province where supplies the electricity
-
for some institution and company.
MDF factory: main product of the factory is MDF synthetic wooden plank with
thickness from 8-25mm, 2.440mm height and 1.220mm weight.
1.1.3 Marketing, sale and distribution
The company use online sales and catalogs and direct mail to approach customers
and sell products. As the contract is signed, the company has its own specialized
logistics team in charge of completing procedures and distribute to customers.
2. Financial and accounting activities
2.1 Roles and position of financial and accounting activities
- Helping the company to regularly monitor the operations of business
production: manufacturing processes, monitoring the market and so on. In this
-
way, manager can administrate activities fluently and control internal better.
Providing business documents as a basis for planning programs for each stage,
for each period. Thus managers can evaluate job performance, outlines the
-
future direction.
Being the legal basis for dispute resolution complaint, as evidence of
-
commercial practices.
Risk management and insurance for businesses.
2.2 Strategy
- Strengthening the financial resources, both in scale and structure.
- The financial resources should be allocated reasonably and used efficiently to
ensure basic needs for training activities, scientific research, international
cooperation and other activities.
2.3 Analyzing company financial statements
FINANCIAL STATEMENTs FROM 2012 TO 2014
16
Appendix 1: Income Statement of Tan An Company Limited from 2012 to 2014.
INCOME STATEMENT
Tan An Company Limited
2012-2014
Unit:VND
(Source: Accounting Department)
Criteria
Revenue from
1
sales and services
Revenue
2
deductions
Net revenue from
2012
471,269,121,81
4
2013
2014
548,662,181,579 543,820,640,645
17,000,000
471,269,121,81
3
4
sales and services
Cost of goods sold
Gross profit from
4
548,662,181,579 543,803,640,645
454,164,371,171 522,817,956,124 521,811,016,337
5
sales and services
Financial activities
17,104,750,643
25,844,225,445
21,992,624,308
6
income
Financial activities
801,734,601
283,713,491
3,171,801,405
7
expenses
Interest expenses
Selling expenses
General and
8,836,588,117
5,538,181,854
7,037,779,123
7,277,689,784
6,655,978,903
0
6,618,059,404
5,631,436,768
0
8
administration
9
10
11
12
13
expenses
Operating income
Other income
Other expense
Other profit
Earnings before
2,107,399,504
-75,281,500
1,820,385,159
3,804,213
1,816,580,946
12,072,614,575
6,777,625,587
817,500,303
200,757,146
616,743,157
11,983,560,281
6,862,806,028
0
114,897,354
-114,897,354
14
taxes
1,741,299,446
7,394,368,744
6,747,908,674
17
Current business
15
income tax charge
Deferred business
62,477,764
456,311,517
400,944,922
16
income tax charge
Earnings after
0
0
0
17
income tax
1,678,821,682
6,938,057,227
6,346,963,752
18
Appendix 2: Cash Flow Statement of Tan An Company Limited from 2012 to 2014.
CASH FLOW STATEMENT
Tan An Company Limited
2012-2014
Unit: VND
(Source: Accounting Department)
Criteria
I Cash flows from
operating
activities
1 Profite before tax
2 Depreciation
3 Provisions
4 Loss/gain on
exchange
differences
5 Loss/gain on
investment of other
enterprises
6 Interest expense
7 Other cash paid for
operating activities
Net cash flow from
operating activities
II Cash flows from
investing activities
1 Capital for fixed
assets and other
long-term assets
2 Cash received from
investing in other
units
3 Invested capital in
other units
4 Capital received
2012
2013
463,881,256,610
245,069,208,470
-5,049,281,661
-7,602,237,686
-58,683,826
-7,602,237,686
-25,098,769,942
189,759,359,34
1
2014
531,908,762,81 912,533,731,172
9
220,263,115,17 593,361,236,300
8
-5,825,627,859
-6,168,268,254
-7,632,369,082
-6,448,719,074
-82,477,764
-574,992,029
9,402,058,332
6,701,794,768
289,504,918,77 372,289,546,415
8
18,002,249,490 -59,607,236,132
-777,272,727
-144,505,455
0
0
0
-19,500,000,000
0
0
-15,876,171,892
0
1,055,291,192
0
19
from investing in
other units
Net cash flow from
investing activities
III Cash flows from
financial activities
1 Receipts from share
issuing and owners
equities
contribution
2 Payment for owners
equities and
purchasing issued
share
3 Receipt from shortterm and long-term
borrowings
4 Repayments of
borrowings
Net cash flow from
financial activities
Net changes in cash and
cash equivalents
Cash and cash equivalent
at the beginning of the
period
Differences in exchange
rate affection
Cash and cash
equivalents at the ending
of the period
-777,272,727
910,785,737
-35,376,171,892
0
0
16,000,000,000
-1,364,769,605
-1,033,433,333
0
121,616,021,026
397,484,562,04 603,810,538,062
0
299,928,022,797
411,472,509,24 539,921,237,043
9
-15,021,390,542 79,889,301,019
179,676,771,376
7,405,315,238
3,891,644,685
-15,094,107,005
7,295,488,359
14,709,287,597
18,600,923,282
0
0
0
14,700,803,579
18,600,923,282
3,506,816,277
Appendix 3: Balance Sheet of Tan An Company Limited from 2012 to 2014.
BALANCE SHEET
Tan An Company Limited
2012-2014
20
Unit:VND
(Source: Accounting Department)
Assets
2012
2013
177,170,811,48
2014
A
Current assets
Cash and cash
157,575,030,335
6
238,324,120,664
I
equivalents
Cash and cash
14,700,803,597
18,600,923,282
3,506,816,277
14,700,803,597
18,600,923,383
3,506,816,277
investments
short-term
9,400,000,000
0
6,700,000,000
1 investments
Short-term
9,400,000,000
0
147,483,242,45
6,700,000,000
116,706,896,731
9
215,237,534,380
91,172,168,573 115,652,977,883
172,783,114,024
1 equivalents
Short-term
financial
II
III
receivables
Receivables from
1 customers
Advanced
payments to
2 suppliers
3 Other receivables
IV
Inventory
1 Inventory
Other short-term
V
assets
Short-term prepaid
1 expenses
2 Deductible VAT
Other short-term
B
I
3 assets
Long-term assets
Long-term
receivable
25,109,472,358
425,255,800
14,285,490,747
14,285,490,747
30,009,793
1,730,471,206
9,347,627,063
9,347,627,063
40,247,660,497
2,206,759,859
9,376,135,453
9,376,135,453
2,481,839,260
1,739,018,682
3,503,634,554
1,419,529,905
293,498,382
1,739,018,682
0
1,881,388,193
1,622,246,361
768,810,973
96,091,463,966
0
82,930,084,068
0
90,344,111,545
0
108,193,578
334,908,293
21
Other long-term
1 receivables
II
Fixed assets
Tangible fixed
0
46,420,845,758
108,193,578
36,818,430,490
334,908,293
28,129,571,360
46,420,845,758
97,136,415,588
36,818,430,490
97,114,716,300
28,129,571,360
97,114,716,300
-50,715,569,830
-60,296,285,810
68,985,144,940
1,937,000,000
1,937,000,000
0
0
0
0
0
0
0
47,733,618,208
46,003,460,000
61,879,631,892
47,733,618,208
46,003,460,000
61,879,631,892
assets
Total assets
Resources
Liabilities
Short-term
0
0
253,666,494,301 260,100,895,554
0
328,668,232,209
141,530,051,420 142,059,838,779
188,293,456,227
liabilities
Short-term
117,214,552,102 126,752,595,205
178,284,109,651
1 assets
Cost
Accumulated
depreciation
Real estate
III
investment
Cost
Accumulated
depreciation
Long-term
financial
IV
investments
Investment in
joint-venture, joint
1 operation
Other long-term
V
A
I
borrowings and
1 liabilities
Payable to
79,444,629,879
74,490,711,360
143,698,973,803
2 suppliers
3 Deferred revenue
Taxes and other
36,634,458,654
727,052,734
48,877,290,777
1,848,667,600
32,567,009,492
1,003,333,630
369,167,538
1,372,636,802
858,618,990
payables to the
4 State budget
22
Accrued
5 exxpenses
6 Other payable
Bonus and welfare
7 funds
Long-term
II
liabilities
Long-term
39,243,297
0
163,288,666
0
126,173,736
0
0
0
0
24,315,499,318
15,307,243,574
10,009,346,576
24,315,499,318 15,307,243,574
112,136,442,881 118,041,056,775
112,136,442,881 118,041,056,775
109,044,129,395 108,010,686,062
10,009,346,576
140,374,775,982
140,374,775,982
124,010,686,062
borrowings and
B
I
1 liabilities
Owner's equity
Owner's equity
1 Paid-in capital
Investment and
development
2 funds
Financial reserve
0
0
0
3 funds
Undistributed
0
0
0
3,092,313,486
10,030,370,713
16,364,089,920
0
0
0
0
0
0
253,666,494,301 260,100,895,554
328,668,232,209
4 earnings
Construction
5 investment fund
Other funds and
II
budgets
Total liabilities
and equity
2.4 Analyze cash inflow from 2012-2014
Comparing cash and cash equivalent at the beginning and the ending of the period,
in 2012 the amount of money increased dramatically to more than seven billion
VND. In 2013 the change decreased by half, the amount was nearly four billion
VND. But in 2014, the trend was reserved spectacularly, the amount of cash at the
ending of the period did not increase, it decreased from more than 18 billion VND
23
to 3.5 billion VND despite increasing sharply in profit before tax. This is because in
2014 Tan An spent 35 billion VND on investing activities and depreciation in 2014
doubled in 2012 and 2013. Cash flows in 2014 seem to be opposite to cash flows in
2012 and 2013 as cash flows from financial activities in 2012 and 2013 were
negative whereas in 2014 was positive.
In 2012 and 2013, cash inflow mainly from sales and providing services (profit
before tax). These amount account for remarkable percentage of cash inflow in both
2012 and 2013; it continued to increase rapidly in 2014.
There is a difference in 2014, profit from selling products and providing services
were highest in three-year period but they did not contribute any money into cash
inflow. That is because the burden of depreciation, cash paid for other operating
activities was too big for revenue to cover all. Primary cash resource not from
operating activities; the company's cash inflow is contributed largely by financial
activities. Money receipt from short-term and long-term borrowings contributed six
hundred billion VND and receipts from share issuing and owners’ equities
contribution contributed sixteen billion VND - this is the big turning point in the
financial developments of the company as two year ago the amount was zero. This
point proves that the company has strong transformation in the structure of their
capital from intensive debt to intensive equity. It also means that instead of pressure
from interest payments, the company is beginning to bear the pressure of paying
dividends and profits for its shareholders. However the company will be more
beneficial in the payment flexibility with pay policies in future.
2.5 Analyze investing activities
Investing activities of Tan An in 2012 was only for fixed assets and others longterm assets. That means the company wanted to expand production. However this
amount was not big (just eighty hundred million VND).
In 2014, Tan An company increased the amount of money in invested capital in
other units. Namely, the company associated with a Chinese company in order to
24
research the production technology to increase the amount of ore mining in the
future and therefore increasing revenue sharply. Because in recent years, the
company has realized the potential of mining and exporting ore as constantly
receiving orders from foreign customers for the large amount requested at very high
price.
2.6 Analyze financial activities
Net cash flow from financial activities soared in three consecutive years and
looking at receipt from short-term and long-term borrowings we can find the
reason. The amount of money the company received through lending out could be
considered as one of main cash inflow to the company. Notably, in 2014, the
amount received from its lending was two times compared with 2013 and six times
compared with 2012.
2.7 Profitability Indicators
2.7.1 Return On Assets (ROA)
This is an indicator of how profitable a company is relative to its total assets. ROA
gives an idea as to how efficient management is at using its assets to generate
earnings. Calculated by dividing a company's annual earnings by its total assets,
ROA is displayed as a percentage.
The formula for return on assets:
Net income (VND)
Total asset (VND)
ROA
2012
1,678,821,682
253,666,494,301
0.66%
2013
6,938,057,227
260,100,895,554
2.67%
2014
6,346,963,752
328,668,232,209
1.93%
Table 1: Return On Asset of Tan An Company Limited from 2012 to 2014.
25