RESEARCH ON MECHANICAL PROPERTIES OF QUATERNARY SEDIMENTS DISTRIBUTED IN HANOI AREA UNDER DYNAMIC LOADS
Bạn đang xem bản rút gọn của tài liệu. Xem và tải ngay bản đầy đủ của tài liệu tại đây (371.59 KB, 28 trang )
MINISTRY OF EDUCATION AND TRAINING
UNIVERSITY OF MINING AND GEOLOGY
NGUYEN VAN PHONG
RESEARCH ON MECHANICAL PROPERTIES OF QUATERNARY
SEDIMENTS DISTRIBUTED IN HANOI AREA
UNDER DYNAMIC LOADS
Specialty: Geological Technology
Code: 62.52.05.01
SUMMARY OF DOCTORAL THESIS IN GEOLOGY
HANOI - 2016
The research has been accomplished at:
Engineering Geology Department, Faculty of Geosciences and
Geoengineering, Hanoi University of Mining and Geology
Supervisors:
Assoc. Prof. Dr. Le Trong Thang
Hanoi University of Mining and Geology.
Reviewer 1: Dr. Nguyen Viet Tinh
Hanoi University of Mining and Geology
Reviewer 2: Assoc. Prof. Dr. Doan The Tuong
Vietnam Institute for Building Science and Technology
Reviewer 3: Assoc. Prof. Dr. Do Minh Duc
University of Sciences, Vietnam National University
This thesis is going to be defended at the committee of doctorate thesis
examiners of Hanoi University of Mining and Geology, Duc Thang ward,
Bac Tu Liem district, Hanoi, Vietnam on 08:30 date …..month…..year 2016.
This thesis can be found at National Library, Ha Noi or Library of
Hanoi University of Mining and Geology.
1
INTRODUCTION
1. The urgency of the subject
Dynamic loads are temporary and generated by two sources: natural
sources (earthquakes, collapsed caves, slides, ...) and artificial sources
(machines, hammers, transportation, ...). The research on soil mechanical
properties under dynamic load (referred to as "dynamic properties") is very
important in the design foundation.
Hanoi is the Capital of Vietnam with a population of greater focus, along
with strong growth in economy, the construction activities are developing and
giving rise various types of dynamic loads. In addition, Hanoi is located in the
7-8 earthquake zone, some places are 9. As a greater construction, the impact of
earthquakes and other seismic are also increasing. Other hand, the loads (static
and dynamic) decrease with the depth. Whereas, the upper ground layers in
Hanoi area are mainly sediments of the Holocene, Pleistocene of Hai Hung,
Thai Binh and Vinh Phuc formations, these soils are quite sensitive to the
effects of dynamic loads. However, the information about the dynamical
properties of these soils are not sufficient for the research, planning, designing
and constructing of building foundation. Therefore, “research on mechanical
properties of quaternary sediments distributing in the Hanoi area under dynamic
loads” is urgent and topical.
2. Objectives
Determining the soil dynamical properties, including strength and
deformation of typical soils in the research area, as well as their variations, in
order to serve the research, planning, designing and constructing of building
foundation purposes under dynamic loads.
3. Object and scope
The objects of the study are the dynamical properties of (cohesive and
granular) soils belong to Hai Hung, Thai Binh and Vinh Phuc formations.
Scope areas of the study are the regions of urban districts and Thanh Tri district
of Hanoi City.
4. Contents
- An overview of soil dynamics;
- Research on the theoretical basis of soil dynamical properties;
- Engineering geological characteristics of Quaternary sediments in Hanoi
area and the methods to study dynamical properties of the soil;
- Experimental study of dynamical properties of Quaternary sediments in
Hanoi area.
5. The approach and methodology
+ The approach:
- Systematic approach: The problems are detected from the practice;
research in an integrated way to find out the theoretical models and methods;
2
identifying suitable ones; studied by experiment, synthesis and analysis of
results to solve the problems.
- Inherited approach of knowledge and experiences selectively in the
dynamics studies
- Combining theory and experiment
+ Methodology:
- Synthetic and codified methods of documents on: soil dynamics studies
in and outside the country in order to detect the studied problems; geological
and engineering geological studies in the area to clarify the objects and scope of
the study
- Theoretical methods: to find the rules and the factors affecting the
dynamic properties;
- Geological methods: study of geological characteristics in the area;
- Experimental methods: performing experiments to determine the physical
and mechanical characteristics of the soil;
- Mathematical - informatical methods: data processing.
6. Scientific and practical significances
Contributions to the science: the research results contribute to clarifying
the dynamical properties of the sedimentary formations in the area and the
behavior rules of them under the impact of the dynamic force, to serve the
planning and construction design; contribute to improving and systematizing
the theoretical basis of dynamic properties; providing additional information
necessary for following dynamical studies.
Contributions to practices and research: the research results are as a basis
to build the processes, to select input parameters for dynamic triaxial testing;
the research results are also as the basis data for solving the ground model with
dynamic loads; supplying information for forecasting the risk of the ground
under the effect of the earthquake and studying the effects of seismic activities
on the geological environment and buildings.
7. The scientific arguments
- Argument 1: the process of cyclic deformation of the soils was divided
into four stages. Each stage is characterized by a type of stress - strain loop and
dynamical properties which depend on soil type, characteristics of the loads and
stress conditions. In particular, the linear limit of the deformation equivalents to
the limit of volumetric strain.
- Argument 2: the cohesive soils in the research area are collapsed in the
form of plastic slip. Whereas, the saturated sands of the Vinh Phuc and Thai
Bình formations can be liquefied or not depend on the correlation between
particle size, density and the parameters of the dynamic forces. The boundaries
of cyclic resistance ratio (or liquefaction) of them are described by the
expression based on Geniev theory with empirical coefficients of each soil.
3
8. Innovative aspects
- The thesis has identified the cyclic deformation characteristics of the
research soils based on direct experiments by cyclic triaxial test, and dynamic
deformation has been divided into four phases based on evaluation methods of
stress - strain graphs and loops; clarifying the difference between static and
cyclic deformation.
- By the experimental data, the thesis has built up the expression that
describing the variation of cyclic deformation of the soils in the research area.
The thesis also points out the similarities between the limit of linear
deformation with the volumetric strain limit that is useful for further studies.
- The cyclic strength of cohesive soils and the liquefaction of fine sand in
the research area are determined directly by cyclic triaxial test. The concept of
liquefaction is clarified on the basis of quantifying specific criteria, thereby the
liquefaction possibility of fine sands is evaluated depending on the density.
- Using Geniev theoretical basis, the thesis has built up the expression
combining theory and experiment to describe the rule of cyclic strength, and the
experimental coefficients were determined for each soil type. Thus, the rule of
cyclic strength of each soils is described in a simple and clear way by
mathematical expressions, that help the application of research results are more
favorable.
- The thesis has predicted quantitatively the possibility of instability of
soils under earthquake effects in the most adverse conditions based on reliable
experimental coefficients of each soil.
9. Dissertation layout
The contents of the thesis consists of 5 chapters and illustrated with 56
tables, 99 figures and graphs, 9 appendices, 14 research publications and items
of 76 references.
10. Database
The thesis was completed on the basis of experimental data that is
performed directly by the author, as well as the research results have been
published in the Scientific - Technical journal of Mining and Geology (3
articles), Scientific conference Report of the university of Mining and Geology
(3 articles). The contents of the thesis are inherited from the projects that were
chaired by candidate PhD: T12-32; CTB 2012-02-03; and the project B12-0207 chaired by Assoc. Prof. Dr. Le Trong Thang, the candidate PhD is
participation. The thesis is also the result of "Project of capacity strengthening
of the Geotechnical Laboratory."
4
Chapter 1. OVERVIEW OF SOIL DYNAMICS STUDIES
1.1. The concept and contents of soil dynamics studies
Soil dynamics is a part of Soil Mechanics, studies the behavior of soil
under the effect of dynamic loads. Its contents can be divided into 3 groups: 1)
Research on the effect of dynamic loads to changing the physical properties of
the soil; 2) Research on soil strength and deformation under the effect of
dynamic loads; 3) The research on models of the soil behavior with dynamic
loads.
1.2. Overview of the research status in the world
The research on the change of soil properties under the effect of dynamic
loads: the variation of soil cohesion force, friction angle (Porovski, 1934); void
ratio and permeability coefficient changing (Barkan, 1962); the variability of
microstructure, thixotropy phenomenon (Sukina, 1985) and undrained strength
characteristics under dynamic loads (Cadagrander, Seed, Onxon,...).
The research on the sand liquefaction: determining the relationship
between the deviation of cyclic stress caused liquefaction with the duration of
action (Seed and Lee, 1965); studying the variation of sand liquefaction and
factors affecting by experiment (Seed and Idriss, 1971; Noorany and
Uzdavines, 1989; Shamsher Prakash and Vijay K.puri, 2003; Sitharam,
Ravishankar, Jayan Vinod, 2008); research on liquefaction of sand in different
density and provided models of dynamic loads to determine the point of
liquefaction (Ishihara, 1985); using the method of controlled deformation to
study liquefaction (Sitharam, Ravishankar, Jayan Vinod, 2008); building the
relationship between the ability of sand liquefaction with field test results (Seed
and Alba, 1986; Ronald and Kenneth, 1999; Idriss and Bowlanger, 2004).
The research on cyclic strength of cohensive soil: determining the
collapsed point at the level of strain equal static collapse (Kokusho et al, 1971);
research on cyclic strength of cohesive soil at the level of stress deviation close
to damaging static stress (Ishihara, Nagao, and Mano, 1983; Ishihara and
Kasuda, 1984); studying the variability of cyclic strength by Kenvin - Voit
adjustment model (Geniev, 1997).
The research on cyclic deformation of the soil: the theoretical basis based
on Kelvin - Voit model (Barkan; Arnold Verruijt; Kenji Ishihara; Shamsher
Prakash,...); studying the soil cyclic deformation in the elastic phase (Hardin,
Richart, 1963; Stokoe, 1978; Grant and Brown, 1981; Hardin and Black,
1968;...), and in the linear and nonlinear phase (Ishihara, 1984; Vučetić,
1994;...); the variation of cyclic strain characteristics (Ishihara, 1984; Vučetić,
1994; Bratosin, 2002,...); the factors affecting the cyclic strain characteristics
(Alarcon, Guzman (1989); Darendeli, 2001;...); the influence of the sample
(Kumar and Clayton, 2007); the experimental relationships to determine Gmax
according to the results of SPT, CPTU (Seed, Lee, Imai,...).
5
The research on models of the soil behavior with dynamic loads: study
modeling and parameter matrix (Miura, Masuda -1995; -1996 Naggar and
Novak;...); modeling solution methods for ground – foundation system based on
assumptions elastic deformation, equivalent linear deformation (Tamori,
Kitagawa - 2001) and nonlinear deformation (Kusakabe, Yasuda -1994; Miura,
Masuda – 1995).
1.3. Overview of the research status in Vietnam
Studies in Vietnam also includes three groups: 1) Research on the effect
of dynamic loads to changing the physical properties of the soil (Nguyen Huy
Phuong and Tran Thuong Binh - 2006); 2) Evaluation of sand liquefaction of
Thai Binh formation based on the results of SPT (Pham Van Ty et al - 1990);
The study on the issue of dynamic consolidation, dynamic strength, sand
liquefaction and evaluation of the sensitivity of the soil under the effect of the
earthquake in Hanoi (Nguyen Huy Phuong et al - 2011); 3) The research on
models of the soil behavior with dynamic loads: seismic zoning studies in
Hanoi by Institute of Geophysics (1990); modeling studies the ground – pile
system to calculate the transmission of seismic waves when driving pile (Pham
Huy Tu - 2003); modeling the ground – pile under horizontal dynamic load
(Ngo Quoc Trinh - 2014).
1.4. Comments and Recommendations
1.4.1. Commenting on the research results in the World
The study results showed that the influence of the dynamic load to the
variation of soil properties. The study of sand liquefaction showed: the
liquefaction occurs in saturated sandy soil; the rule of liquefaction is
represented by the boundary of liquefaction resistance ratio. There are two
methods commonly used to study the cyclic strength of cohesive soils:
surveying the relations of stress and strain at the strain threshold close to static
collapse, and using dynamic loading in the stress deviation close to collapsed
static stress; the variation of soil dynamic strength can be expressed in terms of
Geniev theory. The cyclic strain characteristics vary with the soil deformation
and can be determined by many different experimental methods. The studies of
soil behavior model under dynamic loads are used to study transmission stress
in the ground and the behavior of the ground - foundation system under
dynamic loads.
1.4.1. Commenting on the research results in Vietnam
1) Achieved results: These studies have adequately addressed the deserve
attention issues in soil dynamics.
2) Some restrictions: the theoretical basis of soil dynamics has not been
systematized adequately; the dynamical characteristics of the soil have not been
determined directly; The factor affecting the dynamic properties of the soil has
not been studied; The study of soil behavior model has not used directly
dynamical characteristics of the soil;
6
3) The issues should be studied in Vietnam: the theoretical basis of soil
dynamical properties should be systematized sufficiently; the characteristics of
soil dynamical deformation and strength (or liquefaction) should be
experimented directly; and simultaneous identification of the rules of their
variation (build up the boundary of dynamical resistance ratio), in service for
the evaluation of work stability under dynamic loads and earthquake; build up
behavior models of ground - foundation system under dynamic loads for each
type of background structure (in an area), which uses the dynamic characteristic
of the soil. Based on the research objectives and domestic equipment
conditions, this thesis focused on the first three issues based mainly on the
results of cyclic triaxial test.
Chapter 2. THE THEORETICAL BASIS OF SOIL DYNAMICAL
PROPERTIES
2.1. Concepts, classification and calculation of dynamic loads
The load that its eigenvalues change over time F = F (t) is known as
dynamic load. This load is temporary and is divided into types: circulatory,
non-circulatory, harmonic, harmonic damping. Harmonic load is described by a
sinusoidal, while the circulatory load is described by a chain of harmonic
oscillator.
Dynamic loads (or stresses) are calculated based on ground earthquake
acceleration or other seismic forces. For machine foundation, the load is
determined by the eccentricity and the angular frequency of the machine.
2.2. Soil dynamical properties and research models
Soil dynamical properties are the ability of the soil to behave
mechanically under the effect of dynamic load, including: cyclic deformation is
the ability to change the shape and volume of the soil; cyclic strength is the
ability of the soil bearing maximum stress in a certain period without being
collapsed.
Cyclic deformation is studies based on Kelvin - Voigt model, along with
oscillation theory of a degree of freedom system. Cyclic strength can be studies
based on Kelvin - Voigt adjustment models (elastic element is replaced with
plastic elements) and Geniev theory.
2.3. Theoretical basis of soil cyclic deformation
Cyclic deformation theory based on the analysis of a degree of freedom
system under harmonic oscillator force. Accordingly, cyclic deformation of the
soil is completely determined if known the dynamical characteristics, that are
dynamic module (Gd) and damping ratio (D).
The phases of cyclic deformation
Based on the relationship between stress - strain, N. M. Ghexevanov
divided soil deformation into three phases [9]: compaction phase; plastic
deformation phase; sliding deformation phase. In the cyclic deformation
7
research, soil strain is divided into 3 phase based on the degree of strain [75]:
very small strain, the strain ( is smaller than the threshold of elastic strain (tl);
small strain, when is larger than tl and smaller than the threshold of
volumetric strain (tv); medium to large strain: the strain is larger than 10-2%
to a few percent.
Based on the characteristics of each phase and mechanical models can be
used, the thesis divided the soil deformation into four phases: elastic, assuming
elastic (linear), elastic - plastic (non-linear) and slide (summarized in table 2.2).
Table 2.2. The phrases of soil cyclic deformation
The
Deformation
The model of Deformation
Volume
degree of
characteristics
the phases
phrases
change
strain
Change
Type of loads
Elastic
(≤ tl)
-
very
small
No
Assuming
elastic
tl ≤ ≤ tv
linear
(compaction)
small
Yes
Yes
Transportation,
machine foundations,
weak earthquakes
medium
Yes
Yes
Strong earthquake
large
No
No
(Gmin, Dmax)
Strong earthquake
Elastic - plastic non-linear
tv<< 0,5÷2%
Plastic
slide
No
Seismic
waves;
(Gmax, Dmin = 0) Transportation,. . .
Factors affecting the cyclic deformation
Hardlin and Drnevich [35] has divided the influencing factors into 3
groups: very important factors: effective stress, void ratio, the degree of
deformation and saturation; less important factors: overconsolidation ratio; and
relatively unimportant: soil structure, frequency, ...
2.4. The theoretical basis of soil cyclic strength
2.4.1. The research methodology of soil cyclic strength
The research methodology of cyclic strength by experiment: according to
this method, the cyclic strength variation is expressed by a curve of the
relationship between the cyclic resistance ratio with the time loading to reach a
state of collapse (td), known as a boundary of the cyclic resistance ratio. This
boundary is determined by experiment.
The research methodology of cyclic strength by Geniev theory: Geniev
using Kelvin - Voigt adjustment model (when the stress exceeds the elastic
threshold, the soil deformation transferred to plastic deformation) to simulate
the soil behavior under the effect of dynamic loads in short time. From which,
the expression describing the variation of cyclic strength was built:
otd
2arc cot d 1
d 1
f(d
8
Where, o is the coefficient depends on the soil; is the coefficient
depends on stress conditions; d is the ratio of cyclic strength with permanent
strength.
The expression (2:39) is the theoretical basis for the study of soil dynamic
strength and help for the interpretation and orientation of empirical research.
However, the application of this theory in practice is still limited due to its
complexity.
Research methodology combining theory and experiment: to take
advantage of the strengths and overcome the limitations of the two methods
above, the thesis proposed a method based on Geniev theory combined with
empirical research: the expression (2.39) is transformed in the direction of
simplification and used popular concepts by inserting the coefficients a and b,
then the expression (2.39) becomes:
td = b.
arc cot
CSRgh
a
CSRgh
a
1
= f(CSRgh)
(2.43)
1
Where: a = tan(gh), with gh is a shear angle and known as coefficient of shear
angle;
b = 2.
1 -
o
(s), known as a coefficient of cyclic collapse time.
Equation (2:43) describes the boundary of dynamic resistance ratio of the
soil. This equation is completely determined if known the coefficients a and b.
These coefficients are determined by experiment.
2.4.2. Characteristics of cyclic collapsed point
Cyclic collapsed point is a point on the boundary of cyclic resistance
ratio, where there is the value of maximum stress (d) and the time duration of
this stress (td) in certain stress conditions of applications. In the cyclic strength
testing, this point is determined based on the analysis of variation of pore
pressure ratio (Ru) for saturated sandy soils and the relationship of stress - strain
over time (load cycles) for clayed soils.
2.4.3. Factors affecting cyclic strength
There are many factors affect the cyclic strength such as: effective
compressive stress; structure strength; drainage conditions; characteristics of
grain; mineral composition; stress conditions; methodology of shearing; shear
stress amplitude; frequency and duration of time action.
2.5. The method of determining the dynamical properties of the soil
The laboratory tests include cyclic simple shear tests, cyclic triaxial tests;
cyclic torsional shear tests, resonant column tests. The field tests include
seismic refraction test, seismic cross-hole test, spectral analysis of surface
waves, seismic cone penetration test. In addition, there are also indirect
methodologies based on empirical relationships.
9
Chapter 3. CHARACTERISTICS OF ENGINEERING GEOLOGY OF
QUATERNARY SEDIMENTS IN HANOI AREA AND RESEARCH
METHODOLOGY OF THEIR DYNAMICAL PROPERTIES
3.1. Characteristics of stratigraphy and groundwater in Hanoi area
3.1.1. Summary of Quaternary sediments in research area
The structure of Quaternary sediments in this area are present of
formations in order from the bottom up is Le Chi, Hanoi, Vinh Phuc, Hai Hung
and Thai Binh:
- Le Chi formation includes alluvial deposits, that not exposed on the
surface but appear only at a depth of 45 - 69,5m. Its components consists of
gravel, moving to the top of sand, silt and clay;
- Hanoi formation has distributed from 35,5m to 69,5m with components
mostly pebbles, gravel, grit, sand and silt;
- Vinh Phuc formation reveal a small area in Co Nhue, Xuan Dinh, is
composed of gravel, sand below moving to the is silt, clay. The thickness varied
sharply.
- Hai Hung formation includes lake - swampy deposits (lbQ 21-2hh1). Its
components is silty clay, containing organic matter; marine deposits (mQ212
hh2) is composed of clay, silty clay with blue grey, blue in colour.
- Thai Binh formation has formations inside (Q23tb1) and outside (Q23tb2)
the dike. The lower extra-formation consists of: sand, clayer silt with greybrown, yellow-grey in colour, few places is mixed with grey clay. The upper
extra-formation consists of: sand, clay and clayer silt with yellowish grey in
colour.
3.1.2. Engineering Geological characteristics of Quaternary sediments in the
study area
Based on the analysis of documents on Quaternary geology and
engineering geology, sedimentary components of Hanoi and Le Chi formation
are mostly gravel and its distribution is in great depth, so studying their
dynamic properties is less meaningful. Meanwhile, sediments formations of
Vinh Phuc, Hai Hung and Thai Binh distributed at a depth close to the surface
and have sensitive component with the effect of dynamic loads. So that, the soil
of this sediments is the object of study and divided in detail to 7 types of soil:
1. Alluvial deposits (aQ23tb1): stiff to very stiff clay - sandy clay with
greyish brown to yellowish brown in colour (layer 1). The average depth of the
top layer is around 3.0 m;
2. Alluvial - lake - bog deposits (albQ23tb1): soft clay - sandy clay with
greyish brown, darkish grey in colour, mixed organic matters (layer 2). The
depth distribution of the top layer is about 15m, the deepest is 28m.
3. Alluvial deposits (aQ23tb1): medium dense, fine sand with blackish grey
– brownish grey in colour (layer 3). The depth distribution of the top layer is
about 10-20m, the deepest is 34m.
10
4. Marine deposits (mQ21-2hh2): firm to stiff, bluish grey clay (layer 4). The
thickness of the layer is small and scattered.
5. Lake - swampy deposits (lbQ21-2hh1): very soft to soft clay – sandy clay
with blackish grey in colour, mixed organic matter (layer 5). Depth distribution
is from a few meters to over 20m.
6. Alluvial deposits (aQ13vp2): stiff to very stiff clay - sandy clay with
spotted yellowish brown – redish brown in colour (layer 6). The depth and
thickness of the layer varies sharply from a few meters to tens of meters.
7. Alluvial deposits (aQ13vp1): medium dense to dense, fine - medium sand
with yellowish grey (layer 7).
3.1.3. Groundwater characteristics: The study area has three aquifers: qh, qp2
and qp1. In which, the water level of qh in the areas where not affected by
mining is usually a few meters below the ground.
3.2. Methodology, contents, quantity of the research and experimental
procedures
3.2.1. The basis of the research methodology selection
Table 3.4. The dynamic deformation phases, computational models and
appropriate methods
Phases
Typical
Assumptions and
parameters computational models
Elastic
Gmax
(D =0)
Elastic deformation
ground
Assuming
elastic (linear)
Gd, D
Linear deformation
ground
Elastic - plastic
(non-linear)
Gd, D
Non -linear deformation
ground
Plastics
(sliding)
a, b
Sliding
Appropriate methods
The methods of wave
propagation test in the field,
cyclic torsional shear tests
Cyclic simple shear tests,
cyclic triaxial tests; cyclic
torsional shear tests,
resonant column tests
Cyclic simple shear tests,
cyclic triaxial tests
It is necessary to use a variety of methods (Table 3.4) to determine the
adequate dynamical characteristics at different stages of soil deformation.
However, the method is selected based on the objective of the thesis and
available equipment is as follows:
- At elastic phase, elastic modulus Gmax is determined based on the SPT
results and the void ratio by the empirical formula (Section 2.5.3);
- The typical parameters for phases of assuming elastic and elastic plastic were determined by cyclic triaxial test;
- At plastic phase (sliding), the soil is considered to have collapsed and
should identify the parameters of cyclic strength. These parameters are defined
by cyclic triaxial test.
11
3.2.2. The content and quantity of research
To ensure objective research, sampling locations were determined in
accordance with common distribution area of study subjects. The quantity and
contents of specific research are summarized in Table 3.5 and 3.6.
Table 3.5. Summary of the content and quantity study of soil deformation by
cyclic triaxial test
Experimental purposes
1. Determining the dynamic
deformation properties in
different phase for each soil.
2. To study the effect of the
pressure chamber
3. To study the effect of
frequency
Content Experiment
Quantity
Each soil was tested in the same
66 samples in
frequency and pressure chamber
all types of
under the different amplitude of
specific soil
cyclic stress
The frequency and amplitude of
Tested 4
the load is held constant, changing samples Svp
only the pressure chamber (3 = 0; and 6 samples
Shh
25; 50; 75; . . . kPa)
The amplitude of the load and the
Tested 7
pressure chamber is kept constant, samples S hh
only change the frequency (f = 0,5; and 5 samples
1; 2; 3; 5; . . . Hz)
Ytb
88
Total
Table 3.6. Summary of the quantity study of cyclic strength
by cyclic triaxial test
Soil type
Stiff, yellowish grey sandy Clay
(Layer 1-Stb2)
Soft, blackish grey sandy Clay
(Layer 2-Ytb)
Firm, bluish grey Clay (Layer 4-Shh)
Soft, blackish grey sandy Clay
(Layer 5-Yhh3)
Very stiff, reddish brown sandy
Clay (Layer 6-Svp)
Bluish grey fine Sand (Layer 3-Ctb)
Yellowish grey fine Sand
(Layer 7-Cvp1)
Yellowish grey medium Sand
(Layer 7 -Cvp2)
Study contents
Determining cyclic collapsed point
and the boundaries of cyclic
resistance ratio for cohesive soils
Quantity
7
4
7
7
7
9
Determining liquefied point and the
boundaries of liquefied resistance
ratio for sands
5
1
12
3.2.3. The experimental procedure for determination of the dynamical
properties of soils using the Cyclic Triaxial Apparatus
Testing equipment is Tritech 100 made by Controls - Group (Italy). The
experimental procedure for determination of the dynamical properties is done in
accordance with ASTM - D3999 and ASTM - D5311.
Stress conditions and loading parameters are determined accordance with
the actual conditions of the ground and the local conditions. Accordingly,
loading frequency was selected in the range of f = 0.5 ÷ 10 Hz and focusing on
the range 1 ÷ 5Hz; cyclic stress ratio CSR = 0.06 ÷ 0.40.
3.3. The results of soil dynamical properties determination by empirical
formulas
Summary of calculated results is represented in Table 3:14.
Table 3.14. The results determining the elastic modulus Gmax for each soil
Vertical
According to the results of SPT
effective
Soil
stress,
CSRgh
types
(Vs)
(Gmax)
(’v) N30 N1(60)
Layer 1
Layer 2
Layer 3
Layer 4
Layer 5
Layer 6
Layer 7
kPa
70
94
110
94
126
150
230
Blows
6
7,02
4
4,04
16 14,94
6
6,06
3
2,62
11
8,79
27 17,43
m/s
214,5
192,2
176,1
214,5
177,8
252,8
181,8
kPa
87890
62793
55814
85129
52147
127824
61118
0,16
0,19
According to
laboratory
experiments
Void
(Gmax)
ratio (eo)
kPa
0,758
76845
1,283
39884
0,900
72155
1,512
31347
0,689
124503
-
Chapter 4. RESEARCH ON CYCLIC DEFORMATION OF SOILS BY
CYCLIC TRIAXIAL TEST
4.1. Characteristics of cyclic deformation in different phases and specific
graphs
The soil deformation characteristic is reflected by strain graphs, stress strain loops, correlated curves of stress – strain and the increase of pore
pressure. Therefore, it is necessary to analyze these graphs to study dynamic
deformation at different phases.
- According to the test results, there are three types of strain graphs,
depending on the experimental conditions: Type 1, strain amplitude and
maximum strain values are stable; Type 2, constant strain amplitude but
maximum strain values increase by cycles and exceed 0.5%; Type 3, the strain
amplitude and strain values increase over time in excess of 0.5% to a few
percent.
13
- Stress – strain loop also has three forms: form 1, loop is balanced and
the deviation between the loops is very small; form 2, the loop is not balanced,
the deviation between the loops is small; form 3, the loop completely
unbalanced, the deviation between the loops is large.
- Correlated curve of stress – strain is based on test results of a soil type
with different stress amplitudes. Based on the analysis of this curve and the
experimental chart, it is found that: in the linear phase, strain graph and loop are
in the form of 1; in the non-linear phase, strain graph and loop are in the form
of 2 to 3, Ed and D change simultaneously by experimental cycle, that expressed
in separation of the stress – strain curves.
The variation of excess pore pressure in the deformation phases
According to studies by Ishihara [44], Vučetić and Dobry [75]: pore water
pressure does not increase in the phase of very small strain (elastic phase) and is
not increasing remarkably in the phase of small strain (assuming elastic); when
strain is over the threshold of small strain, pore water pressure started to
increase and reached its highest value in sliding phase. The strain threshold, at
which pore water pressure begins to rise, is called volumetric strain threshold
(tv): tv = (3 ÷ 7).10-2% for saturated clay and tv = (1 ÷ 1.2).10-2% for saturated
sand.
4.2. Cyclic deformation characteristics of soils in research area
From the analysis of stress - strain curves and the typical graph, the stress
threshold and specific values of each phase are identified for each soil in study
area as table follows:
Summary from tables 4.1; 4.3; 4.5; 4.7; 4.9; 4.11; 4.12 (The specific
parameters for each phase of deformation)
The stress
Experimental threshold
Soils Phase
conditions
gh
CSR
(kPa)
Saturation
10.0 0.13
Layer Linear
Nature
13.0 0.19
1
32.0 0.41
Non- Saturation
(Stb)
linear
Nature
27.0 0.40
9.0
0.18
Layer Linear Saturation
2
Phi
Saturation
21.0 0.42
(Ytb) tuyến
15.0 0.22
Layer Linear Saturation
3
NonSaturation
(Ctb) linear
Nature
15.0 0.14
Layer Linear
4
NonNature
27.0 0.25
(Shh) linear
Layer Linear
Nature
9.0
0.13
The strain
threshold
Gd
D
fo
a
kPa
-
Hz
0.018
0.080
0.500
1.000
0.025
amax
0.040 15233 0.112 165
0.130 8222 0.181 120
2.400 5195 0.194 96
6.000 2257 0.223 63
0.030 6799 0.092 109
0.420 1.000
2769
0.182
70
0.030 0.050 18325 0.089 169
-
-
12545 0.128 140
0.030 0.035
8816
0.112 127
0.620 0.880
2429
0.176
0.036 0.055
6943
0.115 110
66
14
5
(Yhh)
Layer
6
(Svp)
Layer
7
(Cvp)
Nonlinear
Linear
Nonlinear
Linear
Nonlinear
Nature
23.0
0.46 0.980 4.070
1787
0.200
Nature
Nature
42.0
0.22 0.025 0.040 43736 0.101 265
-
-
-
-
13177 0.141 146
Saturation
-
-
-
-
26415 0.114 201
Saturation
-
-
-
-
13701
0.12
61
145
4.3. Variable characteristics of pore pressure in research soils under the
effect of dynamic loads
- In an experiment and the deformation of linear phase, pore water
pressure (u) is not increasing remarkably (from 0.1 to 1 kPa) and fluctuating
stably by loading cycles with very small amplitude (0.1 to 0.5 kPa). When
cyclic strain exceeds the linear threshold, the initial u increases about 1-10 kPa
(depending on soil type and magnitude of the load), and oscillates with
amplitude of 1-5 kPa. Then, u tends to change incrementally.
- When testing samples of a soil in the same initial stress conditions and
different stress amplitude, u was increasing in line with strain. The increment of
u is assessed through the ratio of pore pressure (Ru). This ratio depends on
factors such as strain phase, experimental conditions and soil type, can observe:
Ru of clayish soils is usually less than 1% in the linear phase and increases to a
few percent in the non-linear phase; with sandy soils, Ru = (1 ÷ 2)% in the
linear phase and increases to over 10% in non-linear phase.
The study results also showed that linear strain threshold (agh equal to
the volumetric strain threshold tv.
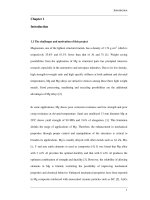
4.4. Some variable laws of the deformation characteristics and factors
affecting
The variable laws of deformation characteristics with cyclic strain are
represented in figures 4.19 and 4.20.
D
0.25
0.2
0.15
0.1
Stb1S7
Stb2S8
S10
Shh
Y3
Yhh3
0.05
Đường giới hạn
0
0.001
a (%)
0.010
0.100
1.000
10.000
Figure 4.19. Variation of damping ratio D with axial strain
15
Ed (kPa)
60000
Stb1S7
Stb2S8
ShhS10
Y3
Yhh3
50000
Đường giới hạn
40000
30000
20000
10000
0
0.001
a (%)
0.010
0.100
1.000
10.000
Figure 4.20. Variation of modulus Ed with axial strain
Construction correlation results have identified the best relationship:
- The relation between Ed and a is exponential:
+ For sandy Clay (soft to stiff):
Ed = 3,13 a-0,56
(4.1)
+ For firm to stiff sandy Clay:
Ed = 3,1 a-0,57
(4.2)
-0,63
+ For soft soils: Ed = 2,01 a
(4.3)
- The relation between D (%) and a is exponential with base of natural
+ For sandy Clay (soft to stiff):
D = 20 - 11EXP(-12a)
(4.4)
+ For firm to stiff sandy Clay :
D = 19,5 - 8EXP(-5a)
(4.5)
+ For soft soils: D = 21 - 12EXP(-5a)
(4.6)
These relations are very tight.
The influence of the pressure chamber: the results of the two soil types
Svp and Shh show: the variation of D with the pressure chamber is not clear,
because D depends primarily on strain; modulus Ed increases with the pressure
chamber and depends on the soil type, saturation. Ed of Vinh Phuc formation
clay (Svp) has increased greater than Hai Hung formation clay (Shh).
The influence of the frequency: Soil private frequency changes between
50Hz 250Hz, so with the loading frequency ≤ 10Hz the amplification function
V(, D) ≈ 1 and the influence of the frequency to deformation characteristics is
negligible. Experimental results of two soils (Ytb, Shh) in the frequency of 0.5
10Hz also proved that.
4.5. Interpretations and discussions of research results
Assessment the determination results of cyclic modulus and comparison
to static modulus:
Soil cyclic modulus of elastic phase is Gmax (or Emax) and is determined by
empirical formula (based on SPT and eo). The modulus of linear phase (Gd-tt and
16
Ed-tt) and nonlinear phase (Gd-pt and Ed-pt) were determined by cyclic triaxial test.
The characteristic of static deformation is a total deformation modulus (Eo) (is
determined by compression tests for clayey clay and SPT for sands).
Correlations between the modules are given in Table 4.18.
Table 4.18. Correlations between the modules
Soil types
Soft soil
(Layer 2, 5)
Firm clay
(Layer 4):
Stiff sandy clay
(Layer 1)
Very stiff sandy
clay (Layer 6)
Sands
(Layer 3, 7):
In comparison to Gmax
Linear phase
Nonlinear phase
In comparison to
Eo
Gd-tt=(0,17÷0,22)Gmax Gd-pt=(0,06÷0,07)Gmax Ed-tt=(5,6 ÷ 8,1) Eo
Gd-tt = 0,12Gmax
Gd-pt = 0,03Gmax
Ed-tt = 2,5Eo
Gd-tt = 0,10 Gmax
Gd-pt = 0,03Gmax
Ed-tt = 2,1Eo
Gd-tt = 0,35Gmax
Gd-pt = 0,10Gmax
Ed-tt = 2,2Eo
Gd-tt=(0,33÷0,43)Gmax Gd-pt = 0,22Gmax
Ed-tt=(3,9 ÷ 4,6)Eo
The relationship between Eo and Emax is proportional. Very stiff sandy soil
of Vinh Phuc formation (Svp) has the greatest Emax. The next turn is (Cvp) > (Ctb)
> (Stb) > (Shh) > (Ytb) > (Yhh). The modulus of soils in linear phase (Gd-tt or Ed-tt)
is decreasing order: (Svp) > (Cvp) > (Ctb) > (Shh) > (Stb) > (Ytb) ≈ (Yhh).
Interpretation of the research results:
- Dynamic load is temporary and changes over time, so that pore water
does not have enough time to escape, and the process of compaction could not
complete leads to dynamic deformation is small (large deformation module). In
compaction phase, the soil is compacting with static deformation. Covertly,
dynamic deformation increases leading to Ed decreased.
- Stiff sandy clay belong to Thai Binh formation in natural state (Stb2) has
low saturated degree, so that its capability of volumetric immediate reduction is
greater than completely saturated soil (Stb1), that why Ed of (Stb2) <(Stb1). The
soils Yhh3, Ytb have the same saturation degree and consistence so they have Ed
almost equal value. However, Eo of (Yhh3) < (Ytb) is due to organic content of
Yhh3 greater than Ytb.
- Gmax is determined by the empirical formula, so that accuracy result is
not high. In addition, the results of cyclic triaxial test affected by sample
disturbance and saturation so the ratio Gd /Gmax lower than theoretical ratio.
Analysis of cyclic deformation characteristics in different phases:
The cyclic deformation of research soils was analyzed based on phases by
graphs: strain graph, loops shape, stress – strain curves and Ru. The
characteristics of cyclic deformation in each phase as follows:
- Elastic phase: in theory, stress – strain loops are a straight line, the
damping ratio D is zero; elastic strain threshold is 10-6 or 10-4%;
17
- Assuming elastic phase (linear): graphs of strain and loop are the form
1. Strain amplitudes threshold (a)gh varies from 0.018% to 0.030% for clayey
soils, from 0.025% to 0.040% for soft soil, and equal 0.030% for sands,
common is (a)gh = (0.020 0.030)%; pore pressure ratio Ru is very small, Ru <
(1 2)%. In this phase, residual deformation in most of soils is very small.
- Nonlinear phase: graphs of strain and loop are form 2 and 3. Strain
amplitudes threshold (a)gh at this phase varies from 0.4% to 1%, depending on
the saturation of the soil. The strain of lower saturated soil is larger the strain of
saturated soil (values (a)gh = 1% for Stb2> 0.5% for Stb1). The ratio Ru begins to
rise to a few percent for clayey soils and Ru > 10% for sandy soil. In this phase,
residual deformation is large; the lower saturation is the greater residual
deformation.
- Sliding phase of (large deformation): graphs of strain and loop are form
3; the slope of stress - strain curve is very high; Specimen strain rises
continuously to a few percent and make specimen collapsed. Therefore, it is
necessary to study cyclic strength in this phase.
Analysis of the variation of damping ratio D in different phases:
Theoretically, D = 0 in elastic phase and D = 0.637 at the stage of plastic
deformation. In assuming elastic phase and elastic – plastic phase, D increasing
in line with cyclic strain. The study results showed:
- In linear phase, damping ratio D is common in the range (0.089 ÷ 0.115)
for all research soils;
- Nonlinear phase: damping ratio D is in the range (0.141 ÷ 0.223) for
clayey soils and lower by (0.120 ÷ 0.128) for sands. Overall, D depends mainly
on cyclic strain. The greater ability of soil instantaneous compaction (depends
on the void ratio, saturation and composition) is the larger D: the void ratio of
soils Cvp, Ctb, Svp is low then D is small; the ratio D of Yhh3 is high (D = 0.200),
due to the organic matter content of this soil is greater than other soils.
The significance of research results: The results identify the parameters
characterizing dynamic deformation for assuming elastic phase allow solve the
model of soil behavior with dynamic loads under the assumption "equivalent
linear deformation ". The input parameters (Ed, D) are a constant corresponding
to the degree of deformation.
Construction results of relationship between Ed and D with dynamic
deformation (equations from 4.1 to 4.6) allow solve the model of soil behavior
on the assumption of nonlinear deformation (input parameters are functions).
Meanwhile, the research results will be more accurate.
18
Chapter 5. RESEARCH ON SOIL CYCLIC STRENGTH BY CYCLIC
TRIAXIAL TEST
5.1. The study results of clayey soil strength
The soil samples were tested with different amplitude of cyclic loads.
From the experimental results, building up graphs of stress, strain and the ratio
of pore water pressure versus number of cycles (or time). Based on these
graphs, the stress - strain curves by cycles were built and then determined the
stress amplitude, as well as the cyclic stress ratio at the strain threshold of 0,
5%; 1%; 2% and 5%. From these results, building the boundary of cyclic
resistance ratio and empirical coefficients (a and b) corresponding to the
different strain threshold for each soil. After analyzing experimental data,
determining the initial collapsed strain is a = 2%, collapsed strain a = 5%.
Determination results of empirical coefficients describing the boundary of
cyclic resistance ratio for soils are as follows:
* Yellowish grey, stiff sandy clay – Thai Binh formation (Stb2)
- Initial collapsed threshold (2%): a = 0,231; b= 3,8 (s)
- Collapsed threshold (5%): a = 0,258; b= 10,5 (s)
* Blackish grey, soft sandy clay – Thai Binh formation (Ytb)
- Initial collapsed threshold (2%): a = 0,194; b= 1,4 (s)
- Collapsed threshold (5%): a = 0,249; b= 1,9 (s)
* Bluish grey, firm clay – Hai Hung formation (Shh)
- Initial collapsed threshold (2%): a = 0,243; b= 1,6 (s)
* Blackish grey, soft sandy clay – Hai Hung formation (Yhh)
- Initial collapsed threshold (2%): a = 0,167; b= 1,5 (s)
- Collapsed threshold (5%): a = 0,212; b= 2,0 (s)
* Reddish brown, very stiff sandy clay – Vinh Phuc formation (Svp)
- At strain threshold 0,5%: a = 0,636; b= 5 (s); (Tested with stress
amplitude is greater than 1.5 times the dynamic stress due to the biggest
earthquake in the area, the soil specimen has not been collapsed and the largest
strain is 0,704 %).
The significance of the empirical coefficients a and b:
the coefficient a equal to the minimum CSR (cyclic stress ratio) that can
cause cyclic collapse (reaching the threshold of collapsed strain as time
progresses to infinity); the coefficient b is inversely proportional to the chamber
pressure (coefficient ) and proportional to the viscous resistance of the soil
(inversely proportional to o). When td = b, then CSR = 1,74a. Thus, b is
considered to the period of time necessary to cyclic deformation reaching the
collapsed deformation in stress ratio CSR = 1,74a.
19
5.2. Research results on the possibility of sand liquefaction
There are a variety of sands belong to different formations in study area.
In particular, fine sand of Thai Binh (Ctb) and Vinh Phuc (Cvp1) formations has
an wide distribution and sensitive to the effects of dynamic loads. These sands
are likely to be liquefied under the effects of dynamic loads. Therefore, the
content of this section focused on the liquefied possibility of two sands.
Saturated sand is liquefied when Ru = 100% and there are dramatically
change appearances of stresses and strains.
Sand specimens were prepared by dry vibration method in a membranelined split mold attached to the bottom platen of the triaxial cell. Then,
specimens were saturated by back pressure and consolidated by the chamber
pressure. The specimens were tested with different amplitude of cyclic loads.
Based on experimental results, building the graphs of stress, strain and the pore
pressure ratio versus cycles. The liquefied point is determined based on the
analysis of these graphs.
5.2.1. Research results of soil liquefaction for fine sand of Thai Binh
formation (Ctb)
Sand specimens were tested at the density Dr = 0.53 ± 0.2 (medium
dense). Experimental results showed that the specimens be liquefied at a
relatively strain = (5 ÷ 8)% and the strain amplitude = (1.5 ÷ 3)%. The
empirical coefficients of the liquefied boundary for Ctb is; a = 0.315; b = 10s.
5.2.2. Research results of soil liquefaction for sands of Vinh Phuc formation
(Cvp)
Fine sand (Cvp1): The density of specimens were prepared in two
categories: 3 specimens Cvp1-1, Cvp1-3, Cvp1-5 in loose density (Dr = 0.26 ± 0.1)
and 2 specimens Cvp1-2, Cvp1-4 in medium dense (Dr = 0.35). The results
showed that: at the time of liquefaction, relatively strain = (4 ÷ 6)% and the
strain amplitude = (3 ÷ 4)%. The empirical coefficients of the liquefied
boundary for Cvp1: a = 0.185, b = 3,5s for loose density and a = 0.221; b = 5s for
medium dense (Dr = 0.35).
Medium grained sand (Cvp2): Specimen was tested in a simulated stress
conditions for the actual conditions. The density of the specimen is Dr = 0.802.
Experimental results showed that the greatest ratio of pore pressure (Rumax)
reached 95% at cycle of 340. The strain of the specimen is extension strain (a
<0) due to pore water pressure makes dense sands expanded anda = -5% at the
time of the Rumax. Thus, medium grained dense sand (Dr = 0.802) of the Vinh
Phuc formation was not liquefied.
5.3. Interpretations and discussions of research results
5.3.1. Some variation laws of the dynamic strength coefficient for clayey soil
The research results of dynamic strength showed that: “a” increases with
collapsed strain threshold but is not increasing remarkably from initial
20
collapsed strain threshold to extreme collapsed strain threshold. At the same
strain threshold, greater soil strength have greater “a” and conversely: a (Svp)> a
(Stb)> a (Shh)> a (Y). Because the “a” is essentially a function of shear angle, so
“a” dependent primarily on soil internal friction angle: (Svp) = 21o > (Stb) =
14o20’ > (Shh)= 10o02’ > (Y) = (8 ÷ 9)o. The coefficient a does not depend
directly on the initial stress conditions. Coefficients b reflects the ability of
viscous resistance of the soil and expressed in the latency of strain, so b
increases with strain threshold. At the same strain threshold, the soil with
greater strength has greater b and opposite (creep resistant of stiff soil is better
than soft soil): b (Svp) > b (Stb) > b (Shh) > b (Y). This rule is explained as
follows:
+ The soil has higher cohesion, synonymous with higher viscous
resistance and b is higher, too;
+ The void ratio of soils: eo (Svp) = 0.661 < eo (Stb) = 0.776 < eo (Shh) =
0.945 < eo (Y) = (1,270 ÷ 1,456). If void ratio of soil is high, then immediately
strain is large and cyclic strain reaches strain threshold faster (b is smaller);
Coefficients b is inversely related to chamber pressure.
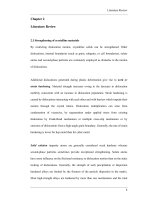
5.3.2. Variations of empirical coefficient of sand liquefaction by density
The meaning and change rules of the coefficients a and b are the same as
the clayey soil. If two sands Ctb and Cvp are considered similar in composition
particles (fine sand) and ignore the formation, it can determine the change rules
of a, b by the density (Dr) as shown in Figure 5.29. Accordingly, a and b
increase by density. The directly proportional relations between a and b with Dr
are almost straight line. Based on the graph in Figure 5.29, the coefficients a
and b can be determined easily for fine sand in the different density (in the
range of Dr = 0.26 ÷ 0.53).
12
b (s)
a 0.35
Hệ số b
Hệ số a
10
0.30
0.25
8
0.20
6
0.15
4
0.10
2
0.05
0
0.2
0.25
0.3
0.35
0.4
Độ chặt Dr
0.45
0.5
0.00
0.55
Hình 5.29. Biến đổi các hệ số a, b theo Dr
5.3.3. Characteristics of cyclic collapsed sand in the different density
According to the test results of fine sands (Ctb, Cvp1) and medium-grained
sand (Cvp2) in different density (loose, medium dense and dense), the
characteristics of cyclic collapsed sands in the different density are as follows:
21
- Loose fine sand (Dr = 0.26): initially, Ru increases slowly and the
amplitude of stress and strain did not change significantly. when Ru increased
by 60%, the stress amplitude began declining and strain amplitude began
increasing quickly. At the time of Ru =100%, strain amplitude reach the
maximum value by (3 ÷ 4)%. The modulus Ed has increased in the first few
cycles due to sand is compacted, then pore water pressure increased as Ed
decreased quickly to zero when Ru = 100%. Thus, loose fine sand is completely
liquefied when Ru = 100%;
- Medium dense fine sand (Dr = 0,53 ± 0,2): experimental results showed
that the increase of Ru and strain amplitude, and the attenuation of stress
amplitude occurred as soon as loading; At the time of Ru =100%, strain
amplitude reach the maximum value by (1.5 ÷ 3)%. At this density, modulus Ed
reduced as soon as loading and down to a minimum value of approximately
100kPa when Ru = 100%. Thus, this sand is considered to be liquefied when Ru
= 100% (this time, the soil is equivalent only as mud). Liquefied state of the
specimens retained after the test ending;
- Dense fine sand (Ctb-4, Dr = 0,70) and dense medium-grained sand
(Cvp2, Dr =0,802) were not collapsed in the form of liquefaction. In particular,
cyclic strain of Cvp2 is extension strain.
5.3.4. Practical significance of research results in the stable calculation of the
ground under the effect of the dynamic loads
Practical significance of dynamical resistance boundary (or liquefaction
boundary) is especially important in the stable evaluation of ground under the
effect of the dynamic loads. Stability conditional of a point in the ground under
the effect of dynamic stresses are evaluated based on this curve. Accordingly,
points are considered unstable (or liquefaction) if CSR> CSRgh, meaning the
point of stress state is above the dynamic resistance curve. Using the research
results, the thesis has forecasted on the risk of losing stability of typical soils in
the Hanoi area under the effect of earthquake based on the most unfavorable
conditions (5.18).
Calculation results in Table 5.18 shows:
- At what point in the ground with only strata stress, the earthquake
caused only CSR = (0.06 ÷ 0.07). In about this CSR and smaller, deformation
of all soils in the study area is the elastic and linear deformation (small
deformation);
- In the given conditions (with building load), the fine sand in density Dr
≤ 0,35 (layer 3 – Thai Binh formation and layer 7 - Vinh Phuc formation) were
liquefied. Whereas the clayey soils and fine sand with Dr = 0.53 remained
stable.
22
Table 5:18. Calculation results and stable evaluation of the soils around the pile
when earthquake has agr = 0.1097
Shear stress
Dynamic resistance
CSR
(kPa)
ratio (CSRgh)
Soil Depth
EvaluaInitial
Extreme
layer (m) Static Dynamic
tion
Dynamic Total threshold
theshold
d
CSRgh1
CSRgh2
1
3
4
4
0.07
0.14
0,28
0,46
stable
2
10
8
7
0.06
0.13
0,21
0,27
stable
0,56 (Dr=0,53) stable
Lique0,28 (Dr=0,35)
3
10
34
7
0.06
0.36
fied
Lique0,22 (Dr=0,26)
fied
4
5
10
5
0.07
0.20
0,25
stable
5
5
6
5
0.07
0.15
0,17
0,23
stable
6
3
35
4
0.07
0.70
0,8
stable
0,56 (Dr=0,53) stable
Lique0,28 (Dr=0,35)
7
12
34
8
0.06
0.32
fied
Lique0,22 (Dr=0,26)
fied
- The stable evaluation results in Table 5.18 is appreciation for stability at
a depth and in the given conditions. When the input conditions change, stable
evaluation results will be different, for example:
fine sand with Dr = 0,53 will be liquefied if its depth is 5m (CSR = 0,56 =
CSRgh); at a depth of 15m, fine sand with Dr = 0,35 is not liquefied (CSR = 0,27
<CSRgh); and at the same depth of 10m, fine sand with Dr > 0,42 have CSRgh>
CSR = 0,36 then it will not be liquefied. In fact, the piles are often designed
through many different soil layers and at different depths, so the assessment of
the overall stability of the pile is only done with the behavior model of groundpile system.
23
CONCLUSIONS AND RECOMMENDATIONS
Conclusions
1) Cyclic deformation of the research soils were divided into four phases:
elastic, assuming elastic (linear), elastic - plastic (non-linear) and plastic
(slide). Of these, the first three phases were studied under deformation
problem. The research results of theory and experiment showed:
- Elastic phase: dynamic deformation is smaller than 10-4%; dynamic
modulus is at the greatest value (Gmax); stress - strain loops are as a line and,
damping ratio D is zero;
- Assuming elastic phase (linear): graphs of strain and loop are the form 1;
strain amplitudes threshold (a)gh varies from 0.018% to 0.030% for clayey
soils, from 0.025% to 0.040% for soft soil, and equal 0.030% for sands,
common is (a)gh = (0.020 0.030)%; damping ratio D of soils varies
between 0.089 ÷ 0.115;
- Elastic - plastic phase: graphs of strain and loop are form 2 and 3. Strain
amplitudes threshold (a)gh at this phase varies from 0.4% to 1%; damping
ratio D varies between 0,141 ÷ 0,223 for clayey soils and D = 0,120 ÷ 0,128
for sands;
2) The correlations between specific modules for soils are as follows: Gd-tt =
(0,17 ÷ 0,22)Gmax, Gd-pt = (0,06 ÷ 0,07)Gmax, and Ed-tt = 5,6 ÷ 8,1 Eo for soft
soils (Thai Bình and Hai Hung formation); Gd-tt = 0,10 Gmax; Gd-pt = 0,03Gmax;
and Ed-tt = 2,1Eo for stiff sandy clay of Thai Binh formation; Gd-tt = 0,12Gmax,
Gd-pt = 0,03Gmax, and Ed-tt = 2,5Eo for firm clay of Hai Hung formation; Gd-tt =
0,35Gmax; Gd-pt = 0,10Gmax, Ed-tt = 2,2Eo for very stiff sandy clay of Vinh Phuc
formation; Gd-tt = (0,33 ÷ 0,43)Gmax, Gd-pt = 0,22Gmax, and Ed-tt = (3,9 ÷ 4,6)Eo
for fine sand of Vinh Phuc formation; At the same level of deformation, the
modulus of soil Svp > Stb > Shh > Ytb > Yhh;
3) Deformation characteristics of research soils vary by strain with a clear law:
at the strain amplitude threshold of 0.01%, clay – sandy clay soil has Ed-tt(0,01)
= 40±10 Mpa (the lower is soft soil and the upper is stiff soil), D(0,01) = 0,1 ±
0,02; at the strain amplitude threshold of linear (a ≈ 0,03%), Ed-tt(0,03) =
0,62Ed-tt(0,01); D(0,03) = 1,45D(0,01); at the strain amplitude threshold of sliding,
Ed-tr = 0,06Ed-tt(0,01); Dtr = 2D(0,01). These results allow solving the behavior
model of the ground under the assumption of equivalent linear deformation
(input parameters are constant). The variation law of soil deformation
characteristic is described by the correlation functions (3.3 to 3.8), and helps
solving behavior model of the ground under the assumption of nonlinear
deformation (input parameters are function).
4) Pore pressure ratio Ru of clayey soils is less than 1% in assuming elastic
phase and increase to few percent in elastic – plastic phase; with sandy soil,
Ru = (1-2)% in assuming elastic phase and increase to more than 10% in