ROLES OF AUXIN RESPONSE FACTOR TRANSCRIPTION FACTOR (GmARF) IN SOYBEAN AND STRIGOLACTONE IN ARABIDOPSIS IN RESPONSE TO DROUGHT AND SALT STRESSES
Bạn đang xem bản rút gọn của tài liệu. Xem và tải ngay bản đầy đủ của tài liệu tại đây (882.94 KB, 27 trang )
MINISTRY OF EDUCATION
MINISTRY OF AGRICULTURE
AND TRAINING
AND RURAL DEVELOPMENT
VIET NAM ACADEMY OF AGRICULTURAL SCIENCES
HA VAN CHIEN
ROLES OF AUXIN RESPONSE FACTOR
TRANSCRIPTION FACTOR (GmARF) IN SOYBEAN AND
STRIGOLACTONE IN ARABIDOPSIS IN RESPONSE
TO DROUGHT AND SALT STRESSES
Major: Biotecnology
Code: 62 42 02 01
SUMMARY OF THE DOCTORAL THESIS
HA NOI - 2016
The doctoral thesis was completed in:
VIETNAM ACADEMY OF AGRICULTURAL SCIENCE
Supervisors:
1. Assoc. Prof. Dr. Nguyen Van Dong
2. Dr. Tran Phan Lam Son
Reviewer 1:
Reviewer 2:
Reviewer 3:
The doctoral thesis is defended at Council for thesis assessment at
institutional level, held at: Vietnam Academy of Agricultural Science,
at
hours, day
month
year
The thesis can be referred to at:
1. Vietnam National Library
2. Library of Vietnam Academy of Agricultural Science
3. Library of Agriculture Genetics Institute
INTRODUCTION
1. Imperativeness of the thesis
The rapidly increasing of the world population has made food security one of the most
important global issues, including Vietnam. In addition, the food productivity as well as the
sustainable agriculture development is also burdened by climate change and environmental
stresses (such as drought, flooding, unpredictable epidemics, soil erosion and environment
pollutants...). Understanding the stress responses in plants is necessary to mitigate the problems
via creating stress-tolerant crop cultivars. It has been demontrated that transcription factors and
phytohormones (such as Abscisic acid (ABA), auxin, cytokinins (CK), strigolactones (SLs)) play
important roles in gene expression regulation and physiological activities in plant. Therefore, our
research is aimed to identify and characterize candidate genes, which can be used to engineer
stress-tolerant transgenic crops, through 2 approaches. First, we address our self to study gene
expression regulation mediating by transcription factors, namely auxin response factor
transcription factors family (ARF); second, we concentrate on discovery of candidate genes
involved in hormone metabolism and signaling in plant stress responses. To achieve this goal, in
this thesis, we conduct the experiments on model plant - Arabidopsis thaliana
and an
economically important crop – soybean (Glycine max) at the same time. The thesis entiled:
“Roles of auxin response factor transcription factor (GmARF) in soybean and strigolactone in
Arabidopsis in response to drought and salt stresses”.
2. Objectivities
- Identification and characterization of the potential auxin-response factor transcription
factor genes in soybean for generating drought tolerance crops via genetic engineering.
- Phenotyping and study the molecular mechanisms of strigolactone in response to drought
and salt stress conditions.
3. Contents
3.1. Roles of auxin response factor transcription factor in soybean in response to drought
stress
3.2. Roles of strigolactone in response to drought and salt stress in Arabidopsis
4. Scientific and practical significane
4.1. Scientific significance
Our study is the first publication that provides the scientific data about the function of ARF
TFs coding genes in soybean, as well as the essential role of SLs involved in environmental stress
responses, especially drought condition. Our results are considered as the reliable references for
education and research.
1 | Page
4.2. Practical significance
- This research allowed us to identify genetic components that contribute not only to
improve drought tolerance of soybean, but also for in-depth functional analysis that ultimately leads
to the development of soybean cultivars with improved tolerance to drought.
- This research also provided a promising approach to reduce the negative impact of abiotic
stresses on crop productivity based on the modulation of SL content/response.
5. The novelty of the thesis
- Characterization and functional analysis of GmARF genes under drought conditions.
- Our results classified some tissue-specific of GmARFs which are able to apply for genetic
engineering to develop the drought tolerant cultivars.
- Our results also provided the roles of strigolactones in response to drought and high
salinity in plant.
- Our results opened a promising application approach to enhance the drought/salt tolerance
by strigolactone.
6. Structure of the thesis
The main contents of the thesis are presented in 107 pages, including 28 figures and 8 tables.
185 literature references were used to cite for this thesis, including 9 in Vietnamese and 176 in
English and 8 webpages.
2 | Page
CHAPTER 1: OVERVIEW AND SCIENTIFIC BACKGROUND
1.1.
Introduction
Soybean is one the world’s leading economic oilseed crops, providing the largest source of
vegetable oil, proteins, macronutrients and minerals for human consumption and animal feed.
Unfortunately, the low productivity of soybean is mainly attributed to evironmental stresses, in
cluding drought. Plants, especially soybean, activate various mechanisms to adapt with drought
stress. In the last 20 years, many genes, including both regulatory and functional genes, have been
discovered in important crops, such as rice (Oryza sativa) and soybean (Glycine max), which are
involved in defense mechanisms and functioned in increasing drought tolerance. However, the
detail information and the relationship between the regulation of TFs and gene expression have not
been elucidated yet. Therefore, identification and characterization of TFs family in soybean is
necessary to understand plant stress responses.
On the other hand, high-salinity is also a typical stress that have influence to crop yield. To
elucidate plant responses mediated by the phytohormone – SLs signaling pathway to high-salinity
and drought stress conditions, we conduct the experiment on model plant – Arabidopsis thaliana.
Because Arabidopsis has many advantage characteristics (such as its short life-cycle, small size and
fully sequenced genome, easy to grow and transform, closely related to a major crop species). It has
been shown that SLs play a typical role in regulation of many physiological processes in plant.
However, the involvement of SLs in plant drought and high-salinity stress responses has not been
revealed yet. So that to identify and study the relationship between SLs and drought and highsalinity stress responses is essential to compliment to the biological knowledge as well as the
potential application in sustainable agriculture and cultivars improvement.
In short, to evaluate the good candidates for genetic engineering, in this study, we will focus on
the auxin response factor transcription factor family in soybean (GmARF) and the pivotal role of
SL in abiotic stress response in plant.
1.2.
The mechanisms of plant responses to environmental stresses
Plants are always exposed to environmental stresses, such as drought, salt, cold, light
or humidity, however, they are lack of movement ability, so that they have to respond and
adapt to stresses to survive. In response to environmental stresses, plants must activate
plenty of complexity pathways and mechanisms (Manavalan et al.,, 2009). In term of
phisiological, plants attempt to close the stomata, reduce respiration and photosynthesis
frequency, water volume in tissues and plant growth, induce the root development to
enhance the water-absorbance ability (Tran and Mochida, 2010). In term of molecular
mechanisms, there are many genes that encoded for the stress responsive protein (Dorothea
and Ramanjulu, 2005). Within the regulatory networks that control the signal transduction from
3 | Page
stress signal perception to stress-responsive gene expression, various transcription factors (TFs) and
their DNA binding sites, the so-called cis-acting elements, act as molecular switches for stressresponsive gene expression, enabling plants adapt better to the adverse stressor. Futhermore,
phytohormone also play a typical role in plant abiotic stress responses and contribute to the
adaptative mechanisms.
1.3.
Introduction of the auxin response factor transcription factor family in plant
1.3.1. Concept and classification of transcription factor
1.3.1.1.
Concept
Transcription factor is a specific DNA binding protein that binds to the promoter sequence and
regulates the gene transcription (Latchman, 1997; Brivanlou and Darnell, 2002).
1.3.1.2.
Classification
Transcription factors can be classified based on their activity, fuction or the certain structure
motif of their DNA-binding domain, DBD (Karin, 1990; Latchman, 1997; Brivanlou and Darnell,
2002). According to the identity in the DBD classification, TFs that share the similarity in DBD will
be classified into one TFs family
1.3.2. Structure and Function of transcription factor
1.3.2.1.
Structure
The structure of TFs contain several specific domains including DNA-binding domain
(DBD), trans-activating domain (TAD), and signal sensing domain (SSD).
1.3.2.2.
Function
Firsly, the basic function of TFs is the involvement in regulation of gene expression
(Weinzierl, 1999). Then, the appearance of TFs can verify the specificity of the transcription
from DNA to RNA as well as control the cell development (Lobe, 1992). One of the crucial role
of TFs is the participation in biotic and abiotic stress responses (Fujita et al.,, 2005; He et al.,,
2005; Hu et al.,, 2006; Yamaguchi-Shinozaki and Shinozaki, 2006; Fang et al.,, 2008;
Nakashima et al.,, 2009; Cutler et al.,, 2010; Fujita et al.,, 2011).
1.3.3. The research situation of transcription factor in response to enviroinmental stresses
1.3.4. The auxin response factor transcription factor
1.3.4.1.
Concept and structure
The phytohormone auxin has been known to regulate various aspects of plant growth and
development (Kieffer et al., 2010; de Jong et al., 2011; Lau et al., 2011;Ha et al., 2012). Numerous
genetic and biochemical studies in Arabidopsis have provided evidence that transcriptional
regulation of auxin response genes are regulated by two large TF families, the auxin response factor
(ARF) and the auxin/indole acetic acid (Aux/IAA) families.(Guilfoyle and Hagen 2007).
4 | Page
In Arabidopsis, there are 23 ARFs most of which contain a conserved N-terminal DNA-binding
domain (DBD), a variable middle transcriptional regulatory region (MR) and a carboxy-terminal
dimerization domain (CTD).(Perez-Rodriguez et al., 2010; Zhang et al., 2011). The DBD of ARFs
specifically binds to the conserved auxin response element (AuxRE, TGTCTC) in promoter regions of
primary or early auxin-responsive genes. The structure of the TRR of each ARF determines whether the
ARF acts as an activator or repressor. Activation domain (AD) of ARFs is usually enriched in glutamine
(Q), serine (S) and leucine (L), while repression domain (RD) is enriched in either S, L and proline (P); S,
L and/or glycine (G) or S. The ARF CTD is modular with amino acid sequence related to domains III and
IV in Aux/IAA proteins, making it function as a dimerization domain among the ARF CTDs or with
several Aux/IAA proteins (Guilfoyle and Hagen 2007)
1.3.4.2.
Roles and research progress of the auxin response factortranscription factor
In Arabidopsis, mutations in the paralogous AtARF01 and AtARF02 resulted in delayed leaf
senescence and floral organ abscission (Ellis et al.,, 2005; Lim et al.,, 2010). Similarly, AtARF07
and AtARF19 were shown to play a positive role in regulation of lateral root development (Fukaki et
al.,, 2006). Given the importance of ARF TFs in diverse biological and physiological processes, and
their potential applications for the development of improved stress-tolerant transgenic crop plants,
the ARF TF families have been identified and characterized in a number of crop species, such as
maize (Zea mays) (Xing, Pudake et al., 2011; Wang, Deng et al., 2012), rice (Oryza sativa) (Jain
and Khurana 2009; Song, Wang et al., 2009; Shen, Wang et al., 2010), sorghum (Sorghum bicolor)
(Wang, Bai et al., 2010), tomato (Solanum lycopersicum) (Wu, Wang et al., 2011), Chinese
cabbage (Brassica rapa) (Mun, Yu et al., 2012) and Citrus sinensis (Li et al.,, 2015).
1.3.5. Transcription factor in soybean
There are 61 transcription factor families in soybean containing 5035 TFs. However, 857 TF
genes have not study in characterization, functional analysis and their roles in soybean plant. Some
TF families were determined the roles of them in response to environmental stresses, including
GmNACs (Le et al.,, 2011), GmNFYAs (Ni et al.,, 2013), GmWRKYs (Lou et al.,, 2013).
1.4.
Introduction of strigolactone
1.4.1. Concept and classification of strigolactone
Strigolactones (SLs), a small class of carotenoid-derived compounds, were first
characterized over 45 years ago as seed germination stimulants in root parasitic plants, such as
Striga, Orobanche and Phelipanche species (Xie and Yoneyama 2010; Ruyter-Spira, Al-Babili et
al., 2013). SL was later reported as a root-derived signal that can enhance symbiosis between plants
and arbuscular mycorrhizal fungi (AMF) possibly through its ability to induce AMF hyphal
branching (Akiyama, Matsuzaki et al., 2005). More recently, SL was reported to play an important
5 | Page
role in the suppression of shoot branching by inhibiting the outgrowth of axillary buds (Umehara,
Hanada et al., 2008).
Strigolactone genes were classified into two groups, strigolactone biosynthesis and
strigolactone signaling genes.
1.4.2. Structure of strigolactone
To date, more than 19 natural SLs have been characterized from various plant species, and they
all share a common four-cycle skeleton (A, B, C and D), with cycles A and B bearing various
substituents and cycles C and D being lactone heterocyclic connected by an enol-ether bond (Fig. 1.5).
(+)-5-Deoxystrigol is thought to be the precursor of other strigolactones (Matusova, Rani et al., 2005).
1.4.3. Biosynthesis of strigolactone
Strigolactone, a small class of carotenoid-derived compounds, were found in many plant
species. In Arabidopsis, MAX3 and MAX4 encode CCD7 (carotenoid cleavage dioxygenase 7) and
CCD8, respectively, which catalyze sequential carotenoid cleavage reactions to produce an apocarotenone called carlactone, a proposed SL precursor (Alder, Jamil et al., 2012). MAX1 is a
cytochrome P450 monooxygenase that is presumably involved in a catalytic step downstream of
MAX3 and MAX4 (Ruyter-Spira, Al-Babili et al., 2013).
1.4.4. Signaling of strigolactone
Strigolactone is transported and percepted by the specific system. Two components of the
sitrolactone signaling are α/β-fold hydrolase, D14(Arite, Iwata et al., 2007; Arite, Umehara et al.,
2009; Hamiaux, Drummond et al., 2012; Waters, Nelson et al., 2012) and F-box protein,
MAX2/D3/RMS4 (Dun, Hanan et al., 2009; Nelson, Scaffidi et al., 2011).
1.4.5. Roles of strigolactone
Strigolactones (SLs), a small class of carotenoid-derived compounds, were first
characterized over 45 years ago as seed germination stimulants in root parasitic plants, such as
Striga, Orobanche and Phelipanche species (Xie and Yoneyama 2010; Ruyter-Spira, Al-Babili et
al., 2013). SL was later reported as a root-derived signal that can enhance symbiosis between plants
and arbuscular mycorrhizal fungi (AMF) possibly through its ability to induce AMF hyphal
branching (Akiyama, Matsuzaki et al., 2005). More recently, SL was reported to play an important
role in the suppression of shoot branching by inhibiting the outgrowth of axillary buds (GomezRoldan, Fermas et al., 2008; Umehara, Hanada et al., 2008; Xie and Yoneyama 2010).
1.4.6. Potential application of strigolactone
Strigolactone is an important regulator for growth and development of plant. Strigolactone
and its functions could become a promising approach for developing the methods and new
biotechnology for sustainable agriculture.
6 | Page
CHAPTER 2: MATERIALS AND METHODS
2.1. MATERIALS, CHEMICALS AND MACHINES
2.1.1. Materials
The model plant cultivar - Williams 82 was used for study the Auxin-response factor
transcription factor family in soybean.
The max2-3 (SALK_092836), max2-4 (SALK_028336), max3-11 (SALK_023975), max312 (SALK_015785), max4-7 (SALK_082552) and max4-8 (SALK_072750) mutants on
Arabidopsis thaliana Columbia-0 genetic background (Col-0, wild-type, WT) were used in this
study. These mutants are well-characterized by the previous study (Umehara, Hanada et al., 2008)
2.1.2. Chemicals
2.1.3. Machines
2.2. Period and Place
2.2.1. Period
The research contents have been done for 3 years (4/2012 to 3/2015).
2.2.2. Place
The research contents have been done in Signaling Pathway Research Unit, RIKEN Center
for Sustainable Resource Science, 1-7-22 Suehiro, Tsurumi, Yokohama, JAPAN 230-0045; and
National key labolatory for plant cell technology, Agriculture Genetics Institute, Pham Van Dong
road, Tu Liem, Ha Noi, Viet Nam.
2.3. Methods
2.3.1. Plant growth, treatments and collection of tissues
2.3.1.1. Plant growth, treatments and collection of tissues for soybean
2.3.1.2. Plant growth, treatments and collection of tissues for Arabidopsis
2.3.2. Identification of the GmARF members and strigolactone-related genes in soybean
All predicted GmARF TFs in soybean were collected for manual analysis from various plant
TF databases, (Mochida, Yoshida et al., 2009; Mochida, Yoshida et al., 2010; Wang, Libault et al.,
2010; Zhang, Jin et al., 2011) and only those GmARFs containing full open reading frames (ORFs),
as predicted by Glyma v1.1 ( were used for further analyses.
Genes with threshold of ≥ 90% nucleotide sequence identity were considered as duplicated genes
(Cheung, Estivill et al., 2003).
Strigolactone biosynthetic and signaling genes in soybean were predicted and classified by
BLAST method using the Arabidopsis homolog genes.
7 | Page
2.3.3. Phylogenetic analysis
Sequence alignments of all identified ARFs from Arabidopsis and soybean were performed
with a gap open penalty of 10 and a gap extension penalty of 0.2 using ClustalW implemented on
MEGA 5 software (Thompson, Gibson et al., 1997; Tamura, Dudley et al., 2007). The alignments
were subsequently visualized using GeneDoc ( as presented in
Supplementary Fig. S1. The sequence alignments were also used to construct the unrooted
phylogenetic tree by the neighbor-joining method using MEGA 5. The confidence level of
monophyletic groups was estimated using a bootstrap analysis of 10,000 replicates. Only bootstrap
values higher than 50% are displayed next to the branch nodes.
2.3.4. Expression analyses of GmARF genes using microarray data and soybean Illumina
expression data.
For tissue-specific expression analysis of GmARF genes, microarray-based expression data
for 68 types of tissues and organs housed in Genevestigator ( />were used.(Hruz, Laule et al., 2008) Illumina transcriptome sequencing data provided by Libault et
al.,(Libault, Farmer et al., 2010; Libault, Farmer et al., 2010) were also used to evaluate the
expression of GmARF genes in 8 tissues: nodules of 35-d-old soybean plants (harvested after
32 days of inoculation of the 3-d-old plants), 14-d-old shoot apical meristem (SAM), flowers
(reproductive R2 stage), green pods (R6 stage), 18-d-old trifoliate leaves, roots (V2 stage), root tips
and root hairs of 3-d-old seedlings.
For expression analysis of GmARF genes in soybean leaves at V6 and R2 stages under
drought stress, which was imposed on the plants by withholding water from the pots until the
volumetric soil moisture content reduced to below 5%, microarray data recently published by Le et
al., was used.(Le, Nishiyama et al., 2012) At the V6 stage, soybean plants had six unrolled trifoliate
leaves and seven nodes, while at R2 full bloom stage, open flowers were found on any of the top
two nodes on the main stem.
2.3.5. RNA isolation, DNaseI treatment and cDNA synthesis
2.3.5.1.
RNA isolation, DNaseI treatment and cDNA synthesis for soybean
2.3.5.2.
RNA isolation, DNaseI treatment and cDNA synthesis for Arabidopsis
2.3.5.3.
qRT-PCR Primer design
2.3.6. Dehydration treatment and microarray analysis in Arabidopsis
WT and max2-3 plants (30 plants/each) were grown in soil as described previously (Nishiyama,
Watanabe et al., 2011) and in the drought tolerance assay. Aerial portions of 24-d-old plants were
detached and exposed to dehydration by placing them on paper towels on a lab bench. At the indicated
time points, RWC of treated samples was measured (n = 5). Rosette leaves of 3 independent WT and
8 | Page
SL-signaling max2-3 mutant plants treated for 0, 2, 4 and 6 h were then collected to make three
biological replicates for microarray and expression analyses. Purification of total RNA from plant
samples and microarray analysis using the Arabidopsis Oligo 44K DNA microarray (Version 4.0,
Agilent Technology) were performed as described in (Nishiyama, Le et al., 2012). The raw microarray
data and a detailed protocol were deposited in the Gene Expression Omnibus database (GSE48949).
MapMan () and VirtualPlant ( />were used to analyze the data. In some cases, ABA and stress-responsive gene expression was analyzed
using
Genevestigator
()
or
the
Arabidopsis
eFP
browser
( />2.3.7. Assessment of drought, salt, and osmotic Sstress tolerance
2.3.7.1. Drought stress tolerance assay in Arabidopsis
2.3.7.2. Salt stress tolerance assay
2.3.7.3. Germination assay for salt stress for Arabidopsis:
2.3.7.4. Root growth assay under salt and osmotic stress conditions in Arabidopsis
2.3.7.5. Stomatal closure assay and measurement of stomatal density in Arabidopsis.
2.3.7.6. Assay for sensitivity to ABA in Arabidopsis.
2.3.8. qRT-PCR and statistical analysis of the data
qRT-PCR reactions and data analyses were performed according to previously published
methods.(Le, Nishiyama et al., 2011) The 60s and polyubiquitin 10 (UBQ10) genes were used as
reference genes in soybean and Arabidopsis. The delta-CT method was used to calculate initial
amount of target genes. When appropriate, a Student’s t-test (one tail, unpaired, equal variance) was
used to determine the statistical significance of the differential expression patterns between tissues
and/or between treatments. Considering the biological significance of the differential expression in
this study, we adopted a cutoff value of 3-fold for tissue-specific expression, and 2-fold (at least at
one time point) when analyzing stress induction or repression. The expression levels were
designated as “tissue-specific”, “induced” or “repressed” only if such differences met the above
criteria and passed the Student’s t-test.
9 | Page
CHAPTER 3: RESULTS AND DISCUSSIONS
3.1. Roles of auxin response factor transcription factor family under drought stress conditions
in soybean
3.1.1. Identification of the GmARF members in soybean
Currently, there are three databases, namely SoybeanTFDB (Mochida, Yoshida et al., 2009),
SoyDB (Wang, Libault et al., 2010) and PlantTFDB (Zhang, Jin et al., 2011) provide access to the
TF repertoire of soybean, which was obtained by genome-wide analysis of the Glyma v1.0 model.
We were able to identify 51 GmARFs with annotated full ORF, and only these full-length (FL)
GmARF TFs were used for further analyses.
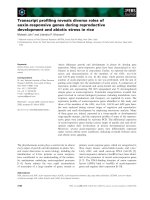
3.1.2. Chromosomal distribution, structural and phylogenetic analyses of the GmARFs
Among 51 GmARF genes, we found 17 duplicates; each pair shares ≥ 90% nucleotide
sequence identity. The GmARF functions were predicted by using the phylogenetic analysis
between GmARFs and their Arabidopsis ARF counterparts (AtARFs) (Figure 3.2).
10 | Page
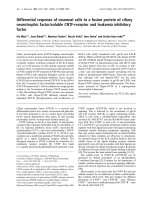
Figure 3.1. Chromosomal distribution of 51 soybean GmARF genes identified in this study
and structural analysis of the GmARF proteins. (A) Chromosomal distribution of GmARF genes
with indication of percentages of GmARFs located on each chromosome. (B) Graphical
representation for chromosomal localization of GmARF genes. Greek numbers indicate
chromosome numbers. (C) Graphical representation for domain organization of GmARF proteins.
A typical ARF contains a DNA-binding domain (DBD), which consists of a B3 subdomain and an
auxin-response (ARF) subdomain, a middle region (MR) and a carboxy-terminal dimerization
domain (CTD).
11 | Page
Figure 3.2. Phylogenetic relationship of ARFs from Arabidopsis and soybean. The unrooted
phylogenetic tree was constructed using the full ORFs of ARF proteins. The bar indicates the
relative divergence of the sequences examined. Bootstrap values higher than 50% are displayed
next to the branch.
3.1.3. Analysis of expression patterns of GmARF genes in different tissues and organs
under well-watered conditions
In the next line of our study, we have interest in gaining knowledge about tissue-specific
expression of the GmARFs. Because it enables us to identify the genes which are involved in
defining the precise nature of individual tissues. Moreover, identification of tissue-specific genes,
for instance root-specific genes, provides a resource of root-specific promoters for improvement of
drought tolerance by enhancement of root growth (Werner, Nehnevajova et al., 2010; Ha, Vankova
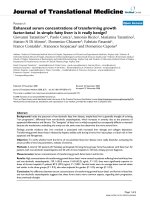
et al., 2012) (Figure 3.1.3). The results showed that 18 genes were determined as tissue-specific
12 | Page
genes, including 7 shoot-specific genes (GmARF25, 29, 34, 35, 36, 48, 50) and 11 root-specific
genes (GmARF02, 05, 09, 15, 18, 22, 27, 28, 32, 33, 49).
Figure 3.3. Expression patterns of 51 putative GmARF genes in roots (black bars) and
shoots (white bars) of 12-d-old soybean seedlings under normal conditions. On the basis of their
expression levels, the GmARF genes were classified into six groups (A-F). Data represent the
means and standard errors of three independent biological samples. Asterisks indicate significant
differences as determined by Student’s t-test (*P< 0.05; **P< 0.01; ***P< 0.001). Relative
expression was calculated based on the expression level of the target gene versus the level of the
60s reference gene.
3.1.4. Analysis of expression patterns of the GmARF genes in roots and shoots during
dehydration stress using qRT-PCR
Expression of 51 GmARF genes under drought stress condition was examined by RT-qPCR
analysis. The evaluations of expression patterns in roots and shoots separately rather than in whole
plants, might provide helpful information on the mode of action of stress-responsive GmARF genes
in these individual tissues.
13 | Page
Figure 3.6. Expression of GmARF genes in roots (black bars) and shoots (white bars) of
soybean plants under dehydration stress. (A) Upregulated GmARF genes in shoots by at least 2fold. (B) Downregulated GmARF genes in shoots by at least 2-fold. Data represent the means and
standard errors of three independent biological samples. Asterisks on the top of bars indicate
significant differences as determined by Student’s t-test (*P< 0.05; **P< 0.01; ***P< 0.001).
Relative expression was calculated based on the expression level of the target gene versus the level
of the 60s reference gene.
14 | Page
Figure 3.7. Expression of GmARF genes in roots (black bars) and shoots (white bars) of
soybean plants under dehydration stress. (A) Upregulated GmARF genes in roots by at least 2-fold.
(B) Downregulated GmARF genes in roots by at least 2-fold. (C) Venn diagram analysis of
differentially expressed GmARF genes in shoots and roots of soybean seedlings. Data represent the
means and standard errors of three independent biological samples. Asterisks on the top of bars
indicate significant differences as determined by Student’s t-test (*P< 0.05; **P< 0.01; ***P<
0.001). Relative expression was calculated based on the expression level of the target gene versus
the level of the 60s reference gene
15 | Page
The qRT-PCR analysis (Figure 3.6 and 3.7) showed that many GmARF genes were induced
by stress. Whereas, 2 upregulated genes (GmARF12, 50) and 7 downregulated gene (GmARF20, 26,
34, 35, 41, 43, 51) in both roots and shoots. On the other hand, out of 30 GmARF genes that were
downregulated in roots, 12 genes (GmARF09, 10, 15, 18, 21, 27, 28, 33, 37, 38, 44 and 49) were
found to be upregulated in shoots. Additionally, GmARF33 and GmARF50 were the most induced
genes by dehydration in shoots and roots, respectively. Therefore, these two genes would be
excellent candidates for further in planta studies in soybean.
3.1.5. Differential expression analysis of the GmARF genes in drought-stressed V6
and R2 soybean leaves and dehydrated shoots and roots of young soybean seedlings
As previously shown, dehydration stress altered expression of many GmARF genes in roots
and shoots of 12-d-old soybean seedlings. Recently, using the 66 K Affymetrix Soybean Array
GeneChip, we have carried out genome-wide expression profiling of soybean leaves at V6 and R2
stages under drought stress.(Le, Nishiyama et al., 2012). This microarray data set allowed us to
assess the drought-responsive expression patterns of the GmARF genes in the leaves of mature
soybean plants.
3.2. Roles of strigolactone in response to drought and salt stress in Arabidopsis
3.2.1. Phenotyping of the strigolactone mutant plants under drought and salt stress
conditions
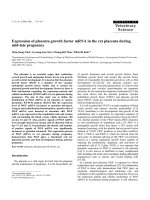
To determine the potential involvement of SL in the response of Arabidopsis to abiotic
stress, the ability of the Arabidopsis max mutant and wild-type (WT) plants to survive drought and
high salinity was examined. The results were showed in Figure 3.9 and 3.10. These data indicate
that max mutants are hypersensitive to drought and salt stresses. Thus, SL plays an important role in
the regulation of plant responses to abiotic stress.
16 | Page
Figure 3.9: Hypersensitivity of SL-deficient and SL-signaling max mutant plants to drought
stress. (A) Three-week-old WT and SL-deficient max3-11 and max4-7 and SL-signaling max2-3
mutant plants prior to being subjected to a drought stress. (B) WT and mutant plants subjected to a
drought stress and then rewatered for three days. Inflorescences were removed from the surviving
plants prior to photographing. (C) Unstressed (control) WT and max plants grown in parallel with
the drought test. (D) Percent survival rates of WT and mutant plants. Data represent the mean and
standard
error
from
data
pooled
from
three
independent
experiments
(n
=
30/genotype/experiment). Asterisks indicate significant differences as determined by a Student’s ttest (***P<0.001).
17 | Page
Figure 3.10: Hypersentivity of SL-deficient and SL-signaling max mutant plants to salt
stress. (A) Three-week-old WT and SL- deficient max3-11 and max4-7 and SL-signaling max2-3
mutant plants were treated with a total of 2 liters of 200 mM NaCl over 6 days and then watered for
3 days with plain water. Data represent the mean and standard error of three independent
experiments (n = 30/genotype/experiment). (B) Percent germination of WT and max mutant seeds
exposed to 100 mM NaCl. Data represent the mean plus standard error of data pooled from three
independent experiments (n = 50 seeds/genotype/experiment). Asterisks indicate significant
differences as determined by a Student’s t-test (**P<0.01; ***P<0.001).
3.2.2. Exogenous Application of SL Rescues the Drought-sensitive Phenotype of SL-deficient
Mutants and Enhances the Drought Tolerance of WT Plants
To further confirm SL’s role in drought stress , the effect of exogenous SL on the phenotype
of the SL-deficient and SL-response max mutant and WT plants subjected to drought stress was
determined. The data revealed that the drought-sensitive phenotype of the SL-deficient max3 and
max4 mutants could be rescued when sprayed with SL (Figure 3.11). Furthermore, SL-treated WT
plants were much more tolerant to drought than the untreated WT plants (Figure 3.11). These data
further support the role of SL as a positive regulator of plant response to drought stress.
18 | Page
Figure 3.11: Effect of SL treatment on survival of SL-deficient and SL-response mutants and
WT plants. (A) Three-week-old WT and SL-deficient max3-11 and max4-7 and SL-signaling max2-3
mutant plants prior to drought stress. (B) Three-week-old plants sprayed with either 5 ml of 5 µM
SL or water [sprayed once at 4 PM (the 1st d and from 7th to 13th d) and twice at 10 AM and 4 PM
(from 2nd to 6th d) during water withholding period] and subjected to a drought stress. Plants were
photographed 3 d subsequent to rewatering and after removal of inflorescences from the surviving
plants. (C) Non-stressed WT and max plants sprayed with 5 ml of 5 µM SL or water as described in
(B). (D) Percent survival of mutant and WT plants sprayed with either SL or water and subjected to
a drought stress as described above. Data represent the mean and standard error from data pooled
from three independent experiments (n = 30 plants/genotype/experiment). Asterisks indicate
significant differences as determined by a Student’s t-test (***P<0.001).
3.2.3. SL-deficient and SL-signaling max Mutants Are Less Sensitive to Exogenous ABA than
WT Plants
Plant responses to ABA and abiotic stresses are interrelated. ABA is induced by abiotic
stresses and ABA signaling plays a pivotal role in controlling plant adaptation to many types of
abiotic stress (Yamaguchi-Shinozaki and Shinozaki, 2006; Tran et al.,, 2007a; Fujita et al.,,
19 | Page
2011; Osakabe et al.,, 2014b; Osakabe et al.,, 2014a). Therefore, it was of interest to determine if
ABA is involved in SL-mediated plant responses to stress by analyzing the ABA responsiveness of
the max mutants to various concentrations of ABA during both germination and post-germination
developmental stages. We observed that the reduced sensitivity of the max mutants to ABA at the
stages examined as compared to WT (Figure 3.12). These results suggest the existence of crosstalk
between SL and ABA signaling pathways in the regulation of plants stress responses.
Figure 3.12: Response of SL-deficient and SL-signaling max mutant plants to exogenous
ABA treatment. (A) Percent germination of SL-deficient max3-11 and max4-7 mutant, SL-signaling
max2-3 mutant, and WT seeds treated with different levels of exogenous ABA. Data represent the
mean plus standard error of data pooled from three independent experiments (n = 50
seeds/genotype/experiment). (B) Relative fresh weight of SL-deficient max3-11 and max4-7 mutant,
SL-signaling max2-3 mutant, and WT seedlings to application of different concentrations of
exogenous ABA. Relative fresh weights of all seedlings were determined after 14 d of incubation at
22 ºC. Data represent the mean and standard error (n = 6, where each replicate is composed of
seven pooled plants). Asterisks indicate significant differences as determined by a Student’s t-test (*
P<0.05; **P<0.01; ***P<0.001).
3.2.4. Root Growth of max and WT Plants under High Salinity and Osmotic Stress
One of the successful strategies exhibited by plants to deal with osmotic stress is to alter
root-related traits, such as root physiology and growth (Manavalan, Guttikonda et al., 2009;
Galvan-Ampudia and Testerink 2011). To gain insight into mechanisms that render max mutant
20 | Page
plants more sensitive to abiotic stress, we examined root growth in max and WT plants under salt
and osmotic stresses. In our experimental design, various concentrations of mannitol were used to
induce osmotic stress. Root growth in the max mutant and WT plants was inhibited to similar
extents by treatments with different concentrations of NaCl and mannitol (Figure 3.2.6), indicating
that the stress-sensitive phenotype of max plants is not associated with a differential effect on root
growth or development, at least up to 11 days of growth.
3.2.5. Comparison of Dehydration-induced Water Loss Rates, ABA-mediated Stomatal
Closure, and Stomatal Density in the max Mutant and WT Plants
Figure 3.15: Relative water content (RWC), relative size of the stomatal aperture, and
stomatal density of the WT and SL- deficient and SL-signaling max mutant plants. (A) Time course
of RWC of WT and SL- deficient max3-11 and max4-7 and SL-signaling max2-3 plants exposed to
drought stress.
Data represent the mean and standard error (n = 5, where each replicate
represents the weight of six plants). Room temperature and relative room humidity data recorded
during the course of the experiment are also presented. (B) Average size of the stomatal aperture of
rosette leaves from 3-week-old WT and max mutant plants in the presence or absence of ABA
presented as a percent relative to the size of stomatal aperture in WT and mutant plants not exposed
to ABA which was defined as 100%. Epidermal peels were treated with ABA for 1 h after stomatal
preopening under light conditions. Data represent the mean and standard deviation (n = 200).
(C) Guard cells of 3-week-old WT and max mutant plants exposed to 30 µM ABA for 1 h or left
21 | Page
unexposed. Bars = 20 µm. (D) Average stomatal density on the abaxial and adaxial sides of rosette
leaves from 3-week-old WT and max mutant plants. Data represent the mean and standard
deviation (n = 30). Asterisks indicate significant differences as determined by a Student’s t-test
(*P<0.05; **P<0.005; ***P < 0.001).
The previous result in root examination suggested that an alteration in shoot-related traits
was the cause of the stress-sensitive phenotype observed in max plants. Leaf water status and water
loss rates of WT and max mutant plants exposed to dehydration were compared. The results were
summarized in Figure 3.15 showed that SL-deficient and -signaling max mutant plants lost water
faster than WT plants. Stomatal density was higher in max mutant lines than in WT plants.
Additionally, stomatal cells of both the max mutants closed more slowly than in WT plants in
response to ABA treatment.
3.2.6. Comparative Transcriptome Analysis of Leaves of the SL-response max2-3 and WT
Plants under Well-watered and Dehydrative Conditions
A comparative transcriptome analysis of leaves of WT and SL-signaling max2-3 plants
under both normal and dehydrative stress conditions was conducted using the Arabidopsis 44K
DNA oligo microarrays (Figure 3.16). This was done to identify genes involved in the downstream
pathways affected by SL-mediated responses to drought stress. The microarray data displayed an
interaction between SL, ABA and CK in response to drought stress. On the other hand, SL regulates
the plant response to drought stress in ABA-independent manner via flavonoid synthesis and
photosynthesis.
22 | Page
Figure 3.16: Relative water content (RWC) of leaves of WT and SL-signaling max2-3
mutant plants exposed to a dehydrative stress and analysis of differential gene expression analysis
in leaves of WT and SL-signaling max2-3 mutant plants under well-watered and dehydrative
conditions. (A) Time course of RWC of aerial portions of WT and max2-3 plants exposed to a
dehydrative stress. Data represent the mean and standard error (n = 5). Asterisks indicate
significant differences as determined by a Student’s t-test (**P< 0.01; ***P< 0.001). Rosette leaf
samples collected at 0, 2 and 4 h (arrows) were used for microarray analysis. Room temperature
and relative room humidity were recorded during the dehydrative treatment. (B) Detached
representative leaves from well-watered WT and max2-3 plants. (C) Diagrams showing the
compilation of genes with altered expression in each comparative expression analysis. Data were
obtained from the results of three independent biological replicates of microarray experiments. (D)
Venn diagram analysis showing the overlapping and non-overlapping up-regulated gene sets. MC/W-C, max2-3–well-watered control-0 h versus WT–well-watered control-0 h; M-D2/W-D2,
max2-3–dehydrated-2 h versus WT–dehydrated-2 h; M-D4/W-D4, max2-3–dehydrated-4 h versus
WT–dehydrated-4 h; W-D2/W-C, WT–dehydrated-2 h versus WT–well-watered control-0 h; WD4/W-C, WT–dehydrated-4 h versus WT–well-watered control-0 h; M-D2/M-C, max2-3–
dehydrated-2 h versus max2-3–well-watered control-0 h; M-D4/M-C, max2-3–dehydrated-4 h
versus max2-3–well-watered control-0 h.
23 | Page