The impact of risk factors to production and businesss performance in vietnam
Bạn đang xem bản rút gọn của tài liệu. Xem và tải ngay bản đầy đủ của tài liệu tại đây (516.98 KB, 20 trang )
1
CHAPTER 1: INTRODUCTION
1.1 Research rationale: Vietnam is the second largest coffee producer with an average volume about 1.3
million tons coffee per year. Its areas under crop for producing coffee is approximately 641.7 thousand
hectares. Most of them are used for export in the form of raw materials. Vietnam exported about 1.906
million tons of coffee, with the volume sale of $ 3, 5569 billion in 2014. Although coffee industry is
highly effective, it also faces with a lot of risks from the uncertainty factors. In addition, coffee producers
and sellers lack of competence in risk management. Thus, it is essential to do a research in the field of risk
management in coffee industry. The research “The impact of risk factors to production and businesss
performance in Vietnam” is carried out to satisfy this demand.
1.2 Research objectives: This research is designed to achieve three objectives. Firstly, it tries to identify
the risk factors, influencing the production and trading of coffee, discover the gap in risk management
theory from literature review, and suggest conceptual framework. Secondly, the influence of risk factors,
measured by appropriate scales, on producing and trading coffee is identified. Thirdly, risk management
solutions are built/suggested to reduce the impacts of risk factors on coffee industry. Fourthly, it aims to
provide some complementary knowledge in risk theories.
1.3 Research questions: The research aims to address four questions. Firstly, what do risk factors
influence producing and tradingcoffee in Vietnam? And what do theoretical gaps, related to risks, address
in this research. Secondly, what are relationships between risk factors and production and business
performance in the context of Vietnam? Thirdly, what are risk management solutions appropriate for
coffee producing and selling in Vietnam? Fourthly, How do the research findings contribute to the risk
management theories?
1.4 Research methodology: Qualitative and quantitative approach are combined in doing this research.
1.5 Research object and scope:
1.5.1 Research object: Risk factors influencing
coffee production and business performance in
Vietnam. .
1.5.2 Scope of research: Measurement scales and conceptual framework, which present the relationships
between risk factors and coffee production and business performance in the period from 2010 to 2015, are
built based on the literature review of previous related research and field survey. .
1.6 Research contributions: (1) Building new measurement scales for risk factors, influenced to
production and business performance. (2) Assessing all types of risks associated to coffee producing and
selling process in detail, thorough, and comprehensive. (3) highlighting the two faces of risk, which are
chance of losses and gains (4); Adding the new theoretical perspective to risk and risk management
theories
2
CHAPTER 2: LITERATURE REVIEW AND CONCEPTUAL FRAMEWORK
2.1 Risk
2.1.1 Traditional approach (negative approach): (1) Hoàng Phê (1995) said that “Risk is bad, not
good, and sudden occurrence”; (2) Nguyễn Lân (1998) considered “Risk is unlucky occurrence”; (3)
Oxford dictionary defines “the possibility of something bad happening at some time in the future; a
situation that could be dangerous or have a bad result”; (4) Hồ Diệu (2002) described “Risk is measured
by asset losses or less actual profit than expected profit”
2.1.2 Hedging approach: (1) Frank Knight (1921, page 233): “Risk is measured uncertainty”; (2) Allan
Herbert Willett (1951, page 6): “Risk is exposure to uncertainty related to unexpected occurrences”; (3)
C. Arthur William et al. (1964): “Risk is potential deviation in outcomes. When risk occurs, people are
not able to predict exactly outcome. The existence of risk causes uncertainty. Risk occurs when any
people’s action leads to unpredictable gain or losss possibility; (4) David Apgar (2006): “Risk is any
uncertainty outcome which affects actual results and make them different from expected results”.
2.1.3 Other definitions: (1) Vân, Đ.T.H et al., (2013, tp. 32): “Risk is measured uncertainty, when
managed well, people can get opportunities; on contrary, when managed bad losses will occur”; (2)
Aswath Damodaran (2010, p. 86 t1): “Risk refers to likelihood to get actual investment rate of return
which is different from expected investment rate of return. Thus, risk refers to not only bad outcome,
when actual is lower than expected investment rate of return, but also good outcome, when actual is
higher than expected investment rate of return. In reality, we can say that risk is associated a change of
gains when it bring good outcome and a change of losses if it accompanies to bad outcome. We should
consider both of them when assessing risk”. (3) Ngô Quang Huân. N.Q et al (1998, page 8): “Risk is
potential variation in outcomes, the lager number of type of outcomes and the greater variation among
them, the greater level of risk. Risk is objective concept and measured”.
2.1.4 Suggested concept in this research: Risk is occurrence at a given probability and makes variations
in outcome of occurrence, and makes a difference from expected or predicted results. Otherwise, risk
existence may cause unpredicted losses. Duplicity of risk concept involves a chance of losses and gains.
After all, risk is an objective phenomenon, happened out of people’s intention, but it is identified,
measured, and controlled. Furthermore, human being may be able to transform from a chance of losses to
a chance of gains.
2.2 Losses: Tuấn, A.N. (2006, page 21) defined losses as “damage and lost in term of asset, opportunities,
physical and mental human well-being, people’s health, and career development are caused by risks”.
2.3 The relationship between potential variations in production and business performance and risks
3
2.3.1 The concept of variation in production performance: It refers to changes in actual production
performance in comparison to expected production performance. These changes are invisible and caused
by risk factors.
2.3.2 The concept of variation in business performance. Variations in business performance refer to
difference between actual and expected business performance, caused by risk factors.
2.4 Risk management: It is defined as “scientific, continuous, comprehensive, and systematic approach
process to risks. This process is used to identify, control, prevent, reduce damage, losses, and negative
effects of risks, and make them to be opportunities” (Vân, D.T.H, et al., 2013, page 66)
The suggested definition of risk management in this research is “Risk management is
scientific, continuous, comprehensive, and systematic approach process to risks in order to identify,
control, prevent, reduce damage, losses, and negative effects of risks based on predicted probability of
risk occurrence, and make disadvantage to be advantage risk.
2.5 Literature review related to research
Table 2.1: Previous researches in foreign countries
No
RISK FACTORS
Previous
researches
WB (2004)
PRODCUCTION
Market
price,
weather,
01
working
pest,
BUSINESS
capital, Market price, international financial
production market, working capital, business
imbalance.
pattern, psychological and behavior
businessman.
UNCTAD/WT
Market
O (2002)
international coffee roasted suppliers,
02
price,
international
business
speculators,
pattern,
market
information, working capital, and
society.
Quoc
03
Luong Market
price,
psychology
and
and Loren W. behavior of producers.
Tauer (2004)
ICO (2014)
04
World
coffee
trade
1963-
Market
imbalance , society
Thinh Hoang Si
production Market
price,
business
pattern,
international speculators, international
coffee roasted suppliers, international
finance markets, and society.
2013.
05
price,
Market price
4
& Huong
Nguyen Thi
(2015)
No
RISK FACTORS
Previous
researches
PRODCUCTION
WB (2015
BUSINESS
Weather, pest. Working capital, Market price, international payment
06
political mechanism.
currencies, foreign exchange rate,
working capital.
07
Bunn, Christian
Weather.
(M.Sc.) (2015)
Table 2.2: Previous researches in Vietnam
No
01
RISK FACTORS
Previous
Researches
PRODUCTION
BUSINESS
Geography
and
National
Resource
Center,
Thời tiết.
Vietnam
Institute
of
Science
and
Technology
(1987)
02
Nghị, N.S at
al., (1996)
Pest and production process
Gia, T.B and Market
Cường,
03
(2005)
price,
H.T production
political
psychology
producers...
working
Finance
Markets,
technology, producers’ psychology and behavior
process,
institutions,
and
capital, International
society,
behavior
of
5
No
RISK FACTORS
Previous
Researches
PRODUCTION
BUSINESS
Chi, T.Q. T Market price, political institutions, Market price, international payment
(2007).
04
society, working capital, production currencies
and
exchange
imbalance.
political
institutions,
working
capital,
rate,
society,
international
finance markets, psychology and
behavior of businessmen...
05
Tran,
(2011)
N.T.N Market price
6
2.6 Conceptual framework and hypotheses: The impact of risk factors to production and business
performance in Vietnam
2.6.1 Conceptual framework and hypotheses: The impact of risk factors to production and business
performance in Vietnam
2.6.1.1 Conceptual framework and hypotheses: The impact of risk factors to production
performance in Vietnam
FACTOR DETERMINANTS OF
RISK’S IMPACT
PRODUCTION PERFORMANCE
TO RODUCTION
AND
BUSINESS
PERFORMANCE
GTT
KTSX
CN
THT
TTSX
SDB
MCDSX
BDKQSX
VSX
HVNSX
IMPACT
TO
PRODUCTION
PERFORMANC-E
RISKS’
MPACT
TO
PRODUCTIO
N
PERFORMA-NCE
FACTOR DETERMINANTS OF
BUSINESS PERFORMANCE
RISK’S
GTT
KTKD
TTTT
QDCQT
NRX
TTTC
DTTTG
VKD
IMPACT
TO
BUSINESS
IMPACT TO BUSINESS
PERFORMAN-CE
PERFORMANCE
TTKD
BDKQKD
HVNKD
7
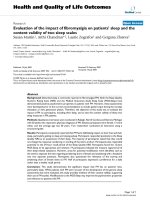
2-1 Conceptual framework: The impact of risk factors on production and business performance.
(Source: Văn, L.B)
- Potential deviation model
in production performance is determined by following
multiregression: BDKQSX = β1 + β2GTT + β3KTSX+ β4CN+ β5THT+ β6SDB + β7VSX + β8MCDSX +
β9TCCTSX+ β10XHSX+ β11HVNSX + u
+ Dependent variable is: “Potential deviation in production performance” and denotes as
BDKQSX
+ Independent variables include “Market price” (GTT); “Production process” (KTSX);
“Production technology” (CN); “Weather” (THT); “Pest” (SDB); “Working capital” (VSX); “Production
imbalance” (MCDSX); “The impact of political institutions on production” (TCCTSX); “Social impact
on production” (XHSX); “Producers’ psychology and behavior” (HVNSX).
- Loss model in production is defined as follows: TTSX = γ1 + γ2GTT' + γ3KTSX'+ γ4CN'+
γ5THT'+ γ6SDB'+ γ7VSX'+ γ8MCDSX'+ γ9TCCTSX'+ γ10XHSX'+ γ11HVNSX' + u'
+ Dependent variable is: “Loss in production” and denotes as TTSX.
+ Independent variables are defined as “Market price” (GTT'); “Production process” (KTSX');
“Production Technology” (CN'); “Weather” (THT'); “Pest” (SDB'); “Working capital” (VSX');
“Production imbalance” (MCDSX'); “The impact of political institutions on production” (TCCTSX');
“Social impact on production” (XHSX'); “Producers’ psychology and behavior” (HVNSX').
- Hypotheses: There are nine hypotheses, ranged from HSX1 đến HSX9, in potential deviation
model of production performance. Loss model in production has nine hypotheses, ranged from H'SX1 đến
H'SX9.
2.6.1.2 Conceptual framework used to examine the impact of risk factors on business performance
and derive hypotheses:
- Potential deviation model in business performance is as follows: BDKQKD = β'1+ β'2GTT+ β'3KTKD+
β'4TTTT+ β'5TTTC+ β'6VKD+ β'7DTTTG+ β'8QDCQT+ β'9NRX+ β'10TCCTSX+ β'11XHSX ++
β'12HVNKD+ u
+ Dependent variable is "Potential deviation in business performance”, denoted as BDKQKD.
+ Independent variables include "Market price” (GTT); "Business process” (KTKD); "Market
information” (TTTT); "International finance markets” " (TTTC); "Working capital” (VKD);
"International payment currencies and foreign exchange rate” (DTTTG); "Speculate Funds” (QDCQT);
"International roasted coffee-nut producers” (NRX), “The impact of political institutions on production”
(TCCTKD); “Social impact on production” (XHKD);
(HVNKD).
" Producers’ psychology and behavior "
8
- Loss model in business performance is defined as follows: TTKD = γ'1 + γ '2GTT' + γ'3KTKD'+
γ'4TTTT' + γ'5TTTC'+ γ'6VKD'+ γ'7DTTTG' + γ'8QDCQT' + γ'9NRX' + γ'10TCCTSX'+ γ'11XHSX' +
γ'12HVNKD' + u'
+ Dependent variable is: "Loss in business performance” and denoted as TTKD
+ Independent variables are "Market price” (GTT'); "Business process” (KTKD'); "Market
information” (TTTT'); "International finance markets” (TTTC'); "Working capital” (VKD');
"International payment currencies and foreign exchange rate” (DTTTG'); "Speculate Funds” (QDCQT'); "
International roasted coffee-nut producers” (NRX'); “The impact of political institutions on production”
(TCCTKD'); “Social impact on production “(XHKD'); " Producers’ psychology and behavior”
(HVNKD').
- Hypotheses: Potential deviation model in business performance has ten hypotheses, ranged from
HKD1 đến HKD10; and loss model in business performance includes also ten hypotheses, ranged from H'KD1
đến H'KD10.
CHAPTER 3: RESEARCH METHODOLOGY
3.1 Delphi method. Information is collected from experts through the following process: (1) determining
the research’s objectives; (2) selecting relevant experts (3) designing questions and sending them to
experts; (4) summarizing the experts ‘response and writing the executive report; (5) sending executive
report to experts to get comments; (6) Receiving the new revising comments from experts; (7) doing the
third step until making a consensus agreement.
3.2 Scale validity assessment. Assess the scale validity for each latent variable by calculating cronbach
alpha. The acceptable level of cronbach’s alpha ranges from 0.6 to 0.9.
3.3 Assess and revise measurement scale by EFA. Carrying out exploratory factor analysis and testing
necessary requirement of EFA satisfy two criteria: KMO 50%; and Sig 5%.
3.4 Correlation analysis. Testing collinearity relationship among independent variables: identify a
statistically significant high correlation coefficient at the level of 5%..
3.5 Multi regression analysis: Carry out multiregression analysis between dependent variable and
independent variables, discovered from EFA.
3.6 Sample design
3.6.1 Sampling method: Stratification sampling is used to satisfy a presentativeness of respondents in
term of area, size, and type of business.
3.6.2 Sample size.: According to Hoelter (1983), a minimum sample size is 200 respondents. The
sampling process is this research is as follows:
9
3.6.1.1 Sample size requirement in building measurement scale (Delphi method). Sample size in
production sector: n =10; sample size in business sector: n = 10;
3.6.1.2 Sample size in preliminary research
- Sample size in preliminary research is determined by qualitative approach as follows:: (1)
Production sector: n = 50 (Group discussion: n = 10; Questionnaire survey: n = 40); (2) Business sector: n
= 50 (Group discussion: n = 10; Questionnaire: n = 40).
- Sample size in preliminary research is determined by quantitative approach is as follows: (1)
Production sector: n = 100; (2) Business sector: n = 100.
3.6.1.3 Sample size in formal research (quantitative approach): Production sector: n = 200; Business
sector: n = 200.
CHƯƠNG 4: RESEARCH RESULTS AND DISCUSSIONS
4.1 Research results:
4.1.1 Measurement scale design and testing:
4.1.1.1 Measurement scale assessing by Delphi method:
- Production sector: Questionnaires designed based on eleven definition of risk (mention in part
2.1) were sent to ten specialists. After 5 rounds discussions and responses, all of them make consensus
agreement in defining production risk in terms of potential deviations in production performance and
production losses.
- Business sector: Questionnaires designed based on eleven definition of risk (mention in part 2.1)
were sent to ten specialists. After 4 rounds of discussions and responses, all of them make consensus
agreement in defining production risk in terms of potential deviations in business performance and
business performance losses..
4.1.1.2 Measurement scale assessment in preliminary research:
- Preliminary research with qualitative approach:
+ Coffee production: (1) Potential deviations in production performance: rate of agreement
for each risk factor is as follows: BDKQSX: 96%; GTT: 90%; THT: 80 %; SDB: 82%; KTSX: 76%;
CN: 78 %; MCDSX: 72 %; VSX: 84 %; HVNSX: 70 %; TCCTSX: 32 %; XHSX: 36%. (2) Losses in
production performance: rate of agreement for each risk factor is as follows: TTSX: 88%; GTT: 92%;
THT: 82%; SDB: 80%; KTSX: 74%; CN: 70%; MCDSX: 68%; VSX: 84%; HVNSX: 68%; TCCTSX:
28%; XHSX: 30%.
10
+ Coffee Business in Vietnam: (1) Deviation in business performance: agreement rate for each
risk factor is as follows: BDKQKD: 92%; GTT: 98%; KTKD: 80%; QDCQT: 90%; NRX: 72%; TTTT:
84%; DTTTG: 74%; TTTC: 76%; VKD: 84%; HVNKD: 70%; TCCTKD: 36%; XHKD: 34%. (2) Losses
in business performance: agreement rate for each risk factor is as follows: TTKD: 80%; GTT: 92%;
KTKD: 76%; QDCQT: 90 %; NRX: 72%; TTTT: 88%; DTTTG: 74%; TTTC: 76%; VKD: 86%;
HVNKD: 70%; TCCTKD: 26%; XHKD: 28% .
- Preliminary research with quantitative approach:
+ Production sector
* Potential deviation in production performance:
● Measurement scale reliability by cronbach’s alpha coefficient: Two of the total eleven
variables, removed from the model after reliability analysis, are TCCTSX, and XHSX.
● Results from Exploratory factor analysis:
(1) Independent factor: KMO coefficient is 0.734; P-value is 0.00; and total variance explained by
the factor is 77.86%. Thus, data is fitted to the research model..
(2) Independent factor: Results from EFA for eight factor are as follows: KMO = 0,675; P-value
= 0,00; Total variance explain by factor is 75.544%. Data is fitted to the research model.
* Losses in production performance in preliminary research:
● Scale Reliability assessment by Cronbach's alpha: Two of the total eleven variables,
removed from the research model after reliability analysis, are “TCCTSX” and “XHSX”.
●Results from exploratory factor analysis ( EFA)
(1) Dependent factor: KMO coefficient is 0.734; p-value is less than critical value (0.00 in
comparison to 0.05; and total variance explained by this factor is 81.697%. Data is fitted to the research
model.
(2) Independent factor: Results from EFA for 8 factors are as follows: KMO = 0.709; p-value =
0,00; and total variance explained =77.096%. Data is fitted to the model.
* Potential deviation in business performance (Preliminary research):
● Scale reliability assessment by Cronbach's alpha: Two of the total eleven variables, removed
from the research model after reliability analysis, are TCCTSX and XHSX.
● Results from Exploratory factor analysis in preliminary research: (1) Dependent factor:
KMO = 0.45; p-value = 0.00; total variance explained by factors = 80.56%; data is fitted to the research
model. (2) Independent factor: results from exploratory factor analysis for 9 factors are as follows: KMO
11
= 0.666; P-value (Sig) = 0.00; total variance explained by factors = 76.95%. Data is fiited? to research
model.
* Losses in business performance (preliminary research):
● Scale reliability assessment by Cronbach's alpha:
Two of the total twelve variables,
removed from the research model after reliability analysis, are “TCCTSX” and “XHSX”.
● Results from exploratory factor analysis ( EFA)
(1) Dependent factor: KMO coefficient is 0.742; P-value (Sig) is less than critical value (0.00 in
comparison to 0.05); total variance explained by this factor is 80.05%. We can conclude that data is fitted
to research model.
(2) Independent factors: Results from EFA for 8 factors are as follows: KMO coefficient is 0.649;
p-value (sig) is less than critical value (0.00 in comparison to 0.05); and total variance explained by these
factors are 76.932%. Data is fitted to the research model..
4.1.1.3 Carry out formal research by using quantitative approach
- Formal research in coffee production sector:
+ Potential deviation in production performance:
* Scale reliability assessment by Cronbach's alpha : All nine factors satisfy requirement
reliability. Thus, nothing is removed
* Results from exploratory factor analysis:
● Dependent factor: KMO coefficient is 0.744; P-value (Sig) is 0.00; and total variance explained
by this factor is equal to 81.581%. We can conclude that data is fitted to research model.
● Independent factors: Results from exploratory factor analysis for eight factors as follows: KMO
coefficient is 0.75; P-value (sig) is 0.00; and total variance explained for these factors is 75.25%. Data is
fitted to the research model.
* Correlation coefficient analysis among independent variable: correlation coefficients
between independent variable are low and medium at the statistically significance of 5% so there is not
collinearity.
* Multiple regression analysis for relationship between dependent variable (Potential
deviation of production performance) and independent variables: The adjusted determinant
coefficient is 0. 523; F-statistic value is 28.274.; all variance inflation factors are less than 2; and pvalues for t-statistics are significant at the value of 5 %. These results allow us to conclude that all
independent variable have impact on the potential deviation of production performance and variation of
all dependent variable explains 52.3% of total variance of dependent variable. (See table 4.1) .
12
Table 4.1: Multiple regression coefficients and collinearity test .
Unstandardized
Standardized
coefficients
coefficients
Model
Beta
1
Standard
error
Collinearity
tstatistic
Beta
Tolerance
-.941
.358
KTSX
.114
.043
.136
CN
.133
.057
.135
GTT
.142
.060
.122
2.387
.053
.130
(Constant)
THT
.126
statistic
Sig
VIF
-2.626
.009
2.681
.008
.933
1.072
2.343 .020
.725
1.380
.018
.918
1.089
2.362
.019
.787
1.271
SDB
.211
.048
.242
4.355
.000
.776
1.289
VSX
.241
.051
.251
4.754
.000
.859
1.164
MCDSX
.178
.053
.172
3.356
.001
.916
1.092
HVNSX
.186
.043
.217
4.320
.000
.949
1.054
(Note: dependent variable is potential deviation of production performance; source: calculated by author).
Multiple regression model: BDKQSX = 0,136 KTSX + 0,135 CN + 0,122 GSX + 0,130 THT + 0,242
SDB + 0,251 VSX + 0,172 MCDSX + 0,217 HVNSX
+ Losses in production performance:
* Scale reliability testing by Cronbach's alpha: Result from scale reliability analysis for nine
factors (one dependent factor and 8 independent factors) shows that these factors are satisfied reliability
requirement.
* Results from exploratory factor analysis (EFA):
● Exploratory factor analysis for dependent factor: KMO coefficient is 0.748; p-value (sig) is
0.00; and total variance explained by this factor is 82.609%. Thus, data is fitted to research model.
13
● Results from exploratory factor analysis for eight independent factors are as follows: KMO
coefficient is 0.740; p-value (sig) is 0.00; and total variance explained by these factors is 75.765%. Data
is fitted to the research model.
* Correlation analysis: there is statistically significant relationship between independent
variable and dependent variables at the level of 5%. In other hand, correlation coefficient among
independent variable is significant low so there is not collinearity among them.
* Results from regression analysis: The adjusted R2 is 0.586; F-statistics is equal 36.166; and
all variance inflation factors of dependent variables are less than 2. Thus, the model good of fitness is
acceptable (See table 4.2). In addition all p-values of independent variables is statistically significant at
the level of 5% so we can conclude that these independent variables have influence on dependent variable
(losses in production performance)
Table 4.2: Multiple regression coefficients and collinearity test.
Unstandardized
Standardized
coefficients
coefficients
Model
Beta
1
-
(Constant) 1,368
Standard
error
Collinearity
tstatistic
statistic
Sig
Beta
,335
Tolerance VIF
-4,085
,000
KTSX
,096
,041
,112
2,349
,020 ,911
1,098
CN
,168
,054
,169
3,121
,002 ,713
1,403
GTT
,185
,058
,155
3,199
,002 ,891
1,122
THT
,110
,052
,113
2,139
,034 ,751
1,332
SDB
,216
,047
,236
4,583
,000 ,782
1,278
VSX
,245
,049
,246
,000 ,855
1,170
MCDSX
,216
,054
,194
4,041
,000 ,903
1,107
HVNSX
,208
,042
,233
4,919
,000 ,927
1,079
4,993
(Note: dependent variable is losses in production performance; calculated by author). The multiple
regression model may be expressed as follows: TTSX = f(KTSX,CN,GTT, THT, SDB, VSX, MCDSX,
HVNSX). Result from regression analysis is: TTSX = 0,122 KTSX + 0,169 CN + 0,155 GTT + 0,113
THT + 0,236 SDB + 0,246 VSX + 0,194 MCDSX + 0,233 HVNSX
14
- Formal research in coffee business sector:
+ Potential deviation in business production performance:
* Scale reliability assessment by Cronbach's alpha: All ten factors are satisfied the reliability
requirement because their conbach’s alpha coefficient are in the range between 0.6 and 0.9.
*
Results from exploratory factor analysis:
● Exploratory factor analysis for dependent factor: KMO coefficient is 0.777; p-value (sig) is
0.00; and total variance explained by this factor is 74..980%. Thus, data is fitted to research model.
● Results from exploratory factor analysis for nine independent factor are as follows: KMO
coefficient is 0.776; p-value (sig) is 0.00; and total variance explained by these factors is 74.798. Data is
fitted to the research model.
* Correlation coefficient analysis among independent variable: There is high correlation
coefficient between dependent variable and independent variable and correlation coefficients between
independent variable are low and medium at the statistically significance of 5% . So there is not
collinearity among independent variables.
* Multiple regression analysis for relationship between dependent variable (Potential
deviation of business performance) and independent variables: The adjusted determinant coefficient
is 0. 644; F-statistic value is 38.126.; all variance inflation factors are less than 2; and p-values for tstatistics are significant at the value of 5 %. These results allow us to conclude that all independent
variable have impact on the potential deviation of business performance and variation of all dependent
variable explains 64.4% of total variance of dependent variable. (See table 4.3) .
15
Table 4.3: Multiple regression coefficients and collinearity test
Unstandardized
Standardized
coefficients
coefficients
Mode
l
Beta
Standard error
-1.644
.328
.130
.042
TTTT
.161
TTTC
VKD
1(Con
Collinearity statistic
t-statistic
Sig
Beta
Tolerance
VIF
-5.010
.000
.144
3.137
.002
.894
1.119
.053
.152
3.019
.003
.736
1.359
.133
.054
.112
2.471
.014
.914
1.094
.119
.050
.121
2.398
.017
.737
1.357
.135
.056
.131
2.391
.018
.623
1.606
.210
.044
.238
4.824
.000
.769
1.300
NRX
.214
.048
.220
4.431
.000
.758
1.320
GTT
.212
.047
.203
4.487
.000
.913
1.095
.173
.039
.199
4.422
.000
.930
1.075
stant)
KTK
D
DTTT
G
QDC
QT
HVN
KD
(Note: Dependent variable is BDKQKD; Source: Calculated by author).
The
multiple
regression
model
may
be
express
as
follows:
BDKQKD=f(KTKD,TTTT,TTTC,VKD,DTTTG,QDCQT,GTT,HVNKD).
Result from multiple regression analysis is as follows: BDKQKD = 0,144 KTKD + 0,152 TTTT + 0,112
TTTC + 0,121 VKD + 0,131 DTTTG + 0,238 QDCQT + 0,220 NRX + 0,203 GTT + 0,199 HVNKD
16
+ Losses in business performance (formal research):
* Scale reliability testing by Cronbach's alpha: Result from scale reliability analysis for ten
factors (one dependent factor and 9 independent factors) indicates that these factors are satisfied
reliability requirement.
* Results from exploratory factor analysis (EFA):
● Exploratory factor analysis for dependent factor: KMO coefficient is 0.738; p-value (sig) is
0.00; and total variance explained by this factor is 79..605%. Thus, data is fitted to research model.
● Exploratory factor analysis for nine independent factors: KMO coefficient is 0.758; p-value
(sig) is 0.00; and total variance explained by this factor is 75.2785%. Thus, data is fitted to research
model.
* Correlation coefficient analysis: There is high correlation coefficient between dependent
variable and independent variable and correlation coefficients between independent variable are low and
medium at the statistically significance of 5% . So there is not collinearity among independent variables.
* Multiple regression analysis for relationship between dependent variable (Potential
deviation of business performance) and independent variables: The adjusted determinant coefficient
is 0. 613; F-statistic value is 36.053.; all variance inflation factors are less than 2; and p-values for tstatistics are significant at the value of 5 %. These results allow us to conclude that all independent
variable have impact on the potential deviation of business performance and variation of all dependent
variable explains 61.3% of total variance of dependent variable. (See table 4.4)
17
Table 4.4: Multiple regression coefficients and collinearity test
Unstandardized
Standardized
coefficients
coefficients
Model
t-statistic
Beta
1(Consta
Collinearity statistic
Standard
Beta
error
-1.486
.330
KTKD
.147
.041
TTTT
.141
TTTC
Sig
Tolerance
VIF
-4.505
.000
.167
3.582
.000
.899
1.112
.054
.133
2.617
.010
.748
1.337
.146
.054
.123
2.698
.008
.935
1.070
VKD
.110
.050
.113
2.207
.029
.738
1.356
DTTTG
.151
.056
.148
2.713
.007
.654
1.528
QDCQT
.204
.043
.240
4.763
.000
.768
1.302
NRX
.171
.048
.178
3.583
.000
.789
1.267
nt)
GTT
.188
.043
.199
4.322
.000
.918
1.089
HVNKD
.200
.038
.237
5.220
.000
.940
1.064
(Note: Dependent variable is TTKD; Source: Calculated by author).
The multiple regression model may be express as: TTKD =
f(KTKD,TTTT,TTTC,VKD,DTTTG,QDCQT,GTT,HVNKD).
Result from multiple regression is as follows: TTKD = 0,167 KTKD + 0,133 TTTT + 0,123
TTTC + 0,113 VKD + 0,148 DTTTG + 0,240 QDCQT + 0,178 NRX + 0,199 GTT + 0,237 HVNKD
4.1.2 Results from testing research framework:
4.1.2.1 Testing conceptual framework:
- Conceptual framework of risk’s impact on coffee production:
18
+ Conceptual framework related to potential deviation of production performance: There
are nine research concepts, after removed two research concepts (one dependent concept and eight
independent concepts).
+ Conceptual framework related to losses in production performance.: There are nine
research concepts, after removed two research concepts (one dependent concept and eight independent
concepts).
- Conceptual framework of risk’s impact on coffee business:
+ Conceptual framework related to potential deviation of business performance: There are
ten research concepts, after removed two research concepts (one dependent concept and nine independent
concepts).
+ Conceptual framework related to losses in production performance: There are ten research
concepts, after removed two research concepts (one dependent concept and nine independent concepts).
4.1.2.2 Testing hypotheses
- Conceptual framework related to potential deviation of production performance: Nine
hypotheses, ranged from Hsx1 to Hsx9, are statically accepted at the significant level of 5%
- Conceptual framework related to losses in production performance: Nine hypotheses,
ranged from H'sx1 to H'sx9 are statically accepted at the significant level of 5%
- Conceptual framework related to potential deviation of business performance: Ten
hypotheses, ranged from Hkd1 cho đến Hkd10, are statically accepted at the significant level of 5%.
- Conceptual framework related to losses in production performance: Ten hypotheses,
ranged from H'kd1 cho đến H'kd10, are statically accepted at the significant level of 5%.
4.1.3 Managerial implication:
4.1.3.1 The risk factors, impacted on production process, consist of: (1) fluctuations of market price
(2) production process (3) technology ( both of technical production process and postharvest technology);
(4) weather; (5) pest; (6) working capital; (7) production imbalance; (8) producers’ psychology and
behavior.
4.2.3.2 The risk factors, impacted on o business process, consists of: (1) fluctuations of market price;
(2) business process; (3) market information.; (4) international finance markets; (5) working capital; (6)
international payment currencies and foreign exchange rate; (7) international speculate funds; (8)
international roasted coffee-nut producer; (9) psychology and behavior of businessmen.
4.2 Assessment of practices in coffee production and business: This assessment based on risk factors
highlight their impact on Vietnam’s coffee production and business in practices.
CHAPTER 5: RISK MANAGEMENT SOLUTIONs
19
5.1 Macro solutions:
5.1.1 Macro solutions in coffee production :
5.1.1.1 Solutions to mitigate the impacts of market price fluctuations
5.1.1.2 Solutions to mitigate the impacts of production process
5.1.1.3 Solutions to mitigate the impacts of production technology
5.1.1.4 Solutions to mitigate the impacts of weather
5.1.1.5 Solutions to mitigate the impacts of pest
5.1.1.6 Solutions to mitigate the impacts of working capital
5.1.1.7 Solutions to mitigate the impacts of production imbalance
5.1.1.8 Solutions to mitigate the impacts of producers’ psychology and behavior
5.1.2 Micro solutions in coffee business
5.1.2.1 Solutions to mitigate the impacts of market price fluctuations
5.1.2.2. Solutions to mitigate the impacts of business process
5.1.2.3 Solutions to mitigate the impacts of market information
5.1.2.4 Solutions to mitigate the impacts of international finance markets
5.1.2.5 Solutions to mitigate the impacts of working capital
5.1.2.6 Solutions to mitigate the impacts of international payment currencies and foreign exchange rate
5.1.2.7 Solutions to mitigate the impacts of international speculate funds
5.1.2.8 Solutions to mitigate the impacts of international roasted coffee-nut producers
5.1.2.9 Solutions to mitigate the impacts of producers’ psychology and behavior
5.2 Macro suggestions: (1) Government should pay more intention on building and developing the
coffee future market.; (2) Government should make a long-term master plan regarding to coffee
production area and processing to achieve the sustainable development of this industry; (3) Government
supports providers’ services, related to coffee production business techniques, to producers
and
businessmen. (4) Government has to give incentives to investors in building and developing production
and postharvest production process; (5) Government provide guidelines for development of market
information system to coffee producers and businessmen; (6) Developing training programs, under the
government’s support, is helpful for coffee business; (7) Government focuses on supporting and giving
opportunities for the development of Vietnam’s coffee association.
20
5.3 COMBINED SOLUTIONS: (1) Establish the close relationship among government, scientists,
credit providers, producers, and businessmen to support sustainable development.; (2) Carry out quality
management throughout from production to distribution stage..
CONCLUSION
Findings and contributions
+ Findings: Determine risk factors which impact on coffee production and business performance
in Vietnam..
+ Measurement model: Measurement model take an effect in scanning and removing factors
which have no impact on coffee production and business process.
+ Conceptual framework: Conceptual framework provides a theoretical supplement to risk
theories in explaining the impact of risk factors on coffee production and business process.
Limitation: The lack of respondents ‘perceived measurement scale is limitation of this research.