Climate change, air quality, and human health
Bạn đang xem bản rút gọn của tài liệu. Xem và tải ngay bản đầy đủ của tài liệu tại đây (1.41 MB, 9 trang )
Climate Change, Air Quality, and Human Health
Patrick L. Kinney, ScD
Abstract:
Weather and climate play important roles in determining patterns of air quality over
multiple scales in time and space, owing to the fact that emissions, transport, dilution,
chemical transformation, and eventual deposition of air pollutants all can be influenced by
meteorologic variables such as temperature, humidity, wind speed and direction, and
mixing height. There is growing recognition that development of optimal control
strategies for key pollutants like ozone and fine particles now requires assessment of
potential future climate conditions and their influence on the attainment of air quality
objectives. In addition, other air contaminants of relevance to human health, including
smoke from wildfires and airborne pollens and molds, may be influenced by climate
change. In this study, the focus is on the ways in which health-relevant measures of air
quality, including ozone, particulate matter, and aeroallergens, may be affected by climate
variability and change. The small but growing literature focusing on climate impacts on air
quality, how these influences may play out in future decades, and the implications for
human health is reviewed. Based on the observed and anticipated impacts, adaptation
strategies and research needs are discussed.
(Am J Prev Med 2008;35(5):459 – 467) © 2008 American Journal of Preventive Medicine
Introduction
M
eteorologic variables such as temperature,
humidity, wind speed and direction, and mixing height (the vertical height of mixing in
the atmosphere) play important roles in determining
patterns of air quality over multiple scales in time and
space. These linkages can operate through changes in
air pollution emissions, transport, dilution, chemical
transformation, and eventual deposition of air pollutants. Policies to improve air quality and human health
take meteorologic variables into account in determining when, where, and how to control pollution emissions, usually assuming that weather observed in the
past is a good proxy for weather that will occur in the
future, when control policies are fully implemented.
However, policymakers now face the unprecedented
challenge presented by changing climate baselines.
There is growing recognition that development of
optimal control strategies to control future levels of key
health-relevant pollutants like ozone and fine particles
(particulate matter, PM2.5) should incorporate assessment of potential future climate conditions and their
possible influence on the attainment of air quality
objectives. Given the significant health burdens associated with ambient are pollution, getting the numbers
From the Department of Environmental Health Sciences, Mailman
School of Public Health at Columbia University, New York, New York
Address correspondence and reprint requests to: Patrick L. Kinney,
ScD, Department of Environmental Health Sciences, Mailman School
of Public Health at Columbia University, 60 Haven Avenue, B-1, New
York NY 10032. E-mail:
right is critical for designing policies that maximize
future health protection. Although not regulated as air
pollutants, naturally occurring air contaminants of relevance to human health, including smoke from wildfires and airborne pollens and molds, also may be
influenced by climate change. Thus there are a range
of air contaminants, both anthropogenic and natural,
for which climate change impacts are of potential
interest.
It also should be recognized that anthropogenic emissions of air pollutants of direct health concern are, in
many cases, associated with concurrent emission of pollutants that have important impacts on global climate
(e.g., carbon dioxide, black carbon, sulfur dioxide, and
others). This is particularly the case for combustion of
fossil fuels such as coal and oil. Thus, efforts to mitigate
climate impacts by reduced fossil fuel combustion also will
often result in co-benefits from reduced direct health
impacts of air pollution. This important interaction
among climate, air quality, and health, is addressed elsewhere in this issue,1 and is not discussed further here.
This study focuses on the ways in which healthrelevant measures of air quality, including ozone, PM,
and aeroallergens, may be affected by climate variability
and change. Because many excellent reviews have been
published on the human health impacts of air pollution, those impacts are only briefly summarized here.
Instead, the small but growing literature focusing on
climate impacts on air quality, how these influences
may play out in future decades, and the implications for
human health is reviewed. Based on the observed and
Am J Prev Med 2008;35(5)
© 2008 American Journal of Preventive Medicine • Published by Elsevier Inc.
0749-3797/08/$–see front matter
doi:10.1016/j.amepre.2008.08.025
459
anticipated impacts, adaptation strategies and research
needs are also discussed.
Sources and Health Effects of Ozone, Fine Particles,
and Aeroallergens
that share the property of being less than 2.5m in
aerodynamic diameter. Because of its complex nature,
PM2.5 has complicated origins, including primary particles emitted directly from sources and secondary
particles that form via atmospheric reactions of precursor gases. PM2.5 is emitted in large quantities by combustion of fuels by motor vehicles, furnaces, power
plants, wildfires, and, in arid regions, windblown dust.6
Because of their small size, PM2.5 particles have relatively long atmospheric residence times (on the order
of days) and may be carried long distances from their
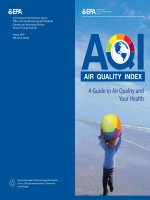
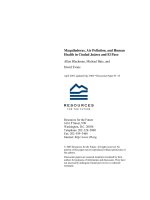
source regions.6,7 Figure 1 is a satellite image showing
long-range transport of smoke over 1000 km (620
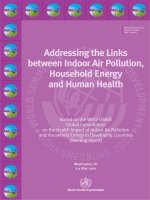
miles) from northern Quebec, Canada, to the city of
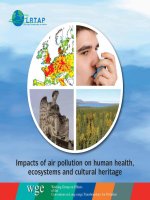
Baltimore MD, on the east coast of the U.S. A corresponding time series of PM2.5 concentrations in Baltimore clearly shows the impact of this event (Figure 2).
Research on health effects in urban areas has demon-
In spite of the substantial successes achieved since the
1970s in improving air quality in the U.S., millions in
this country continue to live in areas that do not meet
the health-based National Ambient Air Quality Standards for ozone and PM2.5 (www.epa.gov/air/criteria.
html). Ozone is formed in the troposphere mainly by
reactions that occur in polluted air in the presence of
sunlight. The key precursor pollutants for ozone formation are nitrogen oxides (emitted mainly by burning
of fuels) and volatile organic compounds (VOCs, emitted both by the burning of fuels and evaporation from
vegetation and stored fuels). Because ozone formation
increases with greater sunlight and higher temperatures, it reaches unhealthy
levels primarily during the
warm half of the year. Daily
peaks occur near midday in
urban areas, and in the afternoon or early evening
in downwind areas. It has
been firmly established that
breathing ozone can cause
inflammation in the deep
lung as well as short-term,
reversible decreases in lung
function. In addition, epidemiologic studies of people
living in polluted areas have
suggested that ozone can increase the risk of asthmarelated hospital visits and
premature mortality.2–5 Vulnerability to ozone effects
on the lungs is greater for
people who spend time outdoors during ozone periods,
especially those who engage
in physical exertion, which
results in a higher cumulative dose to the lungs. Thus,
children, outdoor laborers,
and athletes all may be at
greater risk than people who
spend more time indoors and
who are less active. Asthmatics
are also a potentially vulnerable subgroup.
Fine particulate matter, Figure 1. NASA MODIS satellite image taken July 7, 2002, 10:35 EDT, showing areas of high
PM2.5, is a complex mixture forest fire activity (red dots) and the affected area (Baltimore MD)7
of solid and liquid particles Reprinted with permission from the American Chemical Society.
460
American Journal of Preventive Medicine, Volume 35, Number 5
www.ajpm-online.net
Climate and Air Quality
Percentage (SE)
The influence of meteorology on air quality is substantial and well established,21
giving rise to the expectation that changes in climate
are likely to alter patterns of
air pollution concentrations.
Higher temperatures hasten
the chemical reactions that
lead to ozone and secondary
particle formation. Higher
7
Figure 2. Outdoor PM2.5 concentrations in Baltimore before, during, and after July 7, 2002
temperatures, and perhaps
Reprinted with permission from the American Chemical Society.
elevated carbon dioxide
(CO2) concentrations, also
lead
to increased emissions
strated associations between both short-term and longof ozone-relevant VOC precursors by vegetation.22
term average ambient PM2.5 concentrations and a
Weather patterns influence the movement and dispervariety of adverse health outcomes, including premasion of all pollutants in the atmosphere through the
8 –10
ture deaths related to heart and lung diseases.
In
action of winds, vertical mixing, and rainfall. Air polluaddition, smoke from wildfires has been associated with
tion episodes can occur with atmospheric conditions
increased hospital visits for respiratory problems in
that limit both vertical and horizontal dispersion. For
11–13
affected communities.
example, calm winds and cool air aloft limits disperAirborne allergens (aeroallegens) are substances
sion of traffic emission during morning rush hour in
present in the air that, upon inhalation, stimulate an
winter.
allergic response in sensitized individuals. AeroallerEmissions from power plants increase substantially
gens can be broadly classified into pollens (e.g., from
during heat waves, when air conditioning use peaks.
trees, grasses, and/or weeds); molds (both indoor and
Weekday emissions of nitrogen oxides (NOx) from
outdoor); and a variety of indoor proteins associated
selected power plants in California more than doubled
with dust mites, animal dander, and cockroaches. Polon days when daily maximum temperatures climbed
lens are released by plants at specific times of the year
from 75°F to 95°F in July, August, and September of
that depend to varying degrees on temperature, sun2004.23 Changes in temperature, precipitation, and
light, and moisture. Allergy is assessed in humans either
wind affect windblown dust, as well as the initiation and
by skin prick testing or by a blood test, both of which
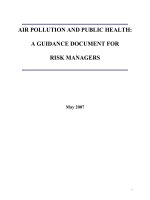
involve assessing reactions to standard allergen preparations. A nationally representative survey of allergen
40
NHANES III
sensitization spanning the years 1988 –1994 found that
Ragweed
NHANES II
35
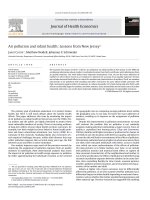
40% of Americans are sensitized to one or more
outdoor allergens, and that prevalence of sensitization
30
had increased compared with data collected in 1976 –
25
1980.14 For example, for these two surveys, Figure 3
plots the percentage of the population sensitized to
20
ragweed pollen as a function of age.
15
Allergic diseases include allergic asthma, hay fever,
10
and atopic dermatitis. More than 50 million Americans
suffer from allergic diseases, costing the U.S. healthcare
5
system over $18 billion annually.15 For reasons that
0
remain unexplained, the prevalence of allergic diseases
6–9 10–19 20–29 30–39 40–49 50–59 60–74
has increased markedly over the past 3– 4 decades.
Asthma is the major chronic disease of childhood,
Age in years
with almost 4.8 million U.S. residents affected. It is
Figure 3. Percentage of the population by age with positive
also the principal cause for school absenteeism and
skin test reactivity to ragweed pollen in NHANES II (dashed
hospitalizations among children.16 Mold and pollen
line) and NHANES III (solid line)14
exposures and home dampness have been associated
NHANES, National Health and Nutrition Examination Survey
with exacerbation of allergy and asthma, as has air
Reprinted with permission from the American Academy of
pollution.17–20
Allergy, Asthma, and Immunology.
November 2008
Am J Prev Med 2008;35(5)
461
movement of forest fires. Finally, the production and distribution of airborne allergens such as pollens and
molds are highly influenced by weather phenomena,
and also have been shown to be sensitive to atmospheric CO2 levels.24 The timing of such phenologic
events such as flowering and pollen release are closely
linked with temperature.
Human-induced climate change is likely to alter the
distributions over both time and space of all the
meterologic factors mentioned. There is little question
that air quality will be influenced by these changes. The
challenge is to understand these influences better and
to quantify the direction and magnitude of resulting air
quality and health impacts.
Potential Climate Influences on Air Pollution:
Findings from Emerging Studies
A variety of methods have been used to study the
influences of climatic factors on air quality, ranging
from relatively simple statistical analyses of empirical
relationships in the historical record to sophisticated
integrated modeling of future air quality resulting from
climate change. Empirical and/or episode modeling
studies have examined influences of temperature and
other meteorologic parameters on concentrations of
ozone and fine particles, the risk of wildfires, pollen,
and, to a lesser extent, mold concentrations. Most
integrated modeling studies to date have focused on
climate effects on ozone concentrations. Some of the
key approaches and findings from this emerging body
of research are reviewed here briefly.
Empirical studies have examined statistical relationships between meteorologic parameters and observed
ozone concentrations, and used these relationships to
infer potential future changes in air quality as climate
changes.25–28 For example, the California Climate
Change Center developed an ozone prediction equation based on ambient temperature and then used this
equation to estimate ozone concentrations for future
time periods using daily temperature outputs for California from a global scale general circulation model.23
Another “historical” approach uses atmospheric models to explore the sensitivity of air pollution levels to
changes in meterologic inputs during known episode
periods in the past.23,29,30 Most such studies have shown
that higher temperatures typically result in higher
simulated ozone concentrations. However, PM2.5 responses are variable.29,31 Another recent study examined the sensitivity of ozone to a range of temperature,
humidity, and other conditions that could occur with
climate change in California.31 Other studies have used
global and/or regional climate models to examine
future distributions of weather patterns known to be
conducive to air pollution episodes, such as stagnating
high pressure systems.32
462
Integrated modeling links air quality simulation
models to climate simulation models to examine potential air quality under alternative scenarios of future
global climate change.33 Although more complex and
computer-intensive than the methods discussed above,
a key advantage of integrated modeling is the ability to
account for the complex influences of climate, emissions, and atmospheric chemistry on air quality patterns, and in particular, to evaluate how air quality
might change under a variety of assumptions regarding
both climate change and emissions of precursor pollutants. Several integrated modeling studies have used
large-scale global chemistry/climate models to examine
how air quality may be influenced by future climate
change over the twenty-first century.34 –36
Hogrefe and colleagues37,38 were the first to report
results of a local-scale analysis of air pollution impacts
of future climate changes using an integrated modeling
approach. In this work, a global climate model was used
to simulate hourly meteorologic data from the 1990s
through the 2080s based on two different greenhouse
gas emissions scenarios, one representing high emissions and the other representing moderate emissions.
The global climate outputs were downscaled to a 36 km
(22 mile) grid over the eastern U.S. using regional
climate and air quality models. When future ozone
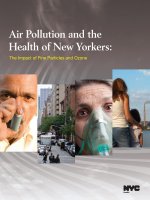
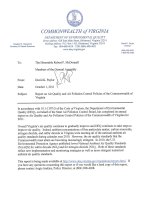
projections were examined, summer-season daily maximum 8-hour concentrations averaged over the modeling domain increased by 2.7, 4.2, and 5.0 parts per
billion (ppb) in the 2020s, 2050s, and 2080s, respectively, as compared to the 1990s, due to climate change
alone (Figure 4). The impact of climate on mean ozone
values was similar in magnitude to the influence of
rising global background ozone by the 2050s, but
climate had a dominant impact on hourly peaks.
Climate change shifted the distribution of ozone
concentrations toward higher values, with larger relative increases in future decades occurring at higher
ozone concentrations. The finding of larger climate
impacts on extreme ozone values was confirmed in a
recent study in Germany39 that compared ozone in the
2030s and the 1990s using a downscaled integrated
modeling system. Daily maximum ozone concentrations increased by 2– 6 ppb (6%–10%) across the study
region. However, the number of cases where daily
maximum ozone exceeded 90 ppb increased by nearly
fourfold, from 99 to 384 (Figure 5).
More recently, the influence of climate change on
PM2.5 and its component species have been examined
using an integrated modeling system.40 Results showed
that PM2.5 concentrations increased with climate
change, but that the effects differed by component
species, with sulfates and primary PM increasing markedly but with organic and nitrated components decreasing, mainly due to movement of these volatile species
from the particulate to the gaseous phase.
American Journal of Preventive Medicine, Volume 35, Number 5
www.ajpm-online.net
Figure 4. Summertime average daily maximum 8-hour ozone concentrations for the 1990s and changes in same for the 2020s,
2050s, and 2080s, based on the IPCC A2 CO2 scenario relative to the 1990s, in ppb. Five consecutive summer seasons were
simulated in each decade.38
IPCC, Intergovernmental Panel on Climate Change; ppb, parts per billion
Reprinted with permission.
As can be seen in the above literature review, the
trend in recent years has been toward increasingly
sophisticated, integrated, policy-relevant regional-scale
modeling studies of the possible future impacts of
climate change on air quality. Most work to date has
focused on ozone, for which reliable models have been
available for some time. The more complex challenge
of modeling climate impacts on fine particle concentrations has only recently been attempted, taking advantage of new chemistry models that include mechanisms related to the formation of PM component
species. Research suggests that urban and regional
ozone concentrations in the U.S. may increase approximately 5%–10% between now and the 2050s as a result
of climate change alone, holding anthropogenic precursor emissions and global background concentrations constant. Relatively smaller changes (2.5%–5%)
November 2008
might be observed by 2030, and larger changes by the
end of the century. It is important to note that trends in
actual ozone concentrations will depend as much or
more on control of precursor emissions as on climate
change. The picture for PM2.5 remains uncertain, with
somewhat conflicting results from the few studies to
date.
Wildfires
Because the risk of wildfire initiation and spread is
enhanced with higher temperatures, decreased soil
moisture, and extended periods of draught, it is possible that climate change could increase the impact of
wildfires in terms of frequency and area affected.41,42
Among the numerous health and economic impacts
brought about by these more frequent and larger fires,
Am J Prev Med 2008;35(5)
463
Figure 5. Left: frequency distribution of the simulated daily ozone maxima averaged over southern Germany during summer
(June–August) for the years 1991–2000 and 2031–2039. Right: a zoom of the high-ozone portion of the curve.39
Reprinted with permission.
increases in fine particulate air pollution are an important concern, both in the immediate vicinity of fires as
well as in areas downwind of the source regions. Several
studies have been published in recent years examining
trends in wildfire frequency and area burned in Canada
and the U.S. Most such studies report upward trends in
the latter half of the twentieth century that are consistent with changes in relevant climatic variables.42– 44
Interpretation of trends in relation to climate change is
complicated by concurrent changes in land cover and
in fire surveillance and control. However, similar trends
were seen in areas not affected by human interference,42 or under consistent levels of surveillance over
the follow-up period.44
How might these trends play out in the future with
continued climate change? Integrated modeling studies have examined fire risk associated with climatic
variables projected under alternative CO2 scenarios,
mainly in Canada. Most studies have projected increases in fire frequency and/or area burned over
future decades in relation to 2x or 3x CO2 growth
scenarios, due to increases in average temperatures,
longer growing seasons, and/or increased aridity.45– 47
For example, Flannigan and colleagues47 projected
74%–118% increases in area burned in different regions of Canada by the end of the present century with
3x CO2, but with considerable variation across different
ecologic regimes. One study projected general reductions in future fire burn rates in Canada, although
some regions showed the opposite trend.48 Authors
suggested that increased precipitation outweighed increased temperatures in regions where fire risk was
projected to be lower. It should be noted that climate
change will interact with changes in land cover, the
frequency of lightning and other initiators, and topography in determining future damage risks to forests.41
Air quality impacts related to projected future wildfires
under a changing climate have yet to be evaluated.
464
Aeroallergens
Aeroallergens that may respond to climate change
include outdoor pollens generated by trees, grasses,
and weeds, and spores released by outdoor or indoor
molds. Because climatologic influences differ for these
different classes of aeroallergens, they are discussed
separately here.
Historical trends in the onset and duration of pollen
seasons have been examined extensively in recent
studies, mainly in Europe. Nearly all species and regions analyzed have shown significant advances in
seasonal onset that are consistent with warming
trends.49 –58 There is more limited evidence for longer
pollen seasons or increases in seasonal pollen loads for
birch55 and Japanese cedar tree pollen.56 Grass pollen
season severity was greater with higher pre-season temperatures and precipitation.59 What remains unknown
is whether and to what extent recent trends in pollen
seasons may be linked with upward trends in allergic
diseases (e.g., hay fever, asthma) that have been seen in
recent decades.
In addition to earlier onset of the pollen season and
possibly enhanced seasonal pollen loads in response to
higher temperatures and resulting longer growing seasons, there is evidence that CO2 rise itself may cause
increases in pollen levels. Experimental studies have
shown that elevated CO2 concentrations stimulate
greater vigor, pollen production, and allergen potency
in ragweed.24,60,61 Ragweed is arguably the most important pollen in the U.S., with up to 75% of hay fever
sufferers sensitized.15 Significant differences in allergenic pollen protein were observed in comparing
plants grown under historical CO2 concentrations of
280 ppb, recent concentrations of 370 ppb, and potential future concentrations of 600 ppb.61 Interestingly,
significant differences in ragweed productivity were
observed in outdoor plots situated in urban, suburban,
American Journal of Preventive Medicine, Volume 35, Number 5
www.ajpm-online.net
and rural locales where measurable gradients were
observed in both CO2 concentrations and temperatures. Cities are not only heat islands but also CO2
islands, and thus to some extent represent proxies for a
future warmer, high-CO2 world.24
With warming over the longer term, changing patterns of plant habitat and species density are likely, with
gradual movement northward of cool-climate species
like maple and birch, as well as northern spruce.62
Although these shifts are likely to result in altered
pollen patterns, to date they have not been assessed
quantitatively.
As compared with pollens, molds have been much
less studied.50 This may reflect in part the relative
paucity of routine mold monitoring data from which
trends might be analyzed, as well as the complex
relationships among climate factors, mold growth,
spore release, and airborne measurements.63 One study
examining the trends in Alternaria spore counts between 1970 and 1998 in Derby England observed
significant changes in seasonal onset, peak concentrations, and season length. These trends parallel gradual
warming observed over that period.
In addition to potential effects on outdoor mold
growth and allergen release related to changing climate
variables, there is also concern about indoor mold
growth in association with rising air moisture and
especially after extreme storms, which can cause widespread indoor moisture problems from flooding and
leaks in the building envelope. Molds need high levels
of surface moisture to become established and flourish.64 In the aftermath of Hurricane Katrina, very
substantial mold problems were noted, causing unknown but likely significant impacts on respiratory
morbidity.65 There is growing evidence for increases in
both the number and intensity of tropical cyclones in
the north Atlantic since 1970, associated with unprecedented warming of sea surface temperatures in that
region.62,66
Taken as a whole, the emerging evidence from
studies looking at historic or potential future impacts of
climate change on aeroallergens led Beggs to state:
[This] suggests that the future aeroallergen characteristics of our environment may change considerably as a result of climate change, with the
potential for more pollen (and mould spores),
more allergenic pollen, an earlier start to the
pollen (and mould spore) season, and changes in
pollen distribution.50
sions can be drawn, the limited available evidence
suggests that climate change is likely to exacerbate
some anthropogenic and naturally occurring pollutants
including ozone, smoke from wildfires, and some pollens. To the extent that such impacts occur where large
numbers of people are exposed, which is more likely to
be the case for ozone and pollen than for smoke from
wildfires, additional adverse health effects can be anticipated. People with existing asthma, allergies, and
other respiratory diseases may be especially vulnerable
to respiratory impacts.
To reduce future air quality impacts of climaterelated trends, more aggressive emissions controls,
both in the U.S. and elsewhere, will be needed to make
progress toward reducing ozone concentrations below
health-based standards. The adaptation measures
needed are the same as those already in place: reduced
emissions of key ozone precursors, especially NOx.
Because the transport sector plays an increasingly
prominent role in urban NOx emissions, efforts to
reduce emissions per mile from motor vehicles should
be a high priority. Substantial gains are possible with
improved fleetwide fuel efficiency. Tightened emissions controls can play a role as well, as can the use of
cleaner, high efficiency fuels such as biofuels. Breakthrough technologies such as electric and fuel cell
vehicles could have significant benefits in the longer
run. In the case of wildfires, maintenance and enhancement of existing surveillance and early response programs will be critical to mitigate the impacts of potentially increased risks caused by climate change.
Air conditioning is an adaptive response to ozone—
reducing indoor exposures compared to those outdoors—
but exacerbates the problem of pollution emissions
from the utility sector. Caution is advised in relying on
air conditioning as a primary adaptive response, in the
absence of a corresponding program to reduce the
resulting emissions from power plants.
In the case of aeroallergens, ensuring complete and
equitable access to available medications will be important, as will stronger education programs directed at
allergen avoidance. Use of innovative air handling and
filtration equipment for reducing the penetration of
outdoor pollens into indoor spaces may also be valuable. Greater awareness of the impacts of indoor moisture on molds and associated respiratory diseases
should provide additional incentive to shift housing
development away from flood-prone areas. There is a
pressing need for improved surveillance of pollen and
mold levels.
Health Implications and Adaptive Responses
The emerging findings from a small but growing body
of literature provides an initial evidence base on which
to assess air quality and associated health implications
of climate variability and change. Although much more
research is needed before firm, quantitative concluNovember 2008
Research Needs
With respect to integrated modeling of future air
quality under a changing climate, there is a need for
greater use of model ensembles that capture the full
range of uncertainties in future impacts. The literature
Am J Prev Med 2008;35(5)
465
to date provides mainly selective analyses of particular
models and scenarios, preventing a comprehensive
quantitative evaluation of central tendencies and variability around the center.
Further advances in climate/air quality modeling
are in progress, taking advantage of the continuing
progress in computer processor speeds. Complex integrated models that took a week to run 5 years ago can
now be run in less than 1 day. These advances will make
it possible to look at finer geographic and temporal
scales, and to begin modeling the two-way “fully coupled” interactions between climate and air quality.
The study of climate influences on pollen, mold, and
other aeroallergens in the U.S. has been extremely
limited to date, due in large part to the lack of routinely
available, consistently monitored data on aeroallergen
levels. An improved surveillance system would begin to
alleviate this constraint. Once the empirical relationships are established, integrated modeling studies
could be used to examine potential future impacts of
climate change.
No financial disclosures were reported by the author of this
paper.
References
1. Younger M, Morrow-Almeida HR, Vindigni SM, Dannenberg AL. The built
environment, climate change, and health: opportunities for co-benefits.
Am J Prev Med 2008;35:517–26.
2. Peel JL, Tolbert PE, Klein M, et al. Ambient air pollution and respiratory
emergency department visits. Epidemiol 2005;16:164 –74.
3. Peel JL, Metzger KB, Klein M, Flanders WD, Mulholland JA, Tolbert PE.
Ambient air pollution and cardiovascular emergency department visits in
potentially sensitive groups. Am J Epidemiol 2007;165:625–33.
4. Kinney PL, Ozkaynak H. Associations of daily mortality and air pollution in
Los Angeles County. Environ Res 1991;54:99 –120.
5. Levy JI, Chemerynski SM, Sarnat JA. Ozone exposure and mortality: an
empiric bayes metaregression analysis. Epidemiology 2005;16:458 – 68.
6. Prospero JM, Lamb PJ. African droughts and dust transport to the
Caribbean: climate change implications. Science 2003;302:1024 –7.
7. Sapkota A, Symons JM, Kleissl J, et al. Impact of the 2002 Canadian forest
fires on particulate matter air quality in Baltimore city. Environ Sci Technol
2005;39:24 –32.
8. Samet J, Zeger S, Dominici F, et al. The national morbidity, mortality, and
air pollution study. Part II: morbidity and mortality from air pollution in
the United States. www.healtheffects.org.
9. Pope CA 3rd, Burnett RT, Thun MJ, et al. Lung cancer, cardiopulmonary
mortality, and long-term exposure to fine particulate air pollution. JAMA
2002;287:1132– 41.
10. Schwartz J. Air pollution and daily mortality: a review and meta-analysis.
Environ Res 1994;4:36 –52.
11. Hoyt KS, Gerhart AE. The San Diego County wildfires: perspectives of
healthcare providers [corrected]. Disaster Manag Response 2004;2:46 –52.
12. Johnston FH, Kavanagh AM, Bowman DM, Scott RK. Exposure to bushfire
smoke and asthma: an ecological study. Med J Aust 2002;176:535– 8.
13. Moore D, Copes R, Fisk R, Joy R, Chan K, Brauer M. Population health
effects of air quality changes due to forest fires in British Columbia in 2003:
estimates from physician billing data. Can J Public Health 2006;97:105– 8.
14. Arbes SJ Jr, Gergen PJ, Elliott L, Zeldin DC. Prevalences of positive skin test
responses to 10 common allergens in the US population: results from the
third National Health and Nutrition Examination Survey. J Allergy Clin
Immunol 2005;116:377– 83.
15. American Academy of Allergy, Asthma and Immunology. The allergy
report: Vol. 1. Science based findings on the diagnosis and treatment of
allergic disorders. Milwaukee WI: AAAAI, 2000.
466
16. O’Connell EJ. The burden of atopy and asthma in children. Allergy
2004;59(78S):7–11.
17. Gilmour MI, Jaakkola MS, London SJ, Nel AE, Rogers CA. How exposure
to environmental tobacco smoke, outdoor air pollutants, and increased
pollen burdens influences the incidence of asthma. Environ Health
Perspect 2006;114:627–33.
18. IOM. Clearing the air: asthma and indoor air exposures. Washington DC:
National Academies Press, 2000.
19. IOM. Damp indoor spaces and health. Washington DC: National Academies Press, 2004.
20. Jaakkola MS, Jaakkola JJK. Indoor molds and asthma in adults. Adv Appl
Microbiol 2004;55:309 –38.
21. Jacob DJ. Interactions of climate change and air quality: research priorities
and new direction. Report from a workshop, April 26 –27, 2005, Washington DC: Electric Power Research Institute.
22. Hogrefe C, Leung R, Mickley L, Hunt S, Winner D. Considering climate
change in air quality management. Environ Manager 2005:19 –23.
23. Drechsler DM, Motallebi N, Kleeman M, et al. Public health-related impacts
of climate change in California. White paper, 2006.
24. Ziska LH, Gebhard DE, Frenz DA, Faulkner S, Singer BD, Straka JG. Cities
as harbingers of climate change: common ragweed, urbanization, and
public health. J Allergy Clin Immunol 2003;111:290 –5.
25. Gaza R. Mesoscale meteorology and high ozone in the Northeast United
States. Environ Manage 1998;37:961–77.
26. Vukovich F. Regional-scale boundary layer ozone variations in the eastern
United States and their association with meteorological variations. Atmos
Environ 1995;29:2259 –73.
27. Lin, Jacob D, Fiore A. Trends in exceedances of the ozone air quality
standard in the continental United States, 1980 –1998. Atmos Environ
2001;35:3217–28.
28. Ordóñez C, Mathis H, Furger M, et al. Changes of daily surface ozone
maxima in Switzerland in all seasons from 1992 to 2002 and discussion of
summer 2003. Atmos Chem Phys 2005;5:1187–203.
29. Aw J, Kleeman M. Evaluating the first-order effect of intraannual temperature variability on urban air pollution. J Geophys Res 2003;108(D12):4365.
30. Bell M, Ellis H. Sensitivity analysis of tropospheric ozone to modified
biogenic emissions for the Mid-Atlantic region. Atmos Environ
2004;38:1879 – 89.
31. Steiner A, Tonse S, Cohen R, Goldstein A, Harley R. Influence of future
climate and emissions on regional air quality in California. J Geophys Res
2006;111:D18303.
32. Leung R, Gustafson W. Potential regional climate change and implications
to US air quality. Geophys Res Lett 2005;32:L16711.
33. Kinney PL, Rosenthal J, Rosenzweig C, et al. Assessing the potential public
health impacts of changing climate and land use: NY climate & health
project. In: Ruth M, Donaghy K, Kirshen P, eds. Climate change and
variability: impacts and responses. Cheltenham UK: Edward Elgar, 2006.
34. Mickley LJ, Jacob DJ, Field BD, Rind D. Effects of future climate change on
regional air pollution episodes in the United States. Geophys Res Lett
2004;31:L24103.
35. Murazaki K, Hess P. How does climate change contribute to surface ozone
change over the United States? J Geophys Res 2006;111:D05301.
36. Unger N, Shindell D, Koch D, Amann M, Cofala J, Streets D. Influences of
man-made emissions and climate changes on tropospheric ozone, methane, and sulfate at 2030 from a broad range of possible futures. J Geophys
Res 2006;111:D12313.
37. Hogrefe C, Biswas J, Lynn B, et al. Simulating regional-scale ozone
climatology over the eastern United States: model evaluation results. Atmos
Environ 2004;38:2627–38.
38. Hogrefe C, Lynn B, Civerolo K, et al. Simulating changes in regional air
pollution over the eastern United States due to changes in global and
regional climate and emissions. J Geophys Res 2004;109:D22301.
39. Forkel R, Knoche R. Regional climate change and its impact on photooxidant concentrations in southern Germany: simulations with a coupled
regional climate-chemistry model. J Geophys Res 2006;111:D12302.
40. Hogrefe C, Werth D, Avissar R, et al. Analyzing the impacts of climate
change on ozone and particulate matter with tracer species, process
analysis, and multiple regional climate scenarios. In: Borrego C, Renner E,
eds. Air pollution modeling and its application XVIII: 28th NATO/CCMS
international technical meeting on air pollution modeling and its application, May 15–19, 2006. Leipzig Germany: Elsevier, 2006.
41. Easterling WE, Aggarwal PK, Batima P, et al. Food, fibre, and forest
products. In: Parry ML, Canziani OF, Palutikof JP, van der Linden PJ,
Hanson CE, eds. Climate change 2007: impacts, adaptation and vulnerability. Contribution of Working Group II to the Fourth Assessment Report
American Journal of Preventive Medicine, Volume 35, Number 5
www.ajpm-online.net
42.
43.
44.
45.
46.
47.
48.
49.
50.
51.
52.
53.
54.
of the Intergovernmental Panel on Climate Change. Cambridge UK:
Cambridge University Press, 2007. www.ipcc.ch/pdf/assessment-report/
ar4/wg2/ar4-wg2-chapter5.pdf.
Westerling AL, Hidalgo HG, Cayan DR, Swetnam TW. Warming and earlier
spring increase western US forest wildfire activity. Science 2006;
313:940 –3.
Gillett NP, Weaver AJ, Zwiers FW, Flannigan MD. Detecting the effect of
climate change on Canadian forest fires. Geophys Res Lett 2004;31:L18211.
Podur J, Martell DL, Knight K. Statistical quality control analysis of forest
fire activity in Canada. Can J For Res 2002;32:195–205.
Lemmen DS, Warren FJ. Climate change impacts and adaptation: a
Canadian perspective. Ottawa: Climate Change Impacts and Adaptation
Directorate, 2004.
Williams AAJ, Karoly DJ, Tapper N. The sensitivity of Australian fire danger
to climate change. Clim Change 2001;49:171–91.
Flannigan MD, Logan KA, Amiro BD, Skinner WR, Stocks BJ. Future area
burned in Canada. Clim Change 2005;72:1–16.
Bergeron YM, Flannigan M, Gauthier S, Leduc A, Lefort P. Past, current
and future fire frequency in the Canadian boreal forest: implications for
sustainable forest management. Ambio 2004;6:356 – 60.
Root TL, Price JT, Hall KR, Schneider SH, Rosenzweig C, Pounds JA.
Fingerprints of global warming on wild animals and plants. Nature
2003;421:57– 60.
Beggs PJ. Impacts of climate change on aeroallergens: past and future. Clin
Exp Allergy 2004;34:1507–13.
Beggs PJ, Bambrick HJ. Is the global rise of asthma an early impact of
anthropogenic climate change? Environ Health Perspect 2005;113:915–9.
Clot B. Trends in airborne pollen: An overview of 21 years of data in
Neuchâtel (Switzerland). Aerobiologia 2003;19:227–34.
Emberlin J, Detandt M, Gehrig R, Jaeger S, Nolard N, Rantio-Lehtimaki A.
Responses in the start of Betula (birch) pollen seasons to recent changes in
spring temperatures across Europe. Int J Biometeorol 2002;46:159 –70.
Galan C, Garcia-Mozo H, Vazquez L, Ruiz L, de la Guardia CD, Trigo MM.
Heat requirement for the onset of the Olea europaea L. pollen season in
several sites in Andalusia and the effect of the expected future climate
change. Int J Biometeorol 2005;49:184 – 8.
55. Rasmussen A. The effects of climate change on the birch pollen season in
Denmark. Aerobiologia 2002;18:253– 65.
56. Teranishi J, Kenda Y, Katoh T, Kasuya M, Oura E, Taira H. Possible role of
climate change in the pollen scatter of Japanese cedar Cryptomeria
japonica in Japan. Clim Res 2000;14:65–70.
57. van Vliet AJH, Overeem A, DeGroot RS, Jacobs AFG, Spieksma FTM. The
influence of temperature and climate change on the timing of pollen
release in the Netherlands. Int J Climatology 2002;22:1757– 67.
58. WHO. Phenology and human health: allergic disorders. Report on a WHO
meeting, Rome. Rome: WHO, 2003.
59. Gonzalez Minero FJ, Candau P, Tomas C, Morales J. Airborne grass
(Poaceae) pollen in southern Spain. Results of a 10-year study (1987–96).
Allergy 1998;53:266 –74.
60. Ziska LH, Caufield FA. Rising carbon dioxide and pollen production of
common ragweed, a known allergy-inducing species: implications for
public health. Aust J Plant Physiol 2000;27:893– 8.
61. Singer BD, Ziska LH, Frenz DA, Gebhard DE, Straka JG. Increasing Amb a
1 content in common ragweed (Ambrosia artemisiifolia) pollen as a
function of rising atmospheric CO2 concentration. Funct Plant Biol
2005;32:667–70.
62. Rosenzweig C, Casassa G, Karoly DJ, et al. Assessment of observed changes
and responses in natural and managed systems. In: Parry ML, Canziani OF,
Palutikof JP, van der Linden PJ, Hanson CE, eds. Climate change 2007:
impacts, adaptation and vulnerability. Contribution of Working Group II to
the Fourth Assessment Report of the Intergovernmental Panel on Climate
Change. Cambridge UK: Cambridge University Press, 2007. www.ipcc.ch/
pdf/assessment-report/ar4/wg2/ar4-wg2-chapter1.pdf.
63. Katial RK, Zhang Y, Jones RH, Dyer PD. Atmospheric mold spore counts
in relation to meteorological parameters. Int J Biometeorol 1997;41:17–22.
64. Burge HA. An update on pollen and fungal spore aerobiology. J Allergy
Clin Immunol 2002;110:544 –52.
65. Ratard Rea. Health concerns associated with mold in water-damaged
homes after hurricanes Katrina and Rita—New Orleans LA, October 2005.
MMWR 2006;55:41– 4.
66. Emanuel K. Increasing destructiveness of tropical cyclones over the past 30
years. Nature 2005;436:686 – 8.
Did you know?
You can stay updated on key articles with saved searches and table of content e-mail
alerts.
Visit www.ajpm-online.net today to see what else is new online!
November 2008
Am J Prev Med 2008;35(5)
467