Air Pollution and the Health of New Yorkers: The Impact of Fine Particles and Ozone pot
Bạn đang xem bản rút gọn của tài liệu. Xem và tải ngay bản đầy đủ của tài liệu tại đây (3.27 MB, 40 trang )
Air Pollution and the
Health of New Yorkers:
The Impact of Fine Particles and Ozone
Contributors
Iyad Kheirbek, Katherine Wheeler, Sarah Walters, Grant Pezeshki, Daniel Kass
New York City Department of Health and Mental Hygiene
Science Advisor
Thomas Matte
City University of New York School of Public Health at Hunter College
Editor
Lise Millay Stevens
New York City Department of Health and Mental Hygiene
Acknowledgements
This report was supported by a grant to the New York City Department of Health and Mental Hygiene from the
National Center for Environmental Health, Centers for Disease Control and Prevention. We are grateful to the CDC’s
Environmental Public Health Tracking Program for its support of health impact assessment research. The authors
also thank Neal Fann, U.S. Environmental Protection Agency, and Kazuhiko Ito, New York University School of
Medicine, for their review and comments on this report.
Table of Contents
Executive Summary 3
Introduction and Background 5
Sources and Health Effects of Fine Particulates and Ozone 6
Studies of Air Pollution and Population Health 8
Methods 9
Overall Approach 9
Data Sources 9
Concentration-response functions 9
Particulate matter studies 10
Ozone studies 11
Air Quality Data 12
Particulate Matter 12
Ozone 13
Baseline Population and Health Data 13
Results 15
Particulate Matter Health Impacts 15
Mortality 16
Hospital admissions for respiratory disease 18
Hospital admissions for cardiovascular disease 20
Emergency department visits for asthma in children 22
Emergency department visits for asthma in adults 23
Ozone Health Impacts 25
Mortality 26
Hospital admissions and emergency department visits
for asthma in children 28
Hospital admissions and emergency department visits
for asthma in adults 31
Limitations 34
Discussion 36
References 37
3 I Air Pollution and the Health of New Yorkers: The Impact of Fine Particles and Ozone
Executive Summary
Air pollution is a leading environmental threat
to the health of urban populations overall and
specifically to New York City residents. Clean
air laws and regulations have improved the air
quality in New York and most other large cities, but
several pollutants in the city’s air are at levels that
are harmful.
This report provides estimates of the toll of air
pollution on the health of New Yorkers. It focuses
on 2 common air pollutants—fine particulate
matter (PM
2.5
) and ozone (O
3
). Emissions from
fuel combustion directly and indirectly cause many
cities to have high concentrations of these
pollutants. Both have been extensively researched
and are known to contribute to serious illnesses
and death, especially from lung and heart
diseases, at concentrations prevailing in New York
City today.
Air pollution, like other significant risk factors
for poor health such as smoking and obesity,
is rarely indicated as the cause of an individual
hospital admission or death in official records.
Statistical methods, therefore, must be used to
apply research findings about the relationship
between exposures and the risk of illnesses and
death to actual population rates of morbidity and
mortality to calculate estimates of the public
health burden caused by air pollution. In this
report, the New York City Department of Health
and Mental Hygiene used methods developed
by the U.S. Environmental Protection Agency
to estimate the impact of air pollution on the
numbers of deaths, hospital admissions and
emergency department visits caused by exposure
to PM
2.5
and ozone at current concentrations in
New York City.
Health Department estimates show that each year,
PM
2.5
pollution in New York City causes more than
3,000 deaths, 2,000 hospital admissions for lung
and heart conditions, and approximately 6,000
emergency department visits for asthma in
children and adults. A modest reduction of 10%
in current PM
2.5
levels could prevent more than
300 premature deaths, 200 hospital admissions
and 600 emergency department visits annually,
while attaining the goal of “cleanest air of any big
city” would result in even greater public health
benefits (Table 1).
Table 1. Health impacts from current PM
2.5
exposure and benefits of reducing exposure in New York City.*
PM
2.5
=particulate matter
* Based on 2005-2007 data on air pollution, mortality and illnesses
Health Effect Age Groups Annual Health Events Annual Health Events Annual Health Events Avoided
Affected Attributable to Avoided If PM
2.5
Levels
If PM
2.5
Levels Were Reduced
(in years) Current PM
2.5
Levels Were Reduced by 10% to Cleanest Air of Any Large City
Premature mortality 30 and above 3,200 350 760
Hospital admissions 20 and above 1,200 130 280
for respiratory
conditions
Hospital admissions 40 and above 920 100 220
for cardiovascular
conditions
Emergency Under 18 2,400 270 580
department visits
for asthma
Emergency 18 and above 3,600 390 850
department visits
for asthma
Ozone causes an estimated 400 deaths from all
causes, more than 800 hospital admissions and
more than 4,000 emergency department visits
among children and adults. Reducing ozone levels
by 10% could prevent more than 80 premature
deaths, 180 hospital admissions and 950 emer-
gency department visits annually (Table 2).
Other Health Department estimates show that the
public health impacts of air pollution in New York
City fall especially heavily on seniors, children
with asthma and people living in low-income
neighborhoods. Even modest reductions in the
levels of these pollutants could prevent hundreds
of deaths, hospital admissions and emergency
department visits (Tables 1 and 2).
This study shows that despite improvements in air
quality, air pollution is one of the most significant
environmental threats to New Yorkers, contributing
to approximately 6% of deaths annually. To reduce
this toll, action is needed to address important
local pollution sources; PlaNYC
, the city’s sus-
tainability plan, has already launched, completed
and planned several emission-reducing initiatives
that will result in cleaner air and fewer serious
illnesses and premature deaths in all parts of
the city.
Table 2. Health impacts from current O
3i
exposure and benefits of
reducing exposure in New York City.*
O
3
=ozone
* Based on 2005-2007 data on air pollution, mortality and illnesses
Health Effect Age Groups Annual Health Events Annual Health Events
Affected Attributable to Avoided If O
3
Levels
(in years) Current O
3
Levels Were Reduced by 10%
Premature mortality All ages 400 80
Hospital admissions Under18 420 90
for asthma
Hospital admissions 18 and above 450 90
for asthma
Emergency Under18 1,800 370
department visits
for asthma
Emergency 18 and older 2,900 600
department visits
for asthma
Air Pollution and the Health of New Yorkers: The Impact of Fine Particles and Ozone I 4
5 I Air Pollution and the Health of New Yorkers: The Impact of Fine Particles and Ozone
Introduction and Background
Air pollution is one of the most serious
environmental threats to urban populations
(Cohen 2005). Exposures vary among and within
urban areas, but all people living in cities are
exposed, and many are harmed, by current levels
of pollutants in many large cities. Infants, young
children, seniors and people who have lung
and heart conditions are especially affected, but
even young, healthy adults are not immune to
harm from poor air quality. Exposures to common
urban air pollutants have been linked to a
wide range of adverse health outcomes, including
respiratory and cardiovascular diseases, asthma
exacerbation, reduced lung function and
premature death (U.S. Environmental Protection
Agency 2006, 2009).
Prior to the advent of clean air laws in developed
countries, the lethal effects of air contaminants
from fuel combustion were dramatically evident
during several severe air pollution episodes.
In 1952, shortly after the 5-day London “Great
Smog” episode, for example, it became clear
to officials and the public that thousands had
died and many tens of thousands were sickened
by soot and sulfur dioxide (Davis 2002, Bell 2001).
The episode was caused by burning coal,
petroleum-based fuels and gas with no control on
emissions, in combination with stagnant weather
conditions. The extremely high levels of pollution
caused large and marked increases in the number
of daily deaths and illnesses from lung and heart
disease, evident despite the lack of sophisticated
statistical analyses.
Other severe air pollution episodes, such as in
1948 in Donora, Pennsylvania, (Helfand, 2001)
in the 1950s and in the 1960s in New York City
(McCarroll, 1966) and elsewhere, raised aware-
ness that unregulated burning of fossil fuels in
and near cities was harmful to public health.
Eventually, state, local and, finally, federal laws
and regulations such as The Clean Air Act
began
to turn the tide in controlling emissions.
Because of improvements in air quality, such
deadly air pollution episodes are rare in U.S. cities.
Modern research methods have shown, however,
that deaths and serious illnesses from common
air pollutants still occur at levels well below
regulatory standards, and at current levels in
New York and most large cities. Local actions to
further reduce air pollution will mean changes in
policies and behaviors, and will require significant
investments in new vehicles and other equipment.
Local officials and the public, therefore, must
understand the magnitude and distribution of
mortality and disease caused by air pollution in
order to weigh the benefits against the cost of
improving air quality.
This report provides estimates of the toll that
air pollution takes on the health of New Yorkers,
focusing on 2 common air pollutants—fine
particulate matter (PM
2.5
) and ozone (O
3
). Both
pollutants are among the most studied of
environmental hazards, are found in New York
City’s air at concentrations above clean air
standards, and are known to adversely affect
health at levels in our air today (Silverman 2010,
Ito 2010). The report contains estimates of the
number of emergency department visits, hospital-
izations and deaths attributable to these pollutants
overall and for various population groups, and the
number of adverse health events that could be
prevented by improvements in air quality.
The estimates in this report are based on methods
used by the U.S. Environmental Protection Agency
to quantify the harm from air pollution and the
benefits of clean air regulations. Similar methods
are used to estimate the health impacts of
smoking, obesity, heat waves and other important
public health risks (U.S.
Environmental Protection
Agency, 2010, Centers for Disease Control and
Prevention, Danaei 2009).
Sources and Health Effects of
Fine Particulates and Ozone
Fine Particles (PM
2.5
) are small, airborne particles
with a diameter of 2.5 micrometers or less. Major
sources of PM
2.5
include on-road vehicles (trucks,
buses and cars); fossil fuel combustion for
generating electric power and heating residential
and commercial buildings; off-road vehicles (such
as construction equipment); and commercial
cooking (U.S. Environmental Protection Agency,
National Emissions Inventory). Fine particles can
also become airborne from mechanical processes
such as construction or demolition, industrial
metal fabrication, or when traffic or wind stirs up
road dust.
Fine particles in New York City’s air come from
sources both within and outside of the city; the
outside sources account for more of the city’s
air pollution, but local sources account for
differences in PM
2.5
concentration between
locations within the city. The Health Department,
in the ongoing New York City Community Air
Survey (NYCCAS
), is studying the impact of local
sources (such as traffic and burning residual oil)
on neighborhood air quality.
PM
2.5
is small enough to be inhaled deep into
the lungs and affects both respiratory and
cardiovascular system functions. Changes
observed in people exposed to PM
2.5
include
increased airway inflammation and sensitivity,
decreased lung function, changes in heart
rhythm and blood flow, increased blood pressure,
increases in the tendency to form blood clots,
and biological markers of inflammation (U.S.
Environmental Protection Agency 2009). These
health effects cause increases in symptoms,
emergency department visits, hospital admissions
and deaths from heart and lung diseases (Bell
2009, Krewski 2009, Silverman 2010).
Studies show that, even at current levels, short-
term exposures to combustion-related pollutants
exacerbate respiratory and cardiovascular
conditions, and increase mortality risk. Higher,
long-term average concentrations increase the
cumulative risk of chronic diseases and death.
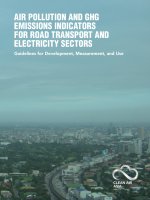
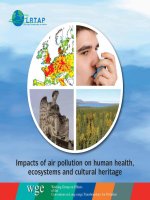
One recent study (Pope 2009) showed that in
cities with higher average PM
2.5
, the population’s
life expectancy was reduced by an average of
more than half of a year for every 10 µg/m
3
increase in concentration (Figure 1). Data from the
study also showead that reductions in PM
2.5
concentrations during the 1980s and 1990s
accounted for approximately 15% of the overall
increase in life expectancy during that period.
O
3
is not emitted directly from fuel combustion;
it is produced by chemical reactions involving
nitrogen oxides (NO
x
)—a mixture including nitric
oxide (NO) and nitrogen dioxide (NO
2
)—volatile
organic compounds and sunlight. O
3
concentra-
tions typically peak in the afternoon and are
highest in the summer, when daylight hours are
long and temperatures are high. Although NO
x
Air Pollution and the Health of New Yorkers: The Impact of Fine Particles and Ozone I 6
PM
2.5
=particulate matter
* Dots represent population-weighted mean life expectancies at the county level and circles labeled with numbers
represent population-weighted mean life expectancies at the metropolitan-area level. Solid lines represent
regression lines with the use of county-level observations, and broken lines represent regression lines with the
use of county-level and metropolitan area-level observations.
§
Reprinted from Fine-Particulate Air Pollution and Life Expectancy in the United States, N Engl J Med. 2009;360:376-386.
C. Arden Pope II, Majid Ezzati and Douglas W. Dockery with Permission from the New England Journal of Medicine.
PM
2.5
1999-2000 (µg/m
3
)
1
2
3
4
5
6
7
8
9
10
11
12
13
14
15
16
17
18
19
20
21
23
22
24
26
25
27
28
29
30
31
32
33
34
35
37
41
38
40
39
36
42
43
44
45
46
47
48
49
50
51
82
Life expectancy, 1997– 2001 (years)
80
76
74
70
78
72
0
0
5 10 15 20 25
30
Figure 1. Lower life expectancy is associated with living
in cities with higher PM
2.5
levels.*
§
7 I Air Pollution and the Health of New Yorkers: The Impact of Fine Particles and Ozone
emissions from vehicles contribute to higher
ozone in urban areas, in city locations where fresh
NO
x
emissions are concentrated, NO reacts with,
and removes, ozone from the atmosphere in a
reaction known as ozone “scavenging.” As a
result, concentrations in urban areas with an
abundance of NO
x
from traffic sources tend to
have somewhat lower concentrations of ozone
than more suburban locations downwind from the
city center.
O
3
reacts with and damages organic matter such
as plant foliage, the human airway and other lung
tissues. Exposure to O
3
causes irritation and
inflammation of the lungs, and leads to coughing,
wheezing, worsening of asthma and lowered
resistance to lung infections. Physical activity
during peak ozone periods increases exposure
and the likelihood of symptoms. Long-term
exposure to higher O
3
levels can permanently
reduce lung function. (Calderón-Garcidueñas
2003, Rojas-Martinez 2007) These health effects
of O
3
contribute to increased emergency depart-
ment visits, hospital admissions and deaths on
days with higher ozone concentrations (Silverman
2010, Ito 2007, Huang 2005), and to increased
mortality associated with chronic ozone exposure
(Jerrett 2009).
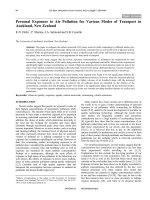
Studies have shown that for both PM
2.5
and O
3
exposure, health effects occur at concentrations
well below the current National Ambient Air
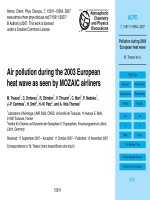
Quality Standards; this effect was clear in a study
of asthma hospitalizations in New York City
Figure 2. The risk of hospitalization for asthma increases with increases in
daily levels of PM
2.5
and O
3
in New York City.
PM
2.5
PM
2.5
: All ages
Relative risk
PM
2.5
=particulate matter
O
3
=ozone
* NAAQS- National Ambient Air Quality Standard
The figure shows at levels below and above the National Ambient Air Quality Standard (NAAQS) an increasing risk of hospitalization for asthma with increasing PM
2.5
and O
3
levels. The
solid lines are smoothed fit data, with long broken lines indicating 95% confidence bands. The short broken lines are linear fitted lines. The vertical dotted lines are the current NAAQS
for PM
2.5
and the 1997 NAAQS for O
3
(current 2007 O
3
NAAQS is 75ppb). The density of lines at the bottom of the figure indicates the number of days measured at a given concentration
sample size.
Reprinted from Permission from Elsivier: Silverman RA, Ito K. Age-Related Associations of Fine Particles and Ozone with Sever Acute Asthma in New York City. J Allergy Clin Immunol.
2010; 125(2):367-373
O
3
0
3
: All ages
Relative risk
1.4
1.2
1.0
1.6
1.8
10 20 30 40
NAAQS*
50 60
1.1
1.0
0.9
1.2
1.3
20 40 60
NAAQS*
80 100
(Figure 2) (Silverman 2010). Elderly people,
children and infants, and people with lung or heart
disease are most affected by exposure to both
pollutants. There is evidence that medications
used to manage lung or heart disease may reduce
the severity of health effects caused by air
pollution (Liu 2009, Qian 2009). As a result,
populations and neighborhoods with higher rates
of chronic disease and less access to quality
health care may be more affected by air pollution-
related health problems.
Studies of Air Pollution and Population
Health
Illnesses caused by air pollution, such as asthma
attacks, heart attacks and stroke, have multiple
causes; as a result, most health events triggered
by air pollution cannot be identified directly.
Research, however, has shown that there is an
increase in these events on days with higher air
pollution concentrations and in cities where
pollution concentrations are higher on average.
There are 2 types of studies (see below) that
researchers use to quantify the relationship
between the concentrations of pollutants meas-
ured in the air and the risk of adverse health
effects in the population. The report uses the
results from both types of studies to estimate
air pollution health impacts in New York City.
One type of study assesses the acute effects of
short-term exposures to a specific air pollutant.
These studies use statistical methods for analyzing
time-series data to assess whether the health
events under study, such as daily emergency
department visits for asthma, are more frequent
on or shortly after days when air pollution con-
centrations are higher. These models also control
for other factors that vary with time and can influ-
ence health events, such as the season, weather
and day of the week. The daily risk of a particular
health event is related to the daily concentration of
a pollutant as a so-called concentration-response
function. In Figure 2, for example, researchers
analyzed daily hospitalizations for asthma using
time series models. The estimates showed that,
for a daily (8-hour maximum) ozone concentration
increase of 22 parts per billion during the warm
season (April through August), asthma hospital
admissions among children 6 to 18 years of
age increased an average of 20% (Silverman
2010). Due to random variation in daily counts of
any health event, estimating an acute effect
concentration-response function reliably requires
analyzing a large amount of data (usually over
several years).
Another type of study assesses the health effects
of chronic (long-term) exposure to air pollution.
This type of study may involve following a study
population over time and comparing the risk of
health events among individuals living in multiple
cities with different average levels of air pollution.
In chronic effect studies, the statistical analyses
may be used to also adjust for individual factors
such as smoking and weight. The amount of
increase in risk is related to a given change
in average air pollution concentration to esti-
mate a chronic exposure concentration-response
function.
Air Pollution and the Health of New Yorkers: The Impact of Fine Particles and Ozone I 8
9 I Air Pollution and the Health of New Yorkers: The Impact of Fine Particles and Ozone
Methods
Overall Approach
In this report, methods were adapted from those
utilized by the U.S. Environmental Protection
Agency and state air quality regulatory agencies
to estimate changes in the number of illnesses
and deaths that could occur in a population if
air pollution concentrations were reduced by a
specified amount (U.S. Environmental Protection
Agency 2010, 2008) (Figure 3). This method:
Uses air quality monitoring data to characterize
current, or baseline, air pollution levels
Specifies comparison air quality conditions,
such as possible reductions in air pollution
concentrations or levels that meet other air
quality goals
Computes the hypothetical change in air
pollution concentrations as the difference
between the current and the comparison
levels within each neighborhood
Uses the change in air pollution concentrations,
concentration-response functions from the
epidemiological literature, and local population
and baseline health event rates to calculate
the health impact associated with the change
in ambient air quality, by neighborhood.
Combines these neighborhood health impacts
to estimate citywide impacts
This health impact analysis was conducted using
U.S. Environmental Protection Agency’s Benefits
Mapping and Analysis Program (BenMAP), a
Geographic Information System-based program
that allows analysts to systematically calculate
health impacts across regions of interests.
Data Sources
Concentration-Response Functions
Recent epidemiological studies of the relationship
of PM
2.5
and O
3
to mortality, hospital admissions
and emergency department visits were reviewed.
Although hundreds of studies have been
published on the health effects of PM
2.5
and O
3
,
studies used for the main analyses were those
most relevant to the current New York City
population.
Figure 3. Flow chart illustrating the Air Pollution Health Impact Analysis Approach.
Concentration-response
function derived from
relative risk reported
in epidemiological studies
Air-Quality Related
Health Impacts
Air Quality Monitors
Change in Air Quality
Current Air Quality
Comparison Air Quality
Effect Estimate:
Baseline Health
Incidence Rates
Population Data
Air Pollution and the Health of New Yorkers: The Impact of Fine Particles and Ozone I 10
Table 3. PM
2.5
effect estimates used in this report.
Health Effect Age Group Acute or Chronic Effect Study Source of
(in years) Exposure/Metric Average Estimate Location Effect Estimate
Premature 30 and Chronic/Annual 6% increase in all-cause United States Krewski, 2009
mortality older mortality associated with (116 cities)
10 µg/m
3
increase in PM
2.5
Emergency All ages Acute/Daily Relative risk of 1.23 New York City Ito, 2007
department 24-hour (summer) and 1.04 (winter)
visits for asthma per 25.4 µg/m
3
and 21.7 µg/m
3
respective increase in PM
2.5
Hospital admissions 40 and Acute/Daily 0.8% (warm season) and New York City Ito, 2010
for all cardiovascular older 24-hour 1.1% (cold season) increase
causes in daily cardiovascular
disease hospitalizations per
10 µg/m
3
increase in PM
2.5
Hospital admissions 20-64 Acute/Daily 2.2% increase in daily Los Angeles Moolgavkar,
for all respiratory 24-hour chronic respiratory disease 2000
causes hospitalizations per 10 µg/m
3
increase in PM
2.5
65 and Acute/Daily 1.3%-4.3% increase in daily 26 U.S. Zanobetti,
older 24-hour chronic respiratory disease communities 2009
admissions with 10 µg/m
3
increase per PM
2.5
(depending on season)
PM
2.5
PM
2.5
=particulate matter
The studies used in this report were taken from
peer-reviewed scientific journals in the past
decade and, to account for local study area
demographics and pollutants, effect estimates
from studies of New York City were used when
possible. If local studies were not available, those
used contained effect estimates from recent large,
multi-city studies or those included in recent U.S.
Environmental Protection Agency regulatory im-
pact analyses (EPA 2008, EPA 2010). The studies
chosen, and the corresponding concentration-
response functions used for this report, are
summarized below and in Tables 3 and 4. The
abstracts are available in an online appendix
,
which also provides health impact estimates from
other studies not included in this report. The
Discussion section in this report details variables
and limitations in selecting suitable concentration-
response functions.
Particulate Matter Studies
One study (Krewski, 2009) followed 500,000
members of the American Cancer Society in 116
cities who participated in a cohort study from
1982 through 2000. The risk of death among the
cohort was estimated in relation to the city’s
annual average PM
2.5
concentrations; all-cause
mortality rates in adults increased by 6% for every
10 µg/m
3
increase in annual PM
2.5
.
Another study (Ito, 2007) studied daily hospital
emergency department visits for asthma in people
of all ages treated at public hospitals in New
York City from 1999 through 2002. To allow for
different effects of PM
2.5
related to physical
activity and particle composition in different
seasons, separate analyses were completed for
the warm and cold seasons. In the warm season,
emergency department visits increased by 23%,
11 I Air Pollution and the Health of New Yorkers: The Impact of Fine Particles and Ozone
on average, for each 25.4 µg/m
3
increase in daily
PM
2.5
; in the cold season, the increase was 4%
per 21.7 µg/m
3
. Similar methods were applied to
emergency hospitalizations for cardiovascular
health events (Ito, 2010) in New York City among
adults aged 40 years of age and older, using
hospital discharge data from the New York
Statewide Planning and Research Cooperative
System, which includes all New York City
hospitals. The results showed, per 10 μg/m
3
increase in average daily PM
2.5
concentrations, a
0.8% increase in cardiovascular hospitalizations
in the warm season and a 1% increase in the cold
season.
A study from Los Angeles County of adults 20
to 65 years of age (Moolgavkar, 2000) was
used to analyze respiratory hospital admissions
associated with PM
2.5
concentrations. This study
estimated the association between PM
2.5
and
daily hospital admissions for chronic obstructive
pulmonary disease; there was a 2.2% increase in
these admissions for every 10 μg/m
3
increase
in average daily PM
2.5
.
A larger, national study (Zanobetti, 2009) analyzed
hospital admissions for all respiratory causes
among adults more than 65 years of age
living in 26 U.S. communities. The authors found
increases in daily respiratory admissions ranging
from 1.3% in the summer to 4.3% in the spring
for every 10 μg/m
3
increase in average daily PM
2.5
.
Ozone Studies
Three studies were selected to provide
concentration-response functions for ozone
and mortality, emergency department visits for
asthma and hospital admissions for asthma
(Table 4). All studies provided estimates across all
age groups for populations in New York City.
One study (Huang 2005) showed a 2.3% increase
in daily cardiovascular and respiratory deaths
for every 10 parts per billion increase in average
ozone concentrations over the week before death.
Another study (Ito, 2007) observed an increase
in relative risk of 1.32 per 53.5 parts per billion
increase in maximum ozone concentrations for
emergency department visits for asthma. Another
study (Silverman 2010) documented that the
relative risk for hospitalization increased by 1.06
to 1.20 (depending on age) per 22 parts per
billion increase in maximum ozone.
Table 4. O
3
effect estimates used in this report.
Health Effect Age Acute or Chronic Effect Study Source of
Group Exposure Metric Estimate Location Effect Estimate
Premature All ages Acute, 2.33% increase in New York City Huang, 2005
mortality daily 24-hour cardiovascular and respiratory
average mortality per 10ppb increase
in ozone levels over the
previous week
Emergency All ages Acute, Relative risk of 1.32 per New York City Ito, 2007
department daily 8-hour 53.5 ppb increase in ozone
visits for asthma maximum
Hospital admissions All ages Acute, Relative risk of 1.06-1.20 New York City Silverman,
for asthma daily 8-hour (varies by age group) per 2010
maximum 22 ppb increase in ozone
O
3
O
3
=ozone
ppb=parts per billion
Air Pollution and the Health of New Yorkers: The Impact of Fine Particles and Ozone I 12
Particulate Matter
Current air quality conditions were based on
measured daily PM
2.5
from all regulatory monitors
within New York City and adjacent counties
over 3 years (2005-2007) (U.S. Environmental
Protection Agency Air Quality System
). The
regulatory monitors do not capture the full range
of neighborhood variations documented by the
Health Department’s NYCCAS
; these year-round
estimates were not available for this report, but
will be used in future health impact studies.
Preliminary analyses by the Health Department
indicate that using NYCCAS data will produce
similar results for citywide health impact
estimates, but somewhat different results by
neighborhood.
The influence of year-to-year changes in
meteorology and unique emissions patterns was
minimized by calculating baseline PM
2.5
concentrations as a 3-year average. Since air
pollution levels and health events vary by season,
current conditions were defined as quarterly
averages of daily PM
2.5
concentrations. First, at
each monitor, quarterly averages were calculated
for each year and then averaged across the
3 years. Daily average concentrations for each
quarter were then assigned to each of 42 New
York City United Hospital Fund neighborhoods,
using a method that assigns greater weight to
monitors in or near to a neighborhood (U.S. Envi-
ronmental Protection Agency, 2010).
Baseline PM
2.5
concentrations were compared to
3 comparison scenarios (Figure 4):
1. Policy-relevant background. This is an
estimate, based on air pollution models, of
the level of natural background PM
2.5
concentrations that would exist without
sources of air pollution from human activity in
the United States, and which therefore cannot
be affected by emissions control efforts
(Environmental Protection Agency, 2009).
Policy-relevant background is approximately
5% of current average PM
2.5
concentrations in
New York City. Although achieving policy-
relevant background is not possible, it
provides a comparison for calculating the
overall health burden from exposure to fine
particles from man-made sources. Since
background pollution levels vary by season, the
quarterly average policy-relevant backgrounds
modeled for the Northeast in were applied
(U.S. Environmental Protection Agency, 2009).
2. 10% improvement. This is a analysis of the
health benefits that would result if PM
2.5
concentration were 10% less, a modest
improvement, than current concentrations
New York City.
3. Lowest concentration among large U.S.
cities. In 2007, New York City’s first
comprehensive sustainability plan, PlaNYC
set
the goal of achieving “the cleanest air quality of
any big U.S. city” by 2030. The benefits of
achieving this goal was modeled by comparing
levels in the city from 2005 through 2007 to the
lowest levels measured in U.S. cities with
populations larger than one million people.
Achieving this goal would require a 22%
reduction in average PM
2.5
concentrations.
Air Quality Data
Current conditions*
(2005-2007)
10% Less than
current conditions**
Lowest concentration
among large U.S. cities
§
Policy relevant
background
¥
Annual average PM
2.5
concentration
(µg/m
3
)
16
14
12
10
8
6
4
2
0
PM
2.5
=particulate matter
* Current conditions=annual average PM2.5 concentrations, 2005-2007 Source: United States Environmental
Protection Agency Air Quality System (AQS)
** 10% Less than Current Conditions=2005-2007 Annual average concentrations reduced by 10%, calculated from
USEPA AQS
§
Lowest concentration among large US Cites: Lowest 2005-2007 annual average concentrations among the 9 US
cities with greter than 1.000.000 residents.
¥
Policy relevant background – Annual average PM
2.5
concentrations in U.S. Northeast assuming no
anthropogenic emissions from sources within the U.S., as predicted by the Community Multiscale Air Quality
Modeling System (CMAQ) and the Goddard Earth Observing System (GEOS)-Chem model Source: EPA 2009
Figure 4. Baseline annual average PM
2.5
levels
in New York City (2005-2007) and levels in comparison scenarios.
13 I Air Pollution and the Health of New Yorkers: The Impact of Fine Particles and Ozone
Ozone
Although ozone is always present in New York
City’s air, concentrations are much higher in the
summer. Since many studies of ozone health ef-
fects focus on the warm season, this study in-
cluded only New York City’s ozone season (April
1st - September 30th).
Current air quality conditions were based on
ozone data from all regulatory monitors within the
city and adjacent counties over 3 years (2005-
2007) (EPA Air Quality System
). Using 3 years of
data reduces the influence of year-to-year
weather and emission changes on the estimates.
Since epidemiological studies model the risk es-
timates using a variety of averaging times, several
exposure metrics were computed for consistency
with the effect estimates (24-hour average, daily
8-hour maximum). First, at each monitor, quarterly
averages (April-June and July-September) were
calculated for each year and then averaged
across the 3 years. Average concentrations for
each quarter were assigned to each of 42 New
York City United Hospital Fund neighborhoods,
using a method that gives monitors in or near to a
neighborhood a greater weight (EPA 2010).
Figure 5 shows current baseline ozone con cen-
trations and 2 comparison scenarios:
1. Policy-relevant background – This is an
estimate based on air pollution models of the
natural background ozone concentrations that
would exist without sources of air pollution
from human activity, and therefore cannot be
affected by emissions control efforts (Fiore
2004). We converted the 4-hour, afternoon
average policy-relevant background estimate
in the Northeast to the policy-relevant back-
ground estimate for different metrics used in
the ozone studies considered in the health
impact assessment by computing the ratio of
the 4-hour average to the 8-hour maximum or
the 24-hour average, calculated from the hourly
monitoring data from sites used in the analysis.
Policy-relevant background is approximately
45% of current average ozone concentrations
in New York City and a smaller proportion of the
concentration on days with poor air quality.
Although achieving this level is not possible,
it provides a means for measuring the overall
health burden from exposure to ozone.
2. 10% improvement – A comparison ozone
concentration 10% less than current concen-
trations was used to estimate the health benefits
associated with a modest improvement in
New York City air quality.
Baseline Population and Health Data
Mortality data for New York City residents were
provided by the Health Department’s Bureau of
Vital Statistics for 2005 through 2007. Based on
the underlying cause of death, daily counts were
summarized and rates of all-cause mortality were
calculated across 22 age groups for the PM
2.5
impact estimates, and for the subset of mortality
due to cardiovascular and respiratory causes
matching a specific case definition (Huang, 2005)
for ozone impact estimates.
April-September average O
3
concentration
(ppb)
O
3
=ozone
ppb=parts per billion
* Current Conditions=average ozone concentrations, April-September 2005-2007, measured at monitors within
New York City and adjacent counties. (Source: Environmental Protection Agency Air Quality System (AQS)).
** 10% Less than current conditions=April-September 2005-2007 average concentrations reduced by 10%,
calculated from USEPA AQS
§
§
Policy-relavent background=April-September 2005-2007 Northeast U.S. average ozone concentration assuming
no anthropogenic emissions from U.S., as predicted by the GEOS-Chem Model. Source: Fiore 2004
0
5
10
15
20
25
30
35
40
45
50
Current conditions*
(2005-2007)
10% less than
current conditions**
Policy relevant
background
8-hour Maximum
24-hour Average
Figure 5. Baseline warm season average 0
3
levels in New York City
(2005-2007) and levels in comparison scenarios.
Hospital admissions and emergency room visits
for New York City residents (from the New York
Statewide Planning and Research Cooperative
System) for the same 3 years (2005-2007) was
used to summarize daily counts and rates
across 22 age groups. Using diagnostic codes in
the hospital discharge data, case definitions
were matched to each of the studies with
concentration response functions.
All 3 datasets contain ZIP code of residence
from which data were aggregated to the
United Hospital Fund neighborhood definition,
consisting of 42 adjoining ZIP code areas. The
22 age-specific population denominators
for
2005 through 2007 were produced by the Health
Department using data from the U.S. Census
Bureau Population Estimate Program and
housing unit data obtained from the New York City
Department of City Planning.
Air Pollution and the Health of New Yorkers: The Impact of Fine Particles and Ozone I 14
15 I Air Pollution and the Health of New Yorkers: The Impact of Fine Particles and Ozone
Results
The main analyses used for each pollutant to
estimate health impacts of PM
2.5
and ozone in
New York City included:
1. The total citywide health impact for each health
endpoint studied, using the policy-relevant
background comparison to estimate the overall
burden (preventable events if all human sources
of the pollutant were eliminated) and other
comparisons to estimate the health events
that could be prevented with air pollution
improvements
2. For each health endpoint, maps showing the
rate of air pollution-attributable health events
for current conditions compared to the policy-
relevant background by United Hospital Fund
neighborhood
3. For each health endpoint, the estimated pro-
portion and rate of air pollution-attributable
health events for current conditions compared
to the policy relevant background in different
age groups and comparisons of United
Hospital Fund neighborhoods grouped by the
proportion of people living in poverty
An online appendix
contains results from
additional analyses using other studies to obtain
concentration response functions and other data.
Particulate Matter Health Impacts
Current exposures to the annual average
concentrations of PM
2.5
above background
concentrations cause more than 3,000 premature
deaths, more than 2,000 hospitalizations due
to respiratory and cardiovascular causes, and
approximately 6,000 emergency department
visits for asthma (Table 5) in New York City
annually. Even a feasible, modest reduction (10%)
in PM
2.5
concentrations could prevent more than
300 premature deaths, 200 hospital admissions
and 600 emergency department visits. Achieving
the PlaNYC
goal of “cleanest air of any big city”
would result in even more substantial public
health benefits.
Annual Health Events Attributable to Current Annual Health Events Prevented: Annual Health Events Prevented: PM
2.5
Levels
PM
2.5
Compared to Background Levels PM
2.5
Levels Reduced 10% Reduced to Cleanest Air of Any Large City
Rate per Annual Rate Annual Rate
Age Number of Events 100,000 Percent (%) Number of Events per 100,000 Percent (%) Number of Events per 100,000 Percent (%)
Health Effect Group (95% CI)* people of Events** (95% CI) people of Events** (95% CI)* people of Events**
Premature 30 and 3,200 (2200,4100) 65 6.4 380 (240,460) 7.1 0.7 760 (520,1000) 16 1.5
mortality older
Hospital 20 and 1,200 (460,1900) 20 2.6 130 (50,210) 2.1 0.3 280 (109,460) 4.7 0.6
admissions for older
respiratory
conditions
Hospital 40 and 920 (210,1630) 26 1.1 100 (20,170) 2.8 0.1 220 (50,380) 6.0 0.3
admissions for older
cardiovascular
conditions
Emergency Under 18 2,400 (1400,3400) 130 5.6 270 (160,370) 14 0.6 580 (340,810) 30 1.3
department
visits for
asthma
Emergency 18 and 3,600 (2200,4900) 57 6.1 390 (240,550) 6.3 0.7 850 (520,1200) 14 1.5
department older
visits for
asthma
PM
2.5
PM
2.5
=particulate matter
* CI=Confidence Interval
** Percent of certain citywide health events attributable to PM
2.5
in the specified age range.
Table 5. Annual health events attributable to citywide PM
2.5
levels and the health benefits of reduced PM
2.5
levels.
Mortality
An estimated 3,200 deaths annually among adults
30 years of age and older are attributed to PM
2.5
at current levels in New York City (Table 5).
Chronic PM
2.5
-attributable premature mortality
varies considerably across demographic groups
and neighborhoods. The PM
2.5
-attributable
mortality rates per 100,000 population varied by
more than 2-fold, with the highest burdens
in sections of the Bronx, Northern Manhattan,
parts of Southern Brooklyn and the Rockaways
(Figure 6).
Nearly 3 in 4 deaths (73%) attributable to PM
2.5
occur in adults age 65 years and older (Figure 7),
reflecting the higher overall mortality rates this
age group.
Air Pollution and the Health of New Yorkers: The Impact of Fine Particles and Ozone I 16
Figure 6. Rates of PM
2.5
-attributable mortality vary by 2.7-fold across New York City neighborhoods.
PM
2.5
=particulate matter
PM
2.5
-Attributable Adult Mortality Rate
17 I Air Pollution and the Health of New Yorkers: The Impact of Fine Particles and Ozone
Figure 7. Nearly 3 in 4 deaths attributable to PM
2.5
occur in adults 65 years of age and older.*
Percent of deaths attributable to PM
2.5
Age group
22%
5%
73%
PM
2.5
-attributable mortality*
PM
2.5
=particulate matter
*Attributable mortality rate per 100,000 persons, annually
30-44
Age group
(in years)
45-64
>65
8
36
233
0
50
100
150
200
250
30-44 45-64 >65
Figure 8. The PM
2.5
-attributable mortality rate is 28% higher
in neighborhoods with high, as compared to low, poverty rates.
Percent of deaths attributable to PM
2.5
by neighborhood poverty**
40%
27%
33%
PM
2.5
-attributable mortality*
PM
2.5
=particulate matter
* Attributable mortality rate per 100,000 persons above 30 years of age, annually
** Among adults 30 years of age and older
§
Poverty Status: Low, medium and high poverty tertiles are calculated using percent of residents within a neighborhood who are at <200% federal poverty level, based on data from
U.S. Census 2000
Low
Medium
High
57
64
74
0
10
20
30
40
50
60
70
80
Low Medium High
Poverty status
§
The rate of PM
2.5
-attributable deaths is highest in the poorest neighborhoods, but more than 1 in 4 (27%)
attributable deaths occurs in more affluent neighborhoods (Figure 8).
Air Pollution and the Health of New Yorkers: The Impact of Fine Particles and Ozone I 18
Hospital Admissions for Respiratory Disease
Approximately 1,200 annual hospital admissions
for respiratory disease among New York City
adults age 20 years and older are attributable to
current levels of PM
2.5
(Table 5). Across city
neighborhoods, the rate of respiratory hospital-
ization among adults attributable to PM
2.5
per
100,000 persons varies more than 7-fold, with the
highest burdens found in sections of the South
Bronx, Northern Manhattan and Northern
Brooklyn (Figure 9). This pattern reflects the
variation, by neighborhood, in overall respiratory
hospitalization rates in adults.
Figure 9. PM
2.5
-attributable respiratory hospitalization rates vary 7.6-fold across New York City neighborhoods.
PM
2.5
-Attributable Respiratory Hospitalization Rate
PM
2.5
=particulate matter
1
9 I Air Pollution and the Health of New Yorkers: The Impact of Fine Particles and Ozone
Overall, older adults (65 years of age and older) have
much higher rates of respiratory hospitalizations
and account for 67% of estimated PM
2.5
-attributed
respiratory hospitalizations (Figure 10).
The estimated rate of PM
2
.5
-attributable respiratory
hospitalization is nearly twice as high in high poverty,
compared to low poverty, neighborhoods
(Figure 11).
Percent of respiratory hospitalizations
attributable to PM
2.5
by age category
Age group
22%
10%
1%
67%
PM
2.5
-attributable respiratory
hospitalizations*
25-44
20-24
45-64
>65
PM
2
.5
=particulate matter
*Attributable mortality rate per 100,000 persons, annually
3
5
14
80
0
10
20
30
40
50
60
7
0
80
90
20-24 25-44 45-64 >65
Age group
(
in years)
Figure 11. The PM
2.5
-attributable respiratory hospitalization rate is 90%
higher in neighborhoods with high, as compared to low, poverty rates.
Percent of respiratory hospitalizations
attributable to PM
2.5
by neighborhood poverty**
38%
21%
41%
PM
2.5
-attributable respiratory
hospitalizations*
Low
Medium
High
PM
2.5
=particulate matter
* Attributable respiratory hospitalization rate per 100,000 persons >20 years of age
** Among adults above 20 years of age
§
Poverty status: Low, medium and high poverty tertiles are calculated using percent of residents within a neighborhood who are at <200% federal poverty level, based on data from
U.S. Census 2000
14
18
27
0
5
10
15
20
25
30
Low Medium High
Poverty status
§
Figure 10. Two-thirds of respiratory hospitalizations attributable
to PM
2
.5
occur in adults 65 years of age and older.
Air Pollution and the Health of New Yorkers: The Impact of Fine Particles and Ozone I 20
Hospital Admissions for Cardiovascular
Disease
Among residents age 40 years and older, an esti-
mated 920 annual hospitalizations for cardiovas-
cular events are attributable to current PM
2.5
levels
in New York City (Table 5). These rates vary much
less (3-fold) across the city than rates of respiratory
hospital admissions (7.5-fold); the highest rates
occur in the Bronx, Northern Manhattan, North-
Central Brooklyn and parts of Southern Brooklyn
(Figure 12).
Figure 12. PM
2.5
-attributable cardiovascular hospitalization
rates vary 2.9-fold across New York City neighborhoods.
PM
2.5
-Attributable Cardiovascular Hospitalization Rate
PM
2.5
=particulate matter
21 I Air Pollution and the Health of New Yorkers: The Impact of Fine Particles and Ozone
Adults older than 65 years of age have rates
4.5 times higher than younger adults of PM
2.5
-
attributable hospitalization for cardiovascular
events; overall, an estimated 63% of PM
2.5
-attributed
cases occur in older adults (Figure 13).
Neighborhoods with a high rate of poverty
have a 1.6-fold higher rate of PM
2.5
-attributable
cardiovascular hospital admissions than do low
poverty neighborhoods (Figure 14).
Percent of cardiovascular hospitalizations
attributable to PM
2.5
by age category
Age group (in years)
37%
63%
PM
2.5
-attributable cardiovascular
hospitalizations*
40-64
>65
PM
2.5
=particulate matter
* Attributable cardiovascular hospitalization rate per 100,000 persons, annually
§
Poverty status: Low, medium and high poverty tertiles are calculated using percent of residents within a neighborhood who are at <200% federal poverty level, based on data from
U.S. Census 2000.
13
58
0
10
20
30
40
50
60
70
40-64 >65
Age Group
(in years)
Figure 14. The PM
2.5
-attributable cardiovascular hospitalization rate is 60%
higher in neighborhoods with high, as compared to low, poverty rates.
Percent of cardiovascular hospitalizations
attributable to PM
2.5
by neighborhood poverty**
Poverty status
40%
24%
36%
PM
2.5
-attributable cardiovascular
hospitalizations*
PM
2.5
=particulate matter
* Attributable cardiovascular hospitalization rate per 100,000 persons above 40 years of age
** Among adults above 40 years of age
Poverty status: Low, medium and high poverty tertiles are calculated using percent of residents within a neighborhood who are at <200% federal poverty level, based on data from
U.S. Census 2000
Low
Medium
High
20
25
32
0
5
10
15
20
25
30
35
Low Medium High
Figure 13. More than three-fifths of hospital admissions for cardiovascular disease
attributable to PM
2.5
occur in adults older than 65 years of age.
Air Pollution and the Health of New Yorkers: The Impact of Fine Particles and Ozone I 22
Emergency Department Visits for Asthma
in Children
More than 2,400 emergency department visits
annually for asthma among New York City
children are attributable to current PM
2.5
levels
(Table 5). These rates vary greatly, from
approximately 15 per 100,000 people younger
than 18 years of age, to more than 175 visits per
100,000 in areas with the higher poverty rates
(Northern Manhattan, large areas of the Bronx,
Central Brooklyn, parts of Eastern Queens and
the Rockaways), reflecting the variation in
overall asthma emergency department visit rates
in children (Figure 15).
Figure 15. PM
2.5
-attributable asthma emergency department visit rates among children younger
than 18 years of age vary nearly 30-fold across New York City neighborhoods.
PM
2.5
-Attributable Asthma Emergency Department
Visits Among Children
PM
2.5
=particulate matter
23 I Air Pollution and the Health of New Yorkers: The Impact of Fine Particles and Ozone
The rates are 3 times higher in the most impover-
ished neighborhoods (Figure 16), which are respon-
sible for more than 60% of PM
2.5
-attributable
emergency department visits for pediatric asthma.
Emergency Department Visits for Asthma
in Adults
An estimated annual 3,600 emergency depart
ment
visits for asthma among New York City adults every
year in New York City are attributable to PM
2.5
(Table 5). These rates vary considerably, from as
low as 9 per 100,000 population in Southern Staten
Island and Southwest Brooklyn, to as high as 100 to
200 visits per 100,000 in Northern Manhattan, large
areas of the Bronx, Central Brooklyn, parts of Eastern
Queens, the Rockaways and parts of Northern
Staten Island (Figure 17).
Disparities by neighborhood poverty are large; there
is a 5-fold increase in high poverty, compared to
low poverty, neighborhoods (Figure 18).
Percent of emergency department visits for asthma among
children attributable to PM
2.5
by neighborhood poverty**
Poverty status
30%
10%
60%
PM
2.5
-attributable emergency department-
visits among children for asthma*
PM
2.5
=particulate matter
* Attributable rate of emergency department visits for asthma per 100,000 persons under 18 years of age
** Among children <18 years of age
Poverty status: Low, medium and high poverty tertiles are calculated using percent of residents within a neighborhood who are at <200% federal poverty level, based on data from
U.S. Census 2000
Low
Medium
High
60
98
188
0
20
40
60
80
100
120
140
160
180
200
Low Medium High
Figure 16. PM
2.5
-attributable asthma emergency department rates among children are
more than 3 times higher in high poverty, compared to low poverty, neighborhoods.
Air Pollution and the Health of New Yorkers: The Impact of Fine Particles and Ozone I 24
Figure 17. PM
2.5
-attributable asthma emergency department visit rates among adults
18 years and older vary 25-fold across New York City neighborhoods.
Percent of emergency department visits for asthma among
adults attributable to PM
2.5
by neighborhood poverty**
Poverty status
29%
12%
59%
PM
2.5
-attributable emergency department-
visits among adults for asthma*
PM
2.5
=particulate matter
* Attributable rate of emergency department visits for asthma per 100,000 persons above 18 years of age
** Among adult >18 years of age
Poverty status: Low, medium and high poverty tertiles are calculated using percent of residents within a neighborhood who are at <200% federal poverty level, based on data from
U.S. Census 2000
Low
Medium
High
23
41
110
0
20
40
60
80
100
120
Low Medium High
Figure 18. PM
2.5
-attributable asthma emergency department visit rates in adults is
nearly 5 times higher in neighborhoods with high, as compared to low, poverty.
PM
2.5
-Attributable Asthma Emergency
Department Visits Among Adults
PM
2.5
=particulate matter