Water quality, pollution and treatment units
Bạn đang xem bản rút gọn của tài liệu. Xem và tải ngay bản đầy đủ của tài liệu tại đây (378.65 KB, 24 trang )
Water Quality, Pollution,
and Treatment Plants
Objectives
• Introduce water quality standards
• Introduce typical treatment processes and
design flow rates
• Present examples of flow sheet diagrams
Water Usage
Domestic
Industrial
Agriculture
Fish farming
Recreational
Pollution
Pollution
Physical
Physical
Radiological
Radiological
•Thermal
•Solids
Chemical
Chemical
Biological
Biological
•Hardness
•Pathogens
•Heavy metals
•Nutrients
•Pesticides
•Oxygen demanding waste
•Volatile organic compounds
•Radio-isotopes
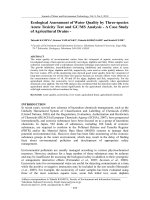
Storm water pollution
Scale formation due to
water hardness
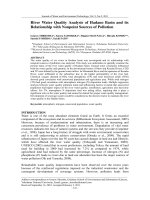
Red tide due to algae contamination
Water Quality
Standards
•
•
•
•
.A
Standards for
water usage
B.
Discharge or
effluent
standard
.C
Water quality
objective limit
Drinking
Irrigation
Recreational
Industrial
•
•
•
•
•
•
•
•
Stream
Sea
Harbor
Lake
Stream
Sea
Harbor
Lake
A. Drinking Water Standard
A1. US Primary Drinking Water MCL in mg/L (partial list)
Inorganic Chemicals
Arsenic
0.05
Mercury
0.002
Barium
2
Nickel
0.1
Cadmium
0.005
Nitrate (as N)
10
Chromium (total)
0.1
Nitrite (as N)
1
Copper
TT
Nitrate + nitrite
10
Fluoride
4
Selenium
0.05
Lead
TT
Thallium
0.002
Asbestos
7×10⁶ fiber /L
Ethylbenzene
0.7
Vinyl chloride
0.002
VOCs
Benzene
0.005
Carbon tetrachloride 0.005
Different countries may have different drinking water standards
A2. Bacteriological limits for drinking water
US EPA states that “bacterial quality criteria for
drinking water from public supplies require not more
than 1 total-coliform/100 ml as the arithmetic mean of all
water samples examined per month, with no more than 4
coliforms/100 ml in any sample if the number of samples
is ≤ 20/month, or no more than 4 per 100 ml in 5% of the
samples if the number of samples exceeds 20 per month.
Bouwer, Groundwater Hydrology, McGraw-Hill, 1978.
Number of samples taken for coliform testing depends on the
population served by the treatment facility
Example
Water samples from the effluent of a water treatment plant of a town
(39,000 people) were analyzed at regular intervals over a month period.
The numbers of coliform/100 ml sample were as shown below:
According to EPA
regulations, are the
number of samples
and effluent bacterial
quality acceptable?
Explain.
.No Count
.No
Count
.No
Count
.No
Count
1
0
11
1
21
0
31
0
2
0
12
0
22
0
32
0
3
1
13
2
23
2
33
2
4
0
14
5
24
4
34
0
5
1
15
2
25
6
35
0
6
2
16
1
26
1
36
0
7
0
17
1
27
0
37
0
8
0
18
0
28
0
38
5
9
1
19
0
29
0
39
0
10
0
20
0
30
0
40
1
Solution
The population is 39,000, so the minimum number of samples should be
40. Since we have 40 samples then the number of samples taken is OK
The arithmetic average of coliform should not be more
than 1. Since the average number of coliform is 0.95
which is less than 1 then this condition is OK
No more than 5% of the samples should have more than 4
. coliform/100ml
Since the number of samples is 40 then no more than 2 samples (5%)
should have more than 4 coliform/100ml. However, there are three
samples (sample # 14, 25, and 38) that have more than 4 coliform/100ml.
So this is a violation of the regulations.
A3. Secondary Standard for Drinking Water
Contaminant
Level
Effects
Al
0.05-0.2 mg/L
Water discoloration
Cl
250 mg/L
Taste, pipe corrosion
Color
15 color units
Aesthetic
Cu
1 mg/L
Taste, porcelain staining
F
2 mg/L
Dental fluorosis
Foaming agents
0.5 mg/L
Aesthetic
Fe
0.3 mg/L
Taste, laundry staining
pH
6.5-8.5
Corrosive
Sulfate
250 mg/L
Taste, laxative effects
B. Effluent Standards
B1. US National Pollutant Discharge Elimination System
)(NPDES
7 consecutive
days
30 consecutive
days
BOD
45 mg/l
30 mg/l
SS
45 mg/l
30 mg/l
Oil and grease
20 mg/l
10 mg/l
pH: 6-9
BOD and SS removal > 85%
B2. Discharge standard of wastewater into Jebel Ali Harbor
Parameter
Unit
Maximum limit
Total Suspended solids
mg/l
50
-
6-9
C
< 35
BOD
mg/l
50
Dissolved Oxygen
mg/l
>3
Nitrate
mg/l
40
Arsenic
mg/l
0.05
Cadmium
mg/l
0.05
Copper
mg/l
0.5
Lead
mg/l
0.1
Mercury
mg/l
0.001
Oil & Grease
mg/l
10
Phenols
mg/l
0.1
Total Organic Carbon
mg/l
75
Cells/100ml
1000
pH
Temperature
Total Coliform
o
C. Water Quality Objective Limits
Jebel Ali Harbor water quality objective limits
Indicator
Standard (mg/l or as noted)
Lead
0.05
Oil and grease
1
Aluminum
0.2
Arsenic
0.01
Cadmium
0.003
Dissolved oxygen
Not less than 5 mg/l or 90% saturation
Mercury
0.001
BOD5
10
Nitrate-N
0.5
Aromatic hydrocarbons
0.001
pH
1 pH unit from background level or 6.5-8.5
Suspended solids
10 (mean), 25 (maximum)
Temperature
2 oC from background level
Total dissolved solids
2% from background level
Typical Treatment of Contaminants
Parameter/Problem
Treatment Process
Large debris (particles)
Screens (Physical)
Settlable solids
Grit chamber (Physical)
Suspended solids
Coagulation (Chemical)/flocculation
(Physical)/Sedimentation (Physical)
Filtration (Physical)
BOD
Biological reactors (Biological)
Heavy metals
Depending on the metal: Sorption (Chemical),
ion exchange (Chemical), or precipitation
(Chemical)
Trace organic
contaminants
Activated carbon (Chemical) or air stripping
(Chemical) if chemicals are volatile in nature
Microorganisms
Disinfection (mainly Chemical)
(Water Treatment Plant (WTP
A WTP consists of processes to remove contaminants present in the water
such that produced water is suitable for drinking.
The design of a WTP depends on (1) the quality of raw water, (2) the quality
of produced water and the (3) capacity of the plant.
The capacity of the plant depends on the design period (15-25 yrs), the
population served, and the per capita water consumption.
A flow sheet for the plant shows the sequence of the processes used:
Raw water
Produced water
influent
Effluent
WTP
(Wastewater Treatment Plant (WWTP
A WWTP consists of processes to remove contaminants present in the
wastewater such that produced water is suitable for discharge or reuse.
The design of a WWTP depends on (1) the characteristics of wastewater, (2)
the desired characteristics of treated wastewater and the (3) capacity of the
plant.
The capacity of the plant depends on the design period (15-25 yrs), the
population served, and the per capita wastewater generation.
A flow sheet for the plant shows the sequence of the processes used:
Wastewater
Treated
wastewater or
Or influent
WWTP
Effluent
Flow Rates: Water Treatment Plants
Design flow rate =per capita water consumption*population at the end
.of design period
Note that the per capita water consumption increases about 10% of the
.percentage increase in population
Example
A small town with a population of 100,000 and a per capita water
consumption of 500 L/d. A water treatment plant is to be built to serve this
town for the coming 10 yrs. Estimate the design flow rate assuming the
.population after 10 yrs is 150,000
Solution
The percent increase in population = (150000-100000)/100000= 50%
Per capita consumption at the end of design period=500(100%
+50%*10%)=525 L/d
Design flow rate = 150,000 * 525 L/d= 78750 m3/d
Flow Rates: Wastewater Treatment Plants
:Minimum flow rate
Important for design of pipes and channels that carry wastewater with
suspended solids. Minimum velocity to keep organic solids in suspension is 0.3
.m/s and to keep silt and sand in suspension is about 0.6 m/s
:Maximum flow rate
This is the peak hourly flow. Such flow is used to determine the hydraulic
capacity of the treatment plant and collection system.
Design flow rate:
Average daily flow at the end of the design period. Usually the average daily
flow is taken as the average over a continuous of 12 months period.
This design flow rate is used to determine organic loading and for sizing all
treatment units.
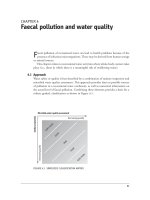
Flow Sheet Diagram
River Water Treatment Plant
Coagulant
Chlorine
solution
Raw
water
Effluent
Bar
Screen
Traveling Mixing
Screen
Aeration
Flocculation
Settling
Filtration
Carbon bed
Brine
Add Mg
+
Add F
Filter
Bottle water Plant
Ground
Water
Reverses Osmosis
Filters
G.L
W.T
Well
Filter
Ozonation
Bottled
Water
Example Industrial Wastewater Treatment Plant
Influent
Equalization
Tank
Aeration Tank
Settling Chlorination
Tank
Effluent
Air
Return sludge
Dispersed plug-flow activated sludge plant for an industrial wastewater
Removal Efficiency
Q,
Co
Treatment
Unit
Q,
C
Q= flow rate
Co = influent concentration
C = effluent concentration
Removal efficiency = (Co-C)*100/Co
For example if Co is 100 mg/l and C is 10 mg/l then the
. removal efficiency of the treatment unit is 90%