Environmental treatment Solved problems
Bạn đang xem bản rút gọn của tài liệu. Xem và tải ngay bản đầy đủ của tài liệu tại đây (1.27 MB, 31 trang )
SP #1: Review
1. What is the chemical formula for carbonate, bicarbonate, sulfate, calcium hydroxide,
and potassium phosphate?
Solution:
Carbonate: CO32Bicarbonate: HCO3Sulfate: SO42Calcium hydroxide: Ca(OH)2
Potassium phosphate: K3(PO4)3
2. What are the radicals that cause alkalinity? (Problem 1.6 page 17 of Reynolds and
Richards)
Solution:
Radicals that cause alkalinity are carbonate (CO32-), bicarbonate (HCO3-), and hydroxide
(OH-).
3. If a water has a pH= 8.0, what will be the concentration of H+ in mg/l.
Solution:
pH= -log[H+], where [H+] is the concentration of H+ in mole/l.
Thus, [H+]= 10-8 mole/l
Since the atomic weight of H+ =1.0 g/mol, then the concentration of H+ = 10-8 g/l = 10-5
mg/l.
4. What is the molarity of a solution that contains 400 mg/l calcium?
Solution:
# moles (mass / molecular weight )
(mass / l )
=
=
l
l
molecular weight
400 mg / l
Thus, the molarity of the solution =
= 10 −2 mol / l
3
40 × 10 mg / mol
Note that the atomic weight of Ca is 40 g/mol.
Molarity =
5. A water has a hardness of 185 mg/l as CaCO3. What is the hardness expressed in
meq/l? (Problem 1.7 page 17 of Reynolds and Richards)
Solution:
Hardness (meq / l ) =
185 mg CaCO3
meq
×
= 3.7 meq / l
l
50 mg CaCO3
6. Covert a flux of 15 gallon/min/ft2 to m3/hr/m2.
Solution:
15 gallon 1
60 min 10.76 ft 2
m3
Flux (m / hr / m ) = (
⋅ 2 )×(
)(
)(
) = 36.65
min
264.2 gallon
hr
ft
m2
7. (Problem 4.5 page 92 of Reynolds and Richards). Note you need to solve problem 4.4
first to find the total solids concentration.
3
2
Solution
From problem 4.4, the total solids concentration is determined as
44.6484 g − 44.6420 g 1000 mg 1000 ml
TS (mg / l ) = (
)×
×
= 640 mg / l
10 ml
g
l
a. From the information given in problem 4.5, the total suspended solids concentration is
17.5504 g − 17.5482 g 1000 mg 1000 ml
TSS (mg / l ) = (
)×
×
= 22 mg / l
100 ml
g
l
b. Total dissolved solids is now calculated as:
TDS = TS- TSS = 640-22 = 618 mg/l
8. The mass flow rate of a contaminant entering a treatment plant is calculated as:
Mass flow rate = Volumetric flow rate × Concentration × conversion factor
If the unit of the volumetric flow rate is million gallon per day, the unit of concentration
is mg/l, and the unit of mass flow rate is lb/day, what is the value of the conversion
factor?
Solution:
lb million gallon mg 3785000l
lb
=
×
×
×
d
day
l
million gallon 453592.4mg
lb million gallon mg
=
×
× [ 8.344]
d
day
l
Thus, the value of the conversion factor is 8.344
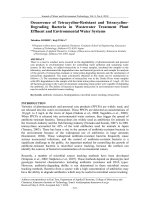
9. Obtain a snap shot from Goggle Earth for a water and a wastewater treatment plant in
the UAE.
Solution:
The top aerial photo below is for Al Fujairah Desalination Plant which is a water
treatment plant) while the photo at the bottom is for Al Aweer Wastewater Treatment
Plant in Dubai.
SP#2: Water Quality
1. A solution has 46 mg/l of phosphate. What is the concentration of phosphate in mg/l as
P?
Solution:
Concentartion (mg / l as P) = concentration (mg / l as PO4 ) ×
= 46 ×
mass of P per mole of PO 4
mass of PO 4 per mole of PO 4
31
= 15
(31 + 4 ×16)
2. (Modified Problem 4.3 page 92 of Reynolds and Richards)
A city has a present population of 53,678, and the average water consumption is 162
gal/cap/day. A new water treatment plant is to be built to serve the city for the
coming 10 years. The expected population 10 years from now is 65,300
(a) What is the per capita water consumption 10 years from now?
(b) What is the design capacity of the water treatment plant?
Solution:
(a) Percent increase in population= [(65300-53678)/53678]*100% =21.6%
Per capita water consumption= 162 (100%+ 10%*21.6%) = 165.5 gal/cap/day
(b) Capacity= (165.5 gal/cap/day)* 65,300 = 10807150 gal/day = 10.81 million gal/day
3. The US Primary Drinking Water Standard requires that nitrate in drinking water should
not exceed 10 mg/l as N. A groundwater has a nitrate (NO3-) concentration of 15.5 mg/l.
If this water is to be used for drinking purposes, is there a need to reduce the nitrate
concentration to meet the US Primary Drinking Water Standard? Explain.
Solution:
Convert the concentration of nitrate in groundwater from mg/l to mg/l as N
concentartion (mg / l as N ) = concentration (mg / l as NO3 ) ×
= 15.5 ×
mass of N per mole of NO3
mass of NO3 per mole of NO3
14
= 3.5 < 10
(14 + 3 × 16)
Thus, there is no need to reduce the nitrate concentration as it is below the maximum
contaminant level.
4. Water samples from the effluent of a water treatment plant of a small town (18,000
people) were analyzed at regular intervals over a month period. The numbers of coliform
per 100 ml sample were as shown in the table below:
Sample
1
2
Coliform
per 100ml
0
0
Sample
9
10
Coliform per
100ml
1
0
Sample
17
18
Coliform per
100ml
1
0
3
4
5
6
7
8
1
0
1
2
0
0
11
12
13
14
15
16
1
0
2
5
2
1
19
20
21
22
23
24
0
0
0
1
1
2
According to the EPA regulations, are the number of samples and effluent bacterial
quality acceptable? Explain.
Solution
The population is 18,000, so the minimum number of samples should be 20. Since we
have 24 samples then the number of samples taken is OK.
Since the average number of coliforms is 0.875 which is not more than 1, then this
condition is OK.
Since the number of samples is 24>20, then 5% of the samples are allowed to have more
than 4 coliform/100 ml.
Number of samples allowed to have more than 4 coliform/100 ml= (5/100) (24)= 1.2.
Which means only 1 sample is allowed to have more than 4 coliform/100 ml. Inspection
of the table above shows that there is one sample (sample # 14) that has more than 4
coliform/100ml, which is Ok.
5. Treated wastewater samples from the effluent of a wastewater treatment plant were
analyzed at regular intervals. The influent of the plant receives waste that has a BOD of
300 mg/l and suspended solids of 220 mg/l. The characteristics of the effluent are shown
in the table below for 30 successive days. From the data in the table, determine if the
wastewater treatment plant violates the NPDES discharge requirements.
Sample
pH
1
2
3
4
5
6
7
8
9
10
11
12
13
7.8
7.4
7.6
7.4
7.7
7.8
7.9
7.8
7.7
7.8
7.4
7.5
7.4
Oil and
grease
(mg/l)
12
14
11
18
21
5
7
7
8
11
13
12
14
BOD
(mg/l)
SS
(mg/l)
Sample
pH
33
36
24
48
51
25
24
18
37
23
26
21
24
19
24
20
24
18
27
23
26
21
24
28
27
33
16
17
18
19
20
21
22
23
24
25
26
27
28
7.9
7.6
7.7
7.7
8.1
8.2
7.9
7.7
7.7
7.8
7.9
7.8
7.7
Oil and
grease
(mg/l)
17
5
6
7
7
8
11
13
12
14
11
12
21
BOD
(mg/l)
SS
(mg/l)
23
26
25
21
24
28
37
33
26
31
24
18
37
24
17
15
15
22
23
26
21
24
18
37
23
26
14
15
7.7
7.8
11
14
18
27
26
31
29
30
7.8
7.3
5
15
23
36
21
24
Solution
A spreadsheet is prepared to calculate average of 7 and 30-consuctive days for BOD, SS,
and oil and grease (O&G). Also, the percent removal of BOD and SS is shown in the
spreadsheet below.
Sample
pH
BOD
(mg/l)
SS
(mg/l)
O&G
(mg/l)
1
7.8
33
19
2
7.4
36
24
3
7.6
24
4
7.4
5
7.7
6
BOD(7)
BOD(
30)
SS(7)
SS(30)
O&G(7)
O&G(30
)
BOD
removal
(%)
SS
removal
(%)
12
89.0
91.4
14
88.0
89.1
20
11
92.0
90.9
48
24
18
84.0
89.1
51
18
21
83.0
91.8
7.8
25
27
5
91.7
87.7
7
7.9
24
23
7
34.4
22.1
12.6
92.0
89.5
8
7.8
18
26
7
32.3
23.1
11.9
94.0
88.2
9
7.7
37
21
8
32.4
22.7
11.0
87.7
90.5
10
7.8
23
24
11
32.3
23.3
11.0
92.3
89.1
11
7.4
26
28
13
29.1
23.9
10.3
91.3
87.3
12
7.5
21
27
12
24.9
25.1
9.0
93.0
87.7
13
7.4
24
33
14
24.7
26.0
10.3
92.0
85.0
14
7.7
18
26
11
23.9
26.4
10.9
94.0
88.2
15
7.8
27
31
14
25.1
27.1
11.9
91.0
85.9
16
7.9
23
24
17
23.1
27.6
13.1
92.3
89.1
17
7.6
26
17
5
23.6
26.6
12.3
91.3
92.3
18
7.7
25
15
6
23.4
24.7
11.3
91.7
93.2
19
7.7
21
15
7
23.4
23.0
10.6
93.0
93.2
20
8.1
24
22
7
23.4
21.4
9.6
92.0
90.0
21
8.2
28
23
8
24.9
21.0
9.1
90.7
89.5
22
7.9
37
26
11
26.3
20.3
8.7
87.7
88.2
23
7.7
33
21
13
27.7
19.9
8.1
89.0
90.5
24
7.7
26
24
12
27.7
20.9
9.1
91.3
89.1
25
7.8
31
18
14
28.6
21.3
10.3
89.7
91.8
26
7.9
24
37
11
29.0
24.4
10.9
92.0
83.2
27
7.8
18
23
12
28.1
24.6
11.6
94.0
89.5
28
7.7
37
26
21
29.4
25.0
13.4
87.7
88.2
29
7.8
23
21
5
27.4
24.3
12.6
92.3
90.5
30
7.3
36
24
15
27.9
28.2
24.7
23.6
12.9
11.4
88.0
89.1
Regulation
6-9
45
30
45
30
20
10
Status
OK
OK
OK
OK
OK
OK
Not OK
>85%
2 times
violatio
n
>85%
1 time
violatio
n
The table below summarizes the regulations and the existing violations
7-consuctive days
30-consuctive days
Oil and grease
BOD
Suspended solids
pH
BOD removal
Suspended solids removal
20 (OK)
10 (Exceeded)
45 (OK)
30 (OK)
45 (OK)
30 (OK)
6-9 (OK all values within this range)
>85% (violated once)
>85% (violated twice)
SP # 3: Reactors
1. A completely mixed reactor has a volume of 40 m3 and receives a pollutant at a
concentration of 40 mg/l with a flow rate of 10 m3/d. The pollutant leaves the reactor at a
concentration of 5 mg/l. Answer the following questions:
(i) What is the influent concentration?
(ii) What is the effluent concentration?
(iii) What is the concentration inside the reactor?
(iv) Is the pollutant conservative?
(v) What is the incoming mass flow rate of the pollutant
Solution:
(i) 40 mg/l
(ii) 5 mg/l
(iii) 5 mg/l because the reactor is completely mixed
(iv) No, because the concentration dropped which means the pollutant decayed.
(v) The incoming mass flow rate = (40 mg/l) (10 m3/d) (1000 l/m3)
= 400,000 mg/d
= 0.4 kg/day
2. In the schematic shown below two streams (1 and 2) are joined to form a single
stream (3) with a suspended solids concentration (SS3) of 2500 mg/l. What is the
value of Q2 in million gallons per day (mgd)? Assume complete mixing at the joint
point.
Q1=2 mgd
SS1= 200 mg/l
SS3= 2500 mg/l
Q2=? mgd
SS2= 12000 mg/l
Solution:
Apply mass balance at the joint point, assuming no decay:
Mass input rate = Mass output rate
Q1*SS1 + Q2*SS2 = (Q1 + Q2)*SS3
(2)(200) + Q2(12000) = (2 + Q2)*2500
Q2= 0.484 mgd
3. A treatment unit is to be designed to remove 90% of a contaminant by a reaction
with a rate constant of 3.0 per day. Calculate the detention times required in
completely-mixed and in a plug-flow reactor.
Solution:
For a completely mixed reactor:
Co
1 + k ( V / Q)
Since (Co-C)/Co= 0.9, then C/Co=0.1.
Now solve for the detention time (V/Q) using k =3
V/Q= 3 days
C=
For a plug-flow reactor
C
= e − k (V / Q )
Co
Using C/Co=0.10 and k = 3 per day, V/Q will be 0.77 day.
4. The data presented in the following table show the effluent concentration (C) of a
dispersed plug flow reactor resulting from injecting a pulse of an ideal tracer into the
influent and measured effluent concentrations versus time after injection. Determine the
actual retention time (min) and the dispersion number of the reactor.
t, min
0
15
30
45
60
75
90
105
120
135
150
180
210
240
270
300
330
360
C, ug/L
0
0
0
3.5
16.5
46.5
72
89
95
88
78.2
55.2
33.5
20
12.1
7.5
4.6
2.6
Solution
t, min
0
15
30
45
60
C, ug/L
0
0
0
3.5
16.5
tC
0
0
0
157.5
990
t2C
0
0
0
7087.5
59400
75
90
105
120
135
150
180
210
240
270
300
330
360
Sum
46.5
72
89
95
88
78.2
55.2
33.5
20
12.1
7.5
4.6
2.6
624.2
3487.5
6480
9345
11400
11880
11730
9936
7035
4800
3267
2250
1518
936
85212
261562.5
583200
981225
1368000
1603800
1759500
1788480
1477350
1152000
882090
675000
500940
336960
13436595
The actual retention time:
t=
∑t c
∑c
i
i
85212
= 136.5 min
624.2
=
i
The dispersion number (D/vxL) can be found as follows:
σ2 =
∑t C
∑C
2
i
i
− t 2 = 2890.05
i
σ θ2 =
σ2
= 0.15508
t2
Using
σ θ2 = 2
D
D 2
− 2(
) (1 − e −v x L / D )
vx L
vx L
Solve for D/vxL using the graph of σ θ2 versus D/vxL. Thus, D/vxL is about 0.0847.
5. What is the effluent concentration of a contaminant with a retention time of 6 hrs
injected into a dispersed plug-flow reactor at a concentration of 75 mg/l. The axial
velocity and length of the reactor are 2 cm/hr and 80 cm, respectively. The dispersion
coefficient is 140 cm2/hr. Assume a first-order reaction with a rate constant of 0.35 hr-1.
Solution:
C
4ae ( Pe / 2)
=
Co (1 + a ) 2 e ( aPe / 2 ) − (1 − a ) 2 e ( − aPe / 2)
and
The Peclet number = Pe= vxL/D= 1.142
4k t R
a = 1 +
Pe
0.5
a = (1 +
4 × 0.35 × 6 0.5
) = 2.89
1.142
C
= 0.26
Co
⇒ C = 19.7 mg/l
SP #4: Equalization and Filtration
1. The flow (every two hours) at an industrial wastewater treatment plant is as given in
the following table. The wastewater treatment plant does not have an equalization
tank. You are asked to design an equalization tank for the plant. What is the design
capacity of the tank? Solve the problem by the spreadsheet and graphical methods
and compare the answer obtained by the two methods.
Time
0-2
2-4
4-6
6-8
8-10
10-12
12-14
14-16
16-18
18-20
20-22
22-0
Q (m3/s)
0.5
2
4.5
3.5
2.5
2
1.5
1
0.75
0.5
1.5
4
Solution:
A. The spreadsheet method:
The table below shows that the capacity of the tank is 46200 m3. The design capacity is
20% more which is 55440 m3.
Time
Q, m3/s
Volume, m3
Volume-Average, m3
0-2
2-4
4-6
6-8
8-10
10-12
12-14
14-16
16-18
18-20
20-22
22-0
0.5
2
4.5
3.5
2.5
2
1.5
1
0.75
0.5
1.5
4
Average=
3600
14400
32400
25200
18000
14400
10800
7200
5400
3600
10800
28800
14550
-10950
-150
17850
10650
3450
-150
-3750
-7350
-9150
-10950
-3750
14250
Sum=
Positive, m3
Negative, m3
-10950
-150
17850
10650
3450
-150
-3750
-7350
-9150
-10950
-3750
14250
46200
-46200
B. The graphical method
The table below shows the cumulative volume versus time. The data are plotted as shown
in the figure below. Tangents are drawn parallel to the average cumulative pumping rate
line. The capacity of the tank is a + b+ c = 12,000+ 20,000 + 14,000 = 46,000 m3. So the
design capacity is 46,000×1.2= 55,200 m3
Time
0
2
4
6
8
10
12
14
16
18
20
22
24
Cumulative volume, m3
0
3600
18000
50400
75600
93600
108000
118800
126000
131400
135000
145800
174600
c
b
a
2. The surface area of a granular media filter is to be designed such that the filtration flux
is 5 gpm/ft2. If the received flow rate is 2 million gallon per day, what would be the
surface area of the filter?
Solution:
Flux = flow rate/ surface area
2 × 10 6 gal
Flow rate
day
day
Surface area =
=
×
= 278 ft 2
5 gal
Flux
24hr ⋅ 60 min
2
min⋅ ft
SP #5: Settling
1. A grit chamber to collect sand particles (>0.25mm) is to be designed. The flow rate
through the chamber is 0.8m3/s, its depth is 2.5m and its width is 3.0m. What is the design
length of the chamber?
Solution:
g ( ρ s − ρ )d 2 9.81(2650 − 1000)(0.25 × 10 −3 ) 2
vs =
=
= 0.056 m / s
18µ
18 × 0.001
Q
Q
0.8
v s = vo =
⇒ As =
=
= 14.23 m 2
As
v s 0.0562
14.23
As = L × W ⇒ L =
= 4.7 m
3
2. The shown curve was obtained from a settling test in a 0.4-m cylinder. The initial
solids concentration (Co) was 2400 mg/l. Determine the surface area required for an
underflow concentration (Cu) of 12,000 mg/l with an inflow rate of 1200 m3/day.
Solution:
Ac:
Determine the absolute value of the slope of the early part of the curve to find vo.
vo= (0.4-0.36)/(10-0)=0.014 m/min.
Thus the area needed for clarification = Ac= Q/vo= 59.5 m2.
At:
To determine the area for thickening:
Draw tangents to the early and late parts of the settling curve and follow the procedure in
the handouts to construct the bold line shown on the curve.
Determine Hu: HoCo=HuCu, thus Hu= 0.08 m
Determine tu using the value of Hu and the bold line, thus tu is about 35 minutes (see
figure).
At=Qtu/Ho, thus At= 72.9 m2.
The design surface area is therefore 72.9 m2.
3. This is Problem 9.3 page 277 of Richards and Reynolds after modification.
A batch settling test has been performed on an industrial wastewater having an initial
suspended solids of 597 mg/l to develop criteria for the design of a primary clarifier. The
test column was 5 in. in diameter and 8 ft high, and sampling ports were located 2, 4, 6,
and 8 ft from the water surface in the column. The suspended solids remaining after
various sampling times are given in the table below. The wastewater flow is 2.5 mgd.
Determine the surface area of the settling tank for a 60% removal efficiency.
Depth (ft)
2
4
6
8
10
394
460
512
1018
20
352
406
429
1142
Time (min)
30
243
337
376
1208
45
182
295
318
1315
Solution:
Find the percent removal of suspended solids as shown in the table below:
Depth (ft)
2
4
10
34.0
22.9
Time (min)
20
30
41.0
59.3
32.0
43.6
45
69.5
50.6
60
75.2
63.8
60
148
216
306
1405
6
14.2
28.1
37.0
46.7
8
a
a
a
a
a= data showed an increase in solids concentration
48.7
a
Plot lines of equal percent removal as shown in the curve below
0
2
Depth
4
100%
34
41
59
69.5
75.2
22.9
32
43.6
50.6
63.8
14.2
30
%
28.1
10
20
6
37
40
%
46.7
50
%
60
%
48.7
8
30
40
50
60
70
Time
Find the percent removal at four different times, say 25, 37, 50, and 60 minutes
0
100%
2
Depth
4
30
%
6
60
%
50
%
40
%
8
10
20
30
40
50
60
70
Time
5.3
2.4
1.8
0.8
) + (50 − 40)( ) + (60 − 50)( ) + (100 − 60)( ) = 45.9%
8
8
8
8
5.6
2.5
1.0
R37 = 40 + (50 − 40)( ) + (60 − 50)( ) + (100 − 60)( ) = 55.1%
8
8
8
R25 = 30 + (40 − 30)(
6.2
3.8
0.9
) + (60 − 50)( ) + (100 − 60)( ) = 65.7%
8
8
8
7.0
4.8
1.7
R60 = 46 + (50 − 46)( ) + (60 − 50)( ) + (100 − 60)( ) = 69.2%
8
8
8
R50 = 44 + (50 − 44)(
Plot the removal efficiency versus time and from the curve determine the time to achieve
60% removal. The time will be 43 min. For design multiply the time by 1.75. Thus, the
design detention time will be 75 min. Now, find the surface area using:
Q× t
( 2.5 × 10 6 × 0.134 /(24 × 60)(75)
As =
=
= 2181 ft 2
Depth
8
Note: 0.134 is a conversion factor from gallon to ft3.
SP # 6: Desalination
1. A reverse osmosis unit is to demineralize 1750 m3/d of tertiary treated effluent.
Pertinent data are as follows: mass transfer coefficient = 0.22 liter/{(d-m2) (kPa)},
pressure difference between the feed and the product water = 2100 kPa, osmotic pressure
difference between the feed and the product water = 300 kPa, and membrane area per unit
volume of equipment = 2000 m2/m3. Determine
a. The membrane area required.
b. The space required for the equipment, m3.
Solution:
a.
0.22l
(2100 − 300)kPa = 396 l / d .m 2
2
d .m kPa
1750 m 3 / d
Q
A=
=
= 4419 m 2
Fw 396 × 10 −3 m 3 / d .m 2
Fw = K (∆p − ∆ψ ) =
b. Space needed =
4419 m 2
= 2.2 m 3
2
3
2000 m / m
2. An electrodialysis stack is to be used to partially demineralize 500 m3/d of brackish
water so that it can be used by an industry. The raw water has a TDS of 4000 mg/l and
the product water must not have more than 1000 mg/l. Given the followings:
The normality of the raw water is 0.075 eq/l.
The membrane dimensions are 75×75 cm.
Stack resistance= 4.5 ohms.
Current efficiency = 84%
Ratio of current density to normality= 400 (with current density as milli ampere/cm 2)
Power cost= 2.5 cents/ kwh.
Brine TDS concentration= 70 g/l.
Determine
a. The salt removal efficiency.
b. Product water flow.
c. Number of membranes.
d. Power cost per m3.
Solution:
a. Salt removal efficiency =
4000 − 1000
× 100% = 75%
4000
b.
500 × 4000 = Q(1000) + (500 − Q)(70000)
⇒ Q = 478.26 m 3 / d
c.
current density
= 400 ⇒ current density = 400 × 0.075 = 30
N
⇒ current = (30) × (75 × 75) = 168750 milli ampere
I=
FQNE r
nE c
168.75 amp =
96,500 amp. sec/ eq × 500 m 3 / d × 0.075 eq / l × 0.75
d
10 3 l
×
× 3
n × 0.84
24 × 60 × 60 sec m
⇒ n ≅ 222
⇒ number of membranes = n − 1 = 221
d.
Power = RI 2 = (4.5)(168.75) 2 = 128145 watts = 128.1 kw
2.5 cents
day
24h
Cost =
× (128.1kw) ×
×
= 15.4 cents / m 3
3
kwh
day
500m
SP #7: Precipitation
Lime-soda ash is to be used to soften a water with the following composition: CO2=
8 mg/l, Ca= 110 mg/l, Mg= 24.4 mg/l, Na= 11.5 mg/l, K= 19.6 mg/l, HCO3= 200
mg/l as CaCO3, SO4= 86.4 mg/l, and Cl= 45.5 mg/l.
a. Draw a meq/l bar graph for the raw water.
b. Determine the amount of lime and soda ash needed for excess lime softening.
Assume the practical limits of hardness removal for Ca is 30 mg/l and for Mg is 10
mg/l as CaCO3.
c. Determine the pH of the water after softening but before recarbonation.
d. Determine the concentration of sodium in the softened water.
Solution:
a.
Constituent
CO2
Ca
Mg
Na
K
HCO3
SO4
Cl
0.36
Conc.
8 mg/l
110 mg/l
24.4 mg/l
11.5 mg/l
19.6 mg/l
200 mg/l as CaCO3
86.4 mg/l
45.5 mg/l
0
CO2
M.Wt.
44
40
24.4
23
39
100
96
35.5
5.5
7.5
Ca
Mg
SO4
HCO3
0
4.0
Eq. #
2
2
2
1
1
2
2
1
Na
Cl
5.8
…
…
8.0
Eq. Wt.
22
20
12.2
23
39
50
48
35.5
meq/L
0.36
5.5
2.0
0.5
0.5
4.0
1.8
1.28
8.5
K
…
7.08
Note that there are some negative ions that do not appear in the bar graph due to
incomplete water analysis.
b.
1 meq/l of
1 CO2
1 Ca(HCO3)2
1 Mg(HCO3)2
1 Ca-noncarbonate
1 Mg-noncarbonate
Excess
Total
meq/l needed from
lime
1
1
2
0
1
1.25
Soda ash
0
0
0
1
1
Actual
conc.
present
0.36
4.0
0
1.5*
2**
Actual meq/l needed
from
lime
0.36
4.0
0
0
2
1.25
7.61
Soda ash
0
0
0
1.5
2
3.5
*
1.5=5.5-4.0 (This is the concentration of Ca that does not have alkalinity)
2=7.5-5.5 (This is the concentration of Mg that does not have alkalinity).
**
Amount of lime needed in mg/l
= (7.61 meq/l)× (37mg/meq) = 281.6
Amount of soda ash needed in mg/l = (3.5 meq/l)× (53 mg/meq) = 185.5
c. The concentration of OH after treatment includes that from excess lime (1.25 eq/l) and
that from the equilibrium dissolution of Mg(OH)2 which is 0.2 meq/l. So the total OH is
1.45 meq/l which equals to 1.45 mmol/ = 1.45*10-3 mol/l.
10 −14
[H + ] =
= 6.9 × 10 −12
−3
1.45 × 10
pH= -log[H+]= 11.16
d. The concentration of Na= original concentration in water plus the contribution from
the addition of soda ash
Na= 0.5 + 3.5= 4 meq/l = 4meq/l × 23mg/meq= 92 mg/l
SP #8: Sorption
1. A wastewater that has an organic compound at 10 mg/l is to be treated by granular
activated carbon. A batch isotherm test has been performed in the laboratory and the
following results were obtained:
Bottle
Carbon mass
Solution volume
C equilibrium
(g)
(ml)
(mg/l)
1
0.12
100
5.5
2
0.22
100
2.7
3
0.33
100
1.25
4
0.38
100
0.98
5
0.43
100
0.56
6
0.54
100
0.3
7
0.65
100
0.15
8
0.82
100
0.11
Determine
(a) The most appropriate sorption isotherm model that describe these data.
(b) Use the model selected in part (a) to find the carbon mass required to treat a batch of
200 m3 of this wastewater in the field such that the treated water has a phenol
concentration of no more than 1 mg/l.
Solution:
(a) Calculate S for each bottle using CoV=CV+mS and then plot graphs of S versus C
(linear model), logS versus logC (Freundlich model), and 1/S versus 1/C (Langmuir
model).
Find the best fit line for each case along with the coefficient of determination (R2). Note
that for the case of the linear model, the data were fit to a line with zero-intercept since
the linear model takes the form S=KC.
From the above, the Freundlich model (logS vrs logC) has the highest R2 value. But since
the model contains two parameters and the linear model contains one parameter, then to
judge which model is more suitable we need to use the corrected Akaike Information
Criteria (AICc). The AICc is given by:
2( P + 1)( P + 2)
SSR
AICc = N ln
+ 2( P + 1) +
N−P
N
Find first the SSR values associated with the linear and Freundlich models
Linear
Bottle
1
2
3
4
5
6
7
8
C
5.5
2.7
1.25
0.98
0.56
0.3
0.15
0.11
S
S
3.75
3.32
2.65
2.37
2.20
1.80
1.52
1.21
Res
5.07
2.49
1.15
0.90
0.52
0.28
0.14
0.10
SSR
Freundlich
S
Res2
2
1.75
0.69
2.25
2.16
2.82
2.31
1.90
1.22
15.09
3.94
3.23
2.61
2.44
2.08
1.75
1.44
1.32
SSR
0.036
0.008
0.002
0.004
0.012
0.002
0.005
0.014
0.083
Now calculate the AICc value for the two models
Model
N
P
P+1
SSR
AICc
Linear
Freundlich
8
8
1
2
2
3
15.09
0.083
11.47
-24.55
Since the Freundlich model has a lower AICc value than the linear model, it is more
suitable to use. Therefore, logS= 0.2787logC + 0.3892
b. Find S for a concentration of 1 mg/l using the above Freundlich equation:
logS= 0.2787log1 + 0.3892= 0.3892. Thus, S=2.45 mg/g.
Apply CoV=CV+MS
(10mg/L) (200m3*1000 L/m3)= (1 mg/L) (200m3*1000 L/m3) + M(2.45 mg/g)
Thus, M=734,636.5 g = 734.6 kg