Pattern of Suburbanization in Ho Chi Minh City and the Livelihood Transition of Suburban Farmers
Bạn đang xem bản rút gọn của tài liệu. Xem và tải ngay bản đầy đủ của tài liệu tại đây (520.5 KB, 14 trang )
Vietnam Social Sciences, No. 5(169) - 2015
Pattern of Suburbanization in Ho Chi Minh City
and the Livelihood Transition of Suburban Farmers
Hiroyuki Kawashima *
Vu Minh Hoang **
Abstract: The trend of suburbanization is emerging in Vietnam’s major cities at a growing pace;
and Ho Chi Minh City (HCMC), being the most urbanized and economically affluent city in the
country, has reached this so-called urban “U-turn” where studies have suggested of growing urban
relocation to suburb areas as early as in the 1990s.
Expanding the urban area undoubtedly has many benefits for urban residents, businesses as well
as for the city’s government. Nonetheless as the city expands, along with the increase in land
conversion and the number of constructions at the suburban areas, many local dwellers are forced
to relocate elsewhere to make way for new development. Observing the socio-impacts of relocated
households, the HCMC Institute for Development Studies (HIDS) in 2014 presented its research
based on a survey of almost 2000 relocated individuals in the city. The primary results showed, for
instance, that 14% of the respondents experienced increase in their income, while 57% saw no
change, and 29% earned less than before.
This paper differs itself from the study done by the HIDS in that it chooses to focus only on the
livelihood transition of farm households in the suburban districts, rather than the general relocated
suburban population. It should be understood that many of the local dwellers in the suburban
districts were traditionally farmers or worked in conjunction with farming. The transition for them
from agriculture to non-farm work in a complex and vibrant economy like HCMC can prove to be
extremely difficult, especially if they have little experience working outside farming. The core
interest of this paper henceforth is to understand the experience of agricultural households
throughout the transition process.
Key words: Suburbanization; pattern; livelihood; farmers; HCMC; livelihood transition; land
acquisition; land compensation.
1. Introduction
The assumptions are that: (1) on one
hand, farm households, after receiving
compensation money from land acquisition,
would upgrade their lifestyles, enter the
non-farm employment, increase their earning
and move up in the social ladder; (2) on the
other hand, agricultural farmers could be
the group that faces the most challenges
24
from relocation. In addition to having to
resettle, they also have to cope with changes
in their lifestyle as many are forced to give
up agriculture to transfer to the non-farm
sector.(*)While the eventual income might be
relatively higher, if they manage to find a
(*)
Assoc. Prof., The University of Tokyo.
Ph.D. Candidate, The University of Tokyo.
(**)
Pattern of Suburbanization in Ho Chi Minh City...
suitable employment, it is unclear as to
whether such household could or how long
it would take for them to complete the
transition to perceive the benefits of relocation.
The paper is divided into three parts. The
first explains the rationale for the research,
including literature reviews and statistical
data showcasing the different stages of
outward urban expansion and relocation in
HCMC, and what implications have it made
on the socio-economic level. The second
part presents our research and empirical
finding from the analysis of 200 agricultural
households’ surveys in suburban HCMC.
Our study is foremost interested in the
change in income and employment condition
of traditional agricultural households after
relocation. In the last part we conclude our
paper by tying together the observed urban
expansion phenomenon and its implications
for suburban farm households post land
acquisition process.
2. From urban centralization to urban
expansion in HCMC
In the early phase of urbanization, urban
development tends to take place at the
central districts, and expansion toward the
outer districts only occurs when opportunities
in the centre begin to show sign of scarcity.
Such pattern is well studied under the urban
theory of ‘natural evolution’. The central
districts are to be developed first to satisfy
the economic impetus. Commuting costs are
reduced and the clustering of firms would
promote supportive mechanism and local
competition to achieve market efficiency.
Businesses originally were locating in
the central districts and in-migrants to city
also follow such logic and choose to locate
themselves in the centre, even illegally. Not
only there were direct opportunities for
employment at the centre but also the
density of population in the area generates a
more comprehensive platform for communication.
Many rural workers came to city without
certainty of employment and “the simple
fact that many jobs are found by happening
to be at the right place at the right time”
make all the more reason for them to locate
in or nearby the city’s centre where
everything is taking place.
The increased concentration of population
in the central districts produce externalities
of skyrocketing land price, traffic
congestion, poor environment due to
pollution and noise, and gradual failure of
the public infrastructure to meet the
increasing local demand. Urban expansion
thus appears as a solution for city’s
government to combat the overcrowding
central districts. According to the ‘natural
evolution’ theory, suburbanization is
triggered by the increasing demand for
larger housing residence by the middle
income class and the increased availability
of transportation means. Employment
decentralization would eventually take
place where businesses also relocate to the
suburban districts to exploit the benefits of
lower costs of land and suburban wages.
2.1. Population settlement
Ho Chi Minh City, being the most mature
25
Vietnam Social Sciences, No. 5(169) - 2015
urban area in Vietnam with over 80% of the
population residing in urban districts, is no
exception from such urban evolution path.
The most obvious way to observe the urban
expansion (or suburbanization) phenomenon
is through the population census. The
growth in urban population in Vietnam’s
two largest cities of HCMC and Hanoi in
the last couple decades was argued to be
caused not by the increased concentration in
the core districts but rather by the growing
population settlement in the ‘more remote
peripheral areas’. Study on urban transformation
in Vietnam, for instance, demonstrated a
trend of outward inter-districts movement
in Hanoi and HCMC during the period from
1994 to 1999. In the case of HCMC
specifically, study claimed that such
suburban development has started as early
as in 1989 as population in the core districts
stagnate until today and most gains in
population took place in the suburban areas.
Another study also demonstrated the trend
of suburbanization into the new inner
districts in HCMC from 1998 to 2005,
reflecting it through the government’s
timeline for urban expansion.
Government plan for urban expansion in
HCMC took effect in 1997 and 2003 with
the objective to reduce the overcrowding
population in the central areas. In 1997,
under the Decree 03-CP, urban districts of
2, 7, 9, 12, and Thu Duc were established;
subsequently in 2003, Binh Tan was
reclassified as urban under the Decree
130/2003/ND-CP. The HCMC government
also noticed the importance of these
districts in the years to come whereby the 6
districts were classified as ‘developing
inner-city urban districts’ as contrast to the
previous 13 ‘existing urban districts’.
The ‘suburban’ movement in this paper
refers to the shift of population to the
‘developing inner-city urban districts’ – in
other words, the 6 ‘developing inner-city
urban districts’ are the ‘suburban districts’.
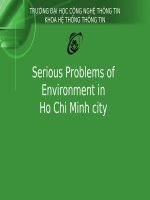
HCMC districts are grouped in Table 1.1
according to the different phases of
urbanization: (I) the first phase of
urbanization would concentrate in the ‘core
urban centre’, (II) the second phase would
disperse to the ‘new central districts’, and
(III) the third phase sees even more
decentralization movement toward the
suburban districts. Despite its small share of
population, the ‘rural districts’ also
experience stable population increase
throughout the recorded period.
Table 1: HCMC’s Urban Density by Districts from 1989 to 2013 (pp/km2)
1989
1994
1999
2004
2009
2013
Core Urban Centre
District 1
32,083
23752
29,983
25,776
24,125
25,540
District 3
47,967
58813
46,588
40,940
38,654
39,270
District 4
42,584
53200
48,246
43,659
46,542
44,452
26
Pattern of Suburbanization in Ho Chi Minh City...
District 5
48,946
62096
51,392
40,273
45,260
41,296
District 6
29,207
36425
36,359
33,644
36,690
37,013
District 10
39,685
47,902
42,314
41,161
40,277
41,815
District 11
43,774
51,556
47,864
44,715
44,931
44,331
Phu Nhuan
34,836
39164
36,222
35,998
37,548
36,979
District 8
13,139
16096
17,575
18,728
21,177
22,468
Binh Thanh
15,125
18788
19,717
20,370
22,327
23,258
Tan Binh(1)
8,414
10519
15,113
20,032
21,603
23,865
Go Vap
8,156
10252
16,167
22,463
21,112
30,605
District 2
2,043
2,492
2,914
2,823
District 7
3,131
4,396
7,335
7,866
District 9
1,320
1,747
2,172
2,495
District 12
3,224
5,359
7,077
9,275
Thu Duc
4,388
6,893
8,625
10,629
7,417
10,701
12,628
New Central Districts
Suburban Districts
Binh Tan
Rural Districts
Cu Chi
508
590
598
662
783
884
1,261
1890
1,876
2,230
3,151
3,743
Binh Chanh
674
800
1,101
1,182
1,668
2,035
Nha Be
587
1092
645
720
1,020
1,255
Can Gio
70
86
82
94
104
103
Hoc Mon
Source: HCMC Statistical Yearbook (1989, 1994, 1999, 2004, 2009, 2013)
HCMC nonetheless remains the most
attractive city for migrants, providing exiting
urban lifestyle with good service and
opportunities in education and employment.
Even for migrant, the clear suburbanization
phenomenon has had an influence on their
settlement preferences toward the outer
districts. The influential factors include the
lower cost of housing, less crowded, and
the existence of adequate infrastructure for
utilities and commuting, as well as a
growing number of businesses that have
started relocating to the suburban districts.(1)
2.2. Employment, economic and land
use structure
As an economy becomes more mature,
(1)
Tan Binh was divided into 2 urban districts in
2003: Tan Binh and Tan Phu. The table keeps Tan
Binh as one district for ease of understanding and
drawing references.
27
Vietnam Social Sciences, No. 5(169) - 2015
the share of agricultural contribution in the
overall economy will eventually shrink and
be replaced by the growth in other
industrial and service sectors. This does not
mean however that agriculture output has
been declining but rather the growth in
other sectors has overshadowed that of
agriculture. In fact HCMC’s agricultural
sector is still growing at a significant rate,
recorded at 5.8% annually during the period
from 2001 to 2010. The decline in
agriculture share in the economic structure
is recognized to be positive as it indicates a
withdrawal from subsistence farming and a
move toward modern urban agriculture and
other industries.
The development pattern of HCMC’s
agricultural sector is also partly caused by
the transformation in land use and the shift
of employment from agriculture to other
second and tertiary sectors. For land use,
the suburban districts of 2, 7, 9, 12, Binh
Tan, and Thu Duc were all ‘rural’ before
being re-classified into ‘urban districts’.
These 6 suburban districts covers 35,182.60
ha, 16.79% of HCMC’s total land area, and
had 2,157,252 inhabitants by 2010, about
30% of the city’s population. The transformation
from rural to urban classification made way
for the conversion of a large number of
farmland into non-agricultural land. On
average from the year 2000 to 2013, more
than 1000ha of agricultural land in HCMC
was converted for other uses annually.
Agricultural land declined from 62.4% of
the total city’s land to 55.79%, while non28
agricultural experienced an 8% increased
from 35.46% to 43.99%.
In regard to employment, farmers are
slowly moving away from the agricultural
sectors to be involved in the modern
economy in the industries or service sectors.
Over the decade from 1999 to 2009, while
the total number of labor force in HCMC
had increased dramatically from over 2
million to almost 3.6 million, agricultural
labor have declined by 50,000 farmers,
while the service industries have taken in
approximately 800,000 new workers.
Major changes in land use and employment
structure were the consequences of urban
expansion in HCMC. As mentioned before, a
large amount of farmland has been
appropriated in these new districts to
accommodate for the construction of new
infrastructures and residential areas. As
land acquisition program took' place, many
farm households have to relocate or change
employment either because their farmland
has become too small or inexistent.
Agricultural households have been generally
on decline in all districts outside the ‘urban
core centre’. In the ‘suburban districts’ which
our study focuses on, farm households have
been reduced by over 6 times from 19,184
in 1997 to merely 3082 households in 2011.
3. Suburban agricultural households
in HCMC after land acquisition
3.1. Research methodology
The paper sets out the objectives to explore
the livelihood transition of agricultural
households in HCMC’s suburban districts.
Pattern of Suburbanization in Ho Chi Minh City...
The area for research is therefore restricted to the fact that the study was first conducted
to within the six districts of 2, 7, 9, 12, Thu here. Binh Tan and District 2 were only
Duc, and Binh Tan. Due to the limited time chosen later on to diversify the samples to
and resource and the difficulties in locating cover a broader spectrum of HCMC’s
the households that fit the profile, the suburban change.
questionnaires were only done in four
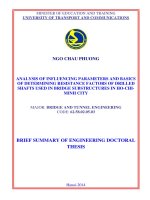
The 200 surveyed households, categorized
districts (district 2, 9, and Binh Tan). It as ‘Agricultural household after land
should be taken into account however that acquisition’, are households that previously
the distribution of questionnaires is not worked in agriculture and have land already
equal in all districts. District 9 has the been acquisitioned or converted during the
highest number of surveyed households due period from 2010 to 2015.
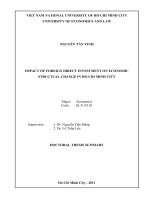
Table 2: Location Distribution of Surveyed Agricultural Households
Location
Agri. Households after Land Acquisition
Various aspects were covered in our
questionnaires, including: the social
demographic information; the agricultural
land size and types of agriculture; the
compensation scheme and priority use of
compensation fund; the livelihood transition
indicators (income, employment, housing
condition, etc.); the challenges for households
after land acquisition, and the current living
condition.
3.2. Research findings
The 200 surveyed households are home
to 938 people, out of which 51.9% are
female. Approximately three quarter of the
population is within in working age from 16
to 60 years old, with only 12% over 60 and
13% children. Despite the high percentage
of adults in the cohort, educational attainment
remains low with the majority (61%) only
graduated from middle school, and a further
22.9% with high school qualification.
District 9
120
District 12
Binh Tan
District 2
40
40
The smallest agricultural household in
this group only owned 53m2 of land
compared the largest household with
30,000m2. Out of 200 households, 192 have
undergone total land acquisition, meaning
they no longer have land afterward. In the
aftermath of the acquisition process, the
majority of households (61%) have chosen
‘cash and relocated land, or house with land
permit’ as their compensation preference,
compared to only 3% opted for ‘cash and
apartment relocation’ This indicates the
tendency of traditional farm households to
still prefer house on land rather than
apartment despite which in most cases are
provided at better condition than their
previous housing settlement. Further survey
on the difference between housing settlements
of the cohort before and after the land
acquisition also suggests that their housing
conditions have improved whereby over
29
Vietnam Social Sciences, No. 5(169) - 2015
80% of the surveyed households now reside
in ‘permanent housing’ compared to only
under 50% before land acquisition.
There is a large difference in cash
compensation per square meter between the
smallest and the largest receiver, 83,000
VND and 6.5 million VND respectively.
The average cash compensation per square
meter per household was calculated at 1.1
million VND, with the mode of households
received less than 300,000 VND. Even as
the choice of compensation for households
are skewed towards those also receive
relocation service after the acquisition
process, as many as 148 households have
answered that they had invested a small or
large percentage of their compensation fund
to buy land or house. It could be deduced to a
certain extent that many households perceived
real estate as a sound investment option.
As for agriculture, 166 out of 200
households did work and earn part of their
income from agriculture. The statistic is
now reversed as 180 households no longer
earn anything from agriculture. Only 17
household still actively work in agriculture
as of today. However the types of farming
practice have changed, limiting to only:
aquaculture, animal husbandry, decorative
trees and flowers, and vegetable farming;
farming works that require large plot of
land and low profit such as rice, industrial
crop can no longer survive as urban
agriculture. A mismatch could be spotted as
180 households no longer earn from
agriculture but 183 households no longer
30
work from agriculture. This could be
explained for instance that even if the
household no longer work in agriculture, its
members could work in farming for other
neighbor households.
Our survey also asked an additional
question on whether the household would
want to work again in agriculture regardless
of their current employment. A quarter of
them (50 households) answered ‘yes’ to the
question, meaning that 33 households that
are now not working in agriculture would
like to return again to farming. For these
families to think of returning to agriculture
would suggest that they are more likely to
be better off continue with farming and that
the land acquisition and the transition
toward the non-farm employment might not
have brought about better lifestyle or
income to balance the costs of abandoning
farming and relocation.
The average monthly income by household
member increased overtime, however such
increase is small and thus is deemed
insignificant or even negative if taking into
account the inflation rate. In fact, 107 out of
200 households responded that their current
livelihoods are more difficult than before.
As to what challenges have they faced with
since the resettlement, 143 families have
had difficulties in relation to employment
and income, and 79 have struggled to adjust
to the change in household’s living expenditure.
An interesting opposite finding was
found when comparing the general income
and employment condition before and after
Pattern of Suburbanization in Ho Chi Minh City...
land acquisition. Employment condition
seems to have improved after the land
acquisition contrasting to the general
feeling of decline in household income. A
structure change in employment status has
been observed however that while the
number of student has decreased (from 21.75%
to 15.9%) retirement and unemployment
have picked up, from 2.77% to 13.65% and
from 2.03% to 4.48% respectively. This
could imply that non-farm employment in
overall provides better working condition
but the transition to find such work can
prove to be difficult, especially for traditional,
lower educated, and older famer.
4. Drivers for effects on livelihood
transition
The paper is interested in how certain
pre-conditions of the households can have
an effect on whether that household will
have a difficult or smooth transition after
the land acquisition. An array of measures
has been conducted based on our
questionnaires, however the author would
like to focus on only two analyses in this
paper: the educational attainment by
household, and the livelihood and earning
condition after relocation.
It should be noted however that our
following analysis does not include regression
or any other correlation measures because
(1) the sample size is too small, (2) the
households were chosen by convenience to
fit the profile, and (3) the questionnaires
were not aimed to generate any kind of
correlation model. Henceforth no general
relational inference will be made based on
our survey.
4.1. Impacts from education before land
acquisition
Educational attainment is believed to
have an influence upon households’ income
structure whereby higher educated households
would be more likely to diversify their
income from other non-farm sources. The
diversification thus reduces the shock of
employment and income change during the
transition period for higher educated
households that rely less on agriculture.
Educational attainments are classified here
into 3 groups of ‘Low’, ‘Average’, and ‘High’
education – the average level of education
by household is taken as the ‘mode’ of that
household’s members educational level.
Low Education: Illiterate, Kindergarten,
Primary School
Average Education: Middle School, High
School, Vocational School
High Education: Vocational College,
University, Graduate School.
+ Education and Land size
We assume that there is a relation
between the size of land and the educational
attainment level, because as households’
members become more educated it is likely
that they will no longer participate in
farming activity therefore will sell or give
up their farm land - the land size would
then decrease along with higher educational
attainment. The result shows that the
majority of households either have land less
than 500m2 (34.5%) or higher than 3000m2
31
Vietnam Social Sciences, No. 5(169) - 2015
(36.5%). ‘Low’ and ‘High’ educated reflects
this result clearly in that their households
are also clustered in the group with small or
very large land plot. The ‘Average’
educated households on the other hand
reflect a relatively more evenly distributed
land size than in the other groups. However
this could be because the majority of the
cohort attained ‘Average’ education (125
out of 200) thus allowed this group for
more variations.
In addition, we could observe that the
‘High’ educated households group on average
has the smallest land size. However the
difference is quite small, thus insignificant,
between the ‘Low’ and ‘High’ groups. The
‘Average’ education cohort surprisingly has
the largest land on average (over 4000m2).
This analysis serves for a better understanding
of the land size division between households
of different educational level but fail to
provide a consistent trend of educational
attainment and land size variation.
+ Education and Share of agricultural
income
Another line of reasoning is that as
households become more educated, their
reliance on agriculture as a source of
income will reduce. Reflecting it to the
survey, a trend is demonstrated in that higher
educated households rely less on agriculture
than lower educated households. For instance,
before the land acquisition, ‘High’ educated
households earn on average 40.86% of their
income from farming, while households
with ‘Average’ education earn 42.60%, and
32
‘Low’ education 52.17%. The pattern remains
constant even after land acquisition despite
the general share of income from agriculture
have much decline. The result manages to
demonstrate the trend according to our
logic; however the differences between the
means of each group are quite small to draw
any specific conclusion.
4.2. Impacts on livelihood and earning
condition after land acquisition
The livelihood and earning condition of
agricultural households after land acquisition
is the most important finding for our paper.
The analysis presented here focus on two
aspects: compensation and income. As land
acquisition is the force that drives these
households to transition, compensation is
also analyzed where it is believed that
higher compensated households (in total)
would have an easier time adjusting to the
new livelihood. The author also believes
that income plays a major role in determining
whether the households experienced difficulties
or not after land acquisition.
+ Compensation and Livelihood and
earning condition
Record shows that over half of the
households receiving compensation from
500 million to 2 billion VND have a ‘more
difficult’ livelihood after land acquisition.
At the reception range from 2 to 5 billion
VND in compensation, households are
more evenly spread according to living
condition; while for households receiving
more than 5 billion VND, the scale is tipped
with the majority of the households feel
Pattern of Suburbanization in Ho Chi Minh City...
they have a better livelihood today. Comparing
the average compensation, the trend is
consistent with lower compensated households
experienced ‘more difficult’ livelihoods,
average compensated households experienced
‘no change’, and higher compensated
households have a ‘better livelihood and
earning condition’.
Although this paper cannot go into
details, several factors should be further
reviewed. It is understandable that low
compensated households could face more
challenges during the transition thus
making their livelihood ‘more difficult’.
Nonetheless, a question still remains as to
how much in compensation is enough to
facilitate the transition of agricultural
households? As we could observe in the
analysis, 6 households in the range of 2 to 5
billion, and 4 households receiving more
than 5 billion VND still reported a ‘more
difficult’ livelihood and earning condition.
The highest compensated household in our
survey, receiving in total 22 billion VND,
also belongs to this group that experiences a
‘more difficult’ livelihood.
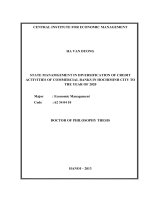
+ Income and Livelihood and earning
condition
- Average income per households’ members
after land acquisition
The analysis shows that the average
income of households’ members that reported
a ‘more difficult’ transition is the lowest at
2.2 million VND, while the average income
of households’ members that reported a
‘better livelihood and earning condition’
earn about 1.5 times that amount, at 3.4 million
VND. The difference in income between
the two groups is significant enough here.
However interestingly, households that
reported ‘no change’ in their livelihood and
earning condition are actually those earning
the most on average, at 5.5 million (or 2.5
times the average income of households
that reported ‘more difficult’ transition).
One reason could be that the ‘no change’
group had already reached a certain earning
threshold prior to the land acquisition thus
small changes in income might not be able
to produce an impact on their livelihood.
Another assumption, which can be reflected
in our analysis, is that the households that
reported ‘no change’ include odd households
that earn exceptional income. If we look at
the table, the minimum earning for the ‘no
change’ group fits between the ‘more
difficult’ and ‘better earning and livelihood’
groups; but looking at the maximum, the
‘no change’ group includes household with
members earning on average 40 million
VND, thus skewing the average income
much higher.
- Change in income
A simple assumption would be that
households that experienced an ‘increase’
in income would have a ‘better livelihood
and earning condition’ and vice versa, whereas
households experiencing a ‘decrease’ in
income would report a ‘more difficult’
transition. Our analysis presents over 73%
of households that reported a ‘decrease’ in
income answered that their livelihood has
33
Vietnam Social Sciences, No. 5(169) - 2015
become ‘more difficult’. At the same time
43.4% of those experienced an ‘increase’ in
income now have a ‘better livelihood and
earning conditions’.
The assumption seems to apply well for
the group with ‘decrease’ income and ‘more
difficult’ livelihood. However for other
groups such assumption only works to a
certain extent. Half of the households that
experienced ‘no change’ in income reported
a ‘more difficult’ livelihood, and only 32%
reported ‘no change’. In addition, surprisingly
for the group that earns more after the land
acquisition, 36.8% still reported of a ‘more
difficult’ livelihood.
4.3. Discussion
From our analysis, a number of odd
results have been observed and therefore
will be discussed here. Analysis on education
has been more consistent despite the
difference remains relatively small. The odd
factor is the ‘Average’ educated households
group, which is comprised of over half our
cohort. Future research should take into the
account this aspect and thinning out the
‘Average’ education group by further
dividing it to, for instances, ‘Average low’
and ‘Average high’. This would allow for a
better trending analysis.
The second focus on the impacts of
compensation and income on livelihood
transition brought about more controversial
results. In regard to compensation, we
could observe 6 households in the range of
2 to 5 billion, and 4 households receiving
more than 5 billion VND still reported a
34
‘more difficult’ livelihood and earning
condition. The highest compensated household
in our survey, receiving in total 22 billion
VND, also belongs to this group that
experiences a ‘more difficult’ livelihood.
Further research on the spending and saving
structure of the households’ compensation
fund should be able to provide clearer
understanding of such results.
As for income, the group that perceives
‘no change’ in their livelihood earn the
most on average. One reason could be that
the ‘no change’ group had already reached
a certain earning threshold prior to the land
acquisition thus small changes in income
might not be able to produce an impact on
their livelihood. Another assumption, which
can be reflected in our analysis, is that the
households that reported ‘no change’
include odd households that earn exceptional
income. If we look at the table, the
minimum earning for the ‘no change’ group
fits between the ‘more difficult’ and ‘better
earning and livelihood’ groups; but looking
at the maximum, the ‘no change’ group
includes household with members earning
on average 40 million VND, thus skewing
the average income much higher.
Lastly for the analysis of income change,
although our assumption did apply to a
certain extent, exception still exists, whereby
half of the households that experienced ‘no
change’ in income reported a ‘more
difficult’ livelihood, and only 32% reported
‘no change’. In addition, surprisingly for
the group that earns more after the land
Pattern of Suburbanization in Ho Chi Minh City...
acquisition, 36.8% still reported of a ‘more
difficult’ livelihood. Such exception emphasized
what we could not cover in our paper,
which is the difficulty during transition that
could not be solved solely through general
financial improvement.
5. Conclusion
The paper has carried out its objectives:
to demonstrate the suburbanization trend in
Ho Chi Minh City and the socio-economic
impacts that entails, including changes in
demography, economic structure, employment,
and land use; and to explore the current
livelihood of agricultural households after
land acquisition, understanding the factors
which could be perceived as challenges.
There were two assumptions for this
paper. The first believes that agricultural
households would be better off as they
would stop farming and join the non-farm
sector, which is more productive, stable,
and higher paid. Second is that households
would be worse off as they would have to
struggle to find new employment, cope with
new livelihood, and so on.
The results from our data have been
more in favor of our second assumption
despite several positive findings, for
instance, that a relative majority of
feedback on working condition saw an
improvement, and that many households
have moved to better housing after land
acquisition. Average income has increased
slightly overtime, although such increase
has not been sufficient as almost half of the
households have felt that their income has
declined, while a further 20% felt no
change in their income. Working condition
might have been improved but employment
status has suffered with a 2.4% increase in
unemployment. In regard to the current
livelihood and earning condition, over half
of the households (53.5%) felt it to be
‘more difficult’.
Further analysis into education, as a
driving factors impacting the outcome of
transition, shows no significant relation
between educational attainment and land
size, while a consistent trend was discovered
between education and the share of
agriculture income before and after land
acquisition (higher education means lower
share of agricultural income). In addition,
compensation and changes in income were
measured against the livelihood and earning
condition of agricultural households after
land acquisition. The results in this analysis
have supported our second line of
assumption, whereby even if households
have received a large amount of cash
compensation or have perceived increase in
income, many have answered that their
livelihoods have become ‘more difficult’.
In conclusion, suburbanization is beneficial
for both city’s government and its citizens,
providing new areas and opportunities for
residence, business, and development work.
However in the path to accommodate such
suburban development, many agricultural
households that were living in these areas
will be fundamentally affected during the
transition process. The paper gives insights
35
Vietnam Social Sciences, No. 5(169) - 2015
into the transition process of suburban
agricultural households despite several limiting
factors in sampling size and area which
reduce the implication level of the analysis.
One thing is clear that the fundamental
change in livelihood of agricultural farmers
is complex and henceforth demands more
than just financial measures to assess and
address the issue.
6. Patrick, G, Le Thi Huong, Tran Thi
Thanh Thuy, Nguyen Thi Thieng, Pham Thuy
Huong, Vu Hoang Ngan (2010), “Chapter 3:
Intra-Urban Mobility in Ho Chi Minh City and
Hanoi”. In The Vietnamese City in Transition,
edited by Patrick Gubry, Frank Castiglioni,
Jean-Michel Cusset, Nguyen Thi Thieng, Pham
Thuy Huong, Institute of Southeast Asian Studies.
7. Cẩm Tú (2014), “Hậu tái định cư: Chỗ ở
tốt hơn nhưng sống khó hơn”, (Post Immigration:
References
1. Fields, G. S. (1975), "Rural-urban Migration,
Urban Unemployment and Underemployment,
and Job-search Activity in LDCs." Journal of
Development Economics 2, No. 2, pp.165-187.
2. Hoàng Thị Thêu (2011), Nhập cư Tp. Hồ
Chí Minh và ảnh hưởng của nó đến biến động
dân số (Immigration to Ho Chi Minh City and
its Effects towards Population Changes), Master
Dissertation, Ho Chi Minh City University of
Pedagogy.
3. Ho Chi Minh City Institute of Development
Studies (HIDS) (2012), Báo cáo thuyết minh
tổng hợp Quy hoạch tổng thể phát triển kinh tế
- xã hội đến năm 2020, tầm nhìn đến 2025
(Report Plan of Developing Socio-economic to
2020, Vision to 2025).
4. Lê Thị Mỹ Hà (2012), Nông dân, nông
Better Accommodation but Worsening Living
Earning), Newspaper Ho Chi Minh Law.
Accessed on 15th September 2015, available at:
/>8. Ton Nu Quynh Tran, Quertamp Fanny,
Miras Claude de, Nguyen Quang Vinh, Le Van
Nam, Truong Hoang Truong (Eds) (2012),
Trends of Urbanization and Suburbanization in
Southeast Asia (Papers presented at Regional
conference
“Trends
of
Urbanization
and
Suburbanization in Southeast Asia” (CEFURDS,
LPED), Ho Chi Minh City, 9-11 December 2008),
Ho Chi Minh City General Publishing House.
- Fanny Quertamp, Claude de Miras. “Chapter
4: Periurbanization and Governance of Large
Metropolises in Vietnam”, 75 – 92.
thôn Tp. Hồ Chí Minh trong quá trình công
- Du Phuoc Tan. “Chapter 11: Periurbanization
nghiệp hóa, hiện đại hóa (Peasants, Agriculture
in Ho Chi Minh City – Identifications of Trends
of Ho Chi Minh City in the Process of
and some Solutions in Urban Management”,
Industrialization, Modernization), Research Project
181 – 193.
at Ho Chi Minh City Institute of Development
Studies (HIDS).
5. Mieszkowski, P & Edwin, S. M (1993),
“The Causes of Metropolitan Suburbanization”,
The Journal of Economic Perspectives: 135-147.
36
9. Statistical Office in Ho Chi Minh City,
Ho Chi Minh City Statistical Yearbook (1989,
1994, 1999, 2004, 2009, 2013).
10. Ministry of Natural Resources and
Environment (2013), Statistics of Land.
Pattern of Suburbanization in Ho Chi Minh City...
37