EXTRACTION AND CHARACTERIZATION OF CHITIN FROM CRUSTACEANS
Bạn đang xem bản rút gọn của tài liệu. Xem và tải ngay bản đầy đủ của tài liệu tại đây (2.39 MB, 9 trang )
0961-9534/93 $6.00 + 0.00
C 1993 Pergamon Press Ltd
&moss and BioenergyVol. 5, No. 2, pp. 145-153,1993
Printed in Great Britain. All rights reserved
EXTRACTION
AND CHARACTERIZATION
FROM CRUSTACEANS
N. ACOSTA*, C. JItiNEZt,
BoRAutand
V.
OF CHITIN
A. HERAS*$
??
Departamento
de Quimica Fisica Farmackutica, Facultad de Farmacia, Instituto Pluridisciplinar,
Universidad Complutense, E-28040 Madrid, Spain
TDepartamento de Quimica Organica, Facultad de Ciencias, Universidad de Cordoba, Avda San Albert0
Magno s/n, E-14004 Cbrdoba, Spain
(Received
I March 1993; revised received 28 June 1993; accepted
14 July 1993)
Ahstraet-Chitin
was isolated from various natural sources including Cuban lobsters, Sanlircar prawns,
Norway lobsters, Squills, Spanish crayfish, American crayfish and Fusarium oxysporum with a yield of
14-25% on a dry basis.
The physico-chemical properties of chitin from the different sources were studied by IR spectroscopy
and scanning electron microscopy, and its degree of acetylation was determined. The chitin thus obtained
is suitable for biotechnological applications (e.g. as supporting material for immobilizing enzymes).
Keywords-Chitin,
chitin isolation, IR spectroscopy, scanning electron microscopy, degree of acetylation.
INTRODUCTION
The term “chitin” is used to designate fibrillar
1,4-linked 2-acetamido-2-deoxy-/3-D-glucan.
This substance can be acetylated to a variable
extent and occurs in three polymorphic forms
(a, /.Iand y) and various degrees of crystallinity.
The term “chitosan” encompasses a wide range
of partially deacetylated derivatives of chitin.
The composition of chitin and its chitosan
content varies with its source, as well as with the
particular season, habitat and other environmental conditions.’
Chitin and chitosan are the only naturally
abundant polysaccharides with markedly basic
properties. In fact, chitin is a constituent of the
outer structure of insects, fungi and crustaceans.
Chitin is also significant because of its relationship to some components of foods of animal,
and fungal origin, and its potential medical and
pharmaceutical uses. Fungal chitin is readily
available for a variety of current and potential
uses in diverse fields.*
The structure of a- and /I-chitin has been
elucidated by the X-ray diffraction using rigidbody least-squares smoothing methods. The
polarity of neighbouring chains (anti-parallel in
a-chitin and parallel in /I-chitin) has also been
determined, as has the hydrogen bond network.’
The degree of acetylation of chitin and chitosan is a major parameter for their chemical
IAuthor to whom correspondence
should be addressed.
characterization which can be determined by
NMR of the solid and IR spectroscopy, potentiometry, mass spectrometry, and chemical or
enzymatic titration.4
Chitosan is highly reactive at its primary
amino group and its primary and secondary
hydroxyl functions. Both chitosan and chitin are
very hard solids that are insoluble in most
organic solvents and possess good mechanical
properties. In addition, they are biodegradable
and biocompatible, and very scarcely toxic, so
they make excellent supports for acid and basic
reagents and enzymes.
ideal supporting
materials
Traditionally,
should be inert and have no effect on the kinetic
behaviour of the biocatalyst they were intended
to host. However, comparative studieP have
shown dramatic differences in performance between enzymes supported on various materials.
In this respect, chitin possesses excellent properties for immobilizing enzymes.
In this work, chitin was isolated from various natural sources. Samples were characterized by IR spectroscopy and scanning electron
microscopy, as well as from the degree of acetylation, in order to test them as supports on
immobilization of enzymes.
2. MATERIALS AND METHODS
2.1. Materials
Chitin was obtained from crustacean shells
of different sources including Cuban lobsters
145
N. ACOSTAet al.
146
(Polinurus vulgaris), Sanhicar prawns (Penaeus
caramote), Norway lobsters (Nephrops norvegicus), squills (Squilla mantis), Spanish crayfish
(Astecus Juviabilis),
and American crayfish
(Astecus cambarus), specimens of which were
collected from the waste of a local seafood
restaurant. Fusarium oxysporum was cultivated
on potato dextrose broth medium at 25°C for
4 days. The procedure used for this purpose was
based on one described in detail elsewhere.7 The
end products were freeze-dried.
Commercially available chitin was purchased
from Sigma, while hydrochloric acid, sodium
hydroxide, acetone, potassium bromide, sodium
chloride and glutaraldehyde were supplied by
Merck. Phenol and cyclohexane were provided
by Scharlau (Barcelona, Spain) and sodium
Grinding
hypochlorite
was obtained
from Panreac
(Barcelona, Spain). All of the above chemicals
were of analytical reagent grade.
2.2. Methods
2.2.1. Isolation of chitin. The isolation procedure was applied three times to each type of
sample. Prior to use, shells from the various
sources were boiled for ca. 12 h in order to
remove soluble organics and binding protein,
and then dried at 80°C for 24 h. The dried shells
were ground to 24mm pieces and stored at
room temperature.
The procedure used to isolate chitin was a
modified version of a previously reported one.7
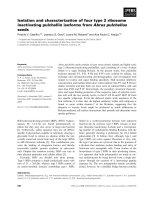
It involved the following steps (see Scheme 1):
and sieving
1N HCL at room temperature for 2h
15% NaOH
Deproteinization
Extraction
at 65°C for 3h
with acetone
Dilute
NaOCL
for 15min at
room temperature
Washing
Scheme
and drying
1. Isolation
of chitin.
Extraction and characterization
(a) Demineralization. Shell particles were
demineralized with 1 N HCl at room temperature and a solid-to-solvent ratio of 1: 15 (w/v)
under continuous stirring for 2 h, and then
washed repeatedly with distilled water to neutralize excess acid. After filtering, particles of
OS-2 mm diameter were obtained.
(b) Deproteination. Demineralized shell particles were brought into contact with a 15%
NaOH solution at 65°C and a solid-to-solvent
ratio of 1: 10 (w/v) for 3 h, after which they were
washed with distilled water and filtered.
(c) Bleaching. The product thus obtained was
extracted into acetone in order to remove the
pigment astaxanthin’ and then allowed to dry at
room temperature. Deproteinated samples were
bleached in 15% v/v NaClO/HCl at a solid-tosolvent ratio of 1: 10 (w/v) and room temperature for 15 min, and subsequently washed and
dried at 80°C for 12 h. The chitin thus obtained
was stored at 25°C prior to characterization.
2.2.2. Characterization procedures. The following procedures were used to characterize the
previously obtained chitin:
(a) IR spectroscopy. Infrared spectra of the
samples on KBr were recorded between 400 and
4000 cm-’ on a Bomen MB100 IR spectrophotometer. For this purpose, 8 mg of dry sample
was mixed with 10 g of also dry KBr in order to
make a 100mg pellet.
(b) Scanning electron microscopy (SE&i). The
SEM technique was used to characterize the
surface of chitin particles. Thus, dried particles
were coated with Au-Pd on a SEM Coating
Unit PS3 under a nitrogen atmosphere for 70 s
and then examined under an ISI-SX-25 scanning electron microscope.
(c) Estimation of the degree of acetylation. The
degree of acetylation of chitin was measured by
using a previously reported method.’
3. RESULTS AND DISCUSSION
3.1. Chitin yields
Table 1 lists the yields with which chitin was
obtained from the various sources. As can be
seen, they ranged between 14% and 23.8% (on
dry weight basis). The best results in this respect
(23.2-23.8%)
were provided
by common
lobsters, prawns, Norway lobsters and squills,
followed by Fusarium oxysporum and, finally,
Spanish and American crayfish. These results
are consistent with the fact that prawns,
Norway lobsters and squills belong to the same
species, whereas crayfish do not-the
last two
of chitin
141
Table I. Chitin yield of various sources
Sourcef
Yield (%)
Lobster
Prawn
Norway lobster
Squills
Spanish crayfish
American crayfish
14.2
23.2
23.6
23.8
14.5
14.1
Fusarium oxysporum
15.0*
*Dry weight of chitin/wet weight of mycelia.
order:
Polinurus
vulgaris,
Penaeus
Vn
caramote, Nephrops norvegicus, Squilla mantis.
Astecus jluviabilis, Astecus cambarus.
probably contain different amounts of carbonates and other salts and in addition to proteins,”
so their weight yields were lower.
The chitin yields obtained from crustacean
shells are comparable to those previously reported by other authors’ and to that of chitin
from Fusarium oxysporum and other fungi.”
3.2. Characterization of the chitin samples
The physico-chemical properties of the chitin
samples were studied by IR spectroscopy, scanning electron microscopy and the degree of
acetylation in order to characterize them as
potential biotechnological supports.
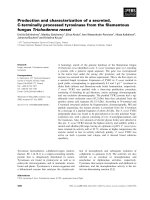
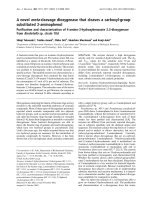
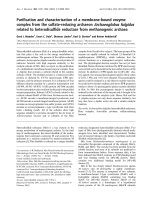
3.2.1. IR spectroscopy. Figure 1 (a, b) shows
the IR spectra of the chitin samples. All of them
are very similar, particularly as regards the
characteristic bands at 3450, 3265, 3102, 1666,
1622, 1574, 1435, 1430, 1361, 1315, 1250, 1113,
1020, 951 and 887cm-‘, consistent with previous observations of Gow et al.” on a-chitin;
however, no bands were observed at 972 or
632 cm-’ (these two are typical of fi-chitin).
The spectrum of chitin from Fusarium
oxysporum was different from the rest. Thus, the
relative intensity of the bands between 2968 and
2850 cm-’ was different from those of the other
chitins, which suggests a different interaction
between methyl groups. Also, chitin from
Spanish crayfish differed from the rest in the
intensity and width of the band at 1420 cm -‘.
Beran et al.,13 purified chitin from fungi,
showing that, in this case, the relative intensity
of the bands at 1630 and 955 cm-’ increases. As
can be seen, the intensity of the bands at 1630
and 955 cm-’ was smaller for chitin from Fusarium oxysporum than for the others. It thus seems
that the procedure used to isolate chitin from
this fungus yielded less pure chitin than did
crustacean shells. The presence of additional
impurities
may be the root of the interferences
encountered in the spectrophotometric determi-
148
N. ACOSTAet al.
Wavenumbers
(cm-l)
“0
.j
P
3
41
0
3000
Wavenumbrre
2000
(cm-l)
Fig. 1. Infrared spectra of chitin samples from various sources. (a) I. Squills (Sqda mantis); 2. Lobster
(Polinurus vulgaris); 3. Norway lobster (Nephrops norvegicus); 4. Prawn (Penaeus caramore). (b)
5. Fusarium oxysporum; 6. Commercial product; 7. Spanish crayfish (Asrecus~uviabilis).
nation of the number of free -NH, groups, as
shown below.
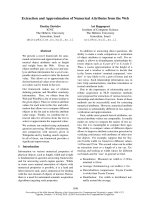
3.2.2. Scanning electron microscopy. Figure 2
shows the scanning electron micrographs obtained for the dry samples. As can be seen, the
surface appearance depends on the type (family,
species) of crustacean concerned.
Thus, the surface of chitin from lobster and
Spanish crayfish consists of fibres that form
parallel thread networks. This is consistent with
our IR results as regards the bands at 3265, 1630
and 955cm-’ for the a-structure, which, according to Blackwell,’ forms thread groups that
in turn make up images such as those observed
in our micrographs. The surface of chitin from
prawn shows scarcely fibrillar material and a
somewhat granular structure which is described
in the literature as a chitin-protein complex.‘4
However, this difference from prawn and
Spanish crayfish chitin in the photographed
surface was not reflected in the IR spectra where
Extraction and characterization
Fig. 2(a)
Fig. 2(b)
of chitin
149
50
Fig. 2(c)
Fig. 2(d)
Extraction and characterization
of chitin
Fig. 2(e)
Fig. 2. Scanning electron micrographs of dry surfaces of chitin from various sources. (b) Lobster
(Polinurus
ru~pris),
(b) Prawn (Penaeus carumofe),
(c) Spanish crayfish (Astecus
fluuiuhilis).
(d) Commercial product (e) Fusariu~ oxysporu&
the bands for this sample had an a-structure
identical with that of chitin from lobster.
The surface of commercially available chitin
and that obtained from Fusarium oxysporum is
somewhat different, they have a granular rather
than fibrillar appearance. This can be ascribed
to the polymorphic character of chitin, which is
also consistent with their IR bands: those of the
%-structure are weaker and more ill-defined,
(particularly
those of Fusarium oxysporum
chitin). The bands corresponding to the p-structure, which forms no fibres as no hydrogen
bonds are established between threads-so they
can swell and form hydrates-are
also observed.
From the above results and those obtained by
IR spectroscopy, one might conclude that chitin
from lobster and Spanish crayfish is preferentially a-structured
since its surface shows
sharper fibres, whereas that commercially available and fungal chitin, is more granular, which
is consistent with a p-structure or a less marked
a-structure.
3.2.3. Degree of acetylution. The degree of
acetylation of chitin can be determined by 14NNMR or 13C-NMR spectroscopy, or even UV
spectrophotometry
at 199 nm.4 However, the
determination is hindered by the fact that the
polymer is insoluble in most common organic
solvents.
Some authors use IR spectroscopy’5-~‘s or a
benzylation procedure” to determine the degree
of 0-acetylation and N-acetylation of chitin.
These methods, however, may be subject to
major experimental errors.
There are a number of available heterogeneous catalysis methods for the determination
of acid and basic surface sites.20.2’Essentially, all
entail measuring the amount of titrant (and acid
or base) retained in the solid monolayers. On
the assumption that each titrant molecule is
adsorbed at one active site, the number of acid
or basic surface sites can readily be calculated.
In dilute enough solutions, the titrant can act
as a gas and its adsorption on a solid be fitted
to a Langmuir isotherm of the form:
c/s
=&++
m
where X is the amount of titrant adsorbed per
gram of solid at a given temperature, b the
Langmuir constant, X,,, the amount of titrant
adsorbed in monolayer form per gram of solid,
and C the dissolved titrant concentration in
equilibrium with the adsorbed concentration, X.
By plotting C/x against c (an amount) one
obtains a straight line whose slope provides X,,,,
a measure of the solid acidity or basicity at a
given temperature.
N. ACOSTAer al.
152
Table 2. Amount of phenol adsorbed in monolayer form by
the various chitin samples
Sourcet
Lobster
Prawn
Norway lobster
Squills
Spanish crayfish
American crayfish
XIII
(mol g-’ chitin) x 10e6
5.4
5.8
5.6
3.2
3.3
3.4
Fusarium oxysporum
Commercial product
3.1
?In order: Polinurus vulgaris, Penaeus caramote, Nephrops
norvegicus, Squilla mantis, Astecus fluviabilis, Astecus cam barus.
As noted earlier, the IR spectrum of Fwarium
oxysporum chitin was different from the rest.
Consequently, the above-mentioned impurities,
which are not removed in the purification of
chitin, are responsible for the peculiar behaviour of this sample.
Acknowledgements-The
authors wish to thank Dr M. I. G.
Roncero for kindly supplying the Fusarium oxysporum used.
Financial support from the Spanish CICYT (Project FAR
88-0276/2) and the Programa Iberoamericano 1990 is also
gratefully acknowledged.
REFERENCES
The amount of titrant adsorbed by our
samples at each point along the isotherm was
determined spectrophotometrically
using the
method of Marinas et a1.9-22over the concentration range where Beer’s law was obeyed.
Active sites in chitin were titrated with pyridine
dissolved in cyclohexane, while basic sites
(-NH, groups) were titrated with phenol dissolved in cyclohexane.
Identical results were obtained if x (the
amount of titrant adsorbed per gram of solid)
was determined by plotting X vs. C (the concentration of dissolved titrant in equilibrium with
the amount of adsorbed titrant, X).
Table 2 lists the X,,, values obtained in the
titrations with phenol dissolved in cyclohexane.
As can be seen, chitin from common lobster,
prawn and Norway lobster adsorbed the largest
amounts of phenol in monolayer form (ca.
5 x 10P6mol gg’ chitin). On the other hand, the
remaining
samples adsorbed
an average
3 x 10m6mol g-’ chitin. Taking into account
that the interaction between amino groups and
phenol conforms to a 1: 1 stoichiometry, chitin
from the former group of samples (the first
three in Table 2) and that from prawn in
particular, contains the most deacetylated units
in its structure.
Chitin from Fusarium oxysporum did not
allow the amount of phenol adsorbed to be
determined because the final absorbance of the
phenol solutions brought into contact with the
solid exceeded the initial absorbance, so the
amine was not retained at the surface, but
adsorbed dissolved species that were responsible
for the increased absorbance obtained. This
may have arisen from the presence of foreign
substances that were also dissolved and degraded the chitin structure to some extent
during titration, which might have had an
adverse effect on the measurements.
S. Hirano, Production and Application of Chitin and
Chitosan in Japan, pp. 33-44. Elsevier Applied Science
(1989).
R. A. A. Muzzarelli, The Polisaccharides, Vol. 3,
Chapter 6, pp. 417450. Academic Press, Orlando
(1985).
J. Blackwell, Biomolecular Structure, Conformation,
Function and Evolution (R. Srinivasa, Ed.), pp. 525-535.
Pergamon, Oxford (1980).
R. A. A. Muzzarelli, New Developments in Industrial
Polysaccharides (V. Crescenzi and 1. C. M. Dea, Eds).
Gordon and Breach, New York (1984).
M. Reslow, P. Adlercreutz and B. Mattiasson, On
the importance of the support material for bioorganic synthesis. Influence of water partition between solvent, enzyme and solid support in water-poor
reaction media. Eur. J. Biochem. 172, 573-578,
(1988).
6. A. Heras, M. T. Martin, N. Acosta and F. DebaillonVesque, Biocatalysis in Non-Conventional
Media
(J. Tramper et al., Eds). Influence of the solvent and the
solid support on the microenvironment of immobilized
a-chymotrypsin. Progress in Biotechnology 8, 339-346
(1992).
K. H. No, S. P. Meyers and K. S. Lee, Isolation and
characterization of chitin from crawfish shell waste.
J. Agric. Food Chem. 37, 575 (1989).
8. P. V. Kamasatri and P. V. Prabhu, Preparation of chitin
and glucosamine from prawn shell waste. J. Sci. fnd.
Res. ZOD, 466 (1961).
9. M. A. Aramendia, V. Borau, C. Jimenes, J. M. Marinas
and F. Rodero, Acidity determination of several catalysts by various procedures. Colloid Surfaces 12,
2277238 (1984).
10. P. R. Austin, C. J. Brine, J. E. Castle and J. P. Zikakis,
Chitin: New facets of research, Science 212, 749-753
(1981).
II. W. J. Mcgahren, G. A. Perkinson, J. A. Growich, R. A.
Leese and G. A. Ellestad, Chitosan by fermentation.
Proc. Biochem. 19(3), 88-90 (1984).
12. N. A. R. Gow and G. W. Goodday, Infrared and X-Ray
diffraction data on chitins of variable structure. Carbohydr. Res. 165, 105-I 10 (1987).
13. K. Beran, Z. Holan and J. Balbrain, The Chitin-Glucan
complex in Saccharomyces cerevisiae. I. IR and X-Ray
observations. Folia Microbial. (Prague) 17, 322-330
(1972).
14. A. G. Walton and J. Blackwell, Biopolymers,
pp. 474489, Academic Press (1973).
15. T. Sannan, K. Kurita, and Y. Iwakura, Studies on
chitin. V. Kinetics of deacetylation reactions. Polymer
19, 452 (1978).
16. M. Miya, R. Iwamoto, S. Yoshikawa and S. Mima, IR
spectroscopic determination of CONH content in highly
Extraction and characterization
deacylated chitosan. Int. J. Biol. Macromol. 2, 323
(1980).
17. G. K. Moore and G. A. F. Roberts, Reaction of
chitosan: 2. Preparation and reactivity of N-acyl
derivatives of chitosan. Inr. J. Biol. Macromol. 2, 292
(1981).
18. G. K. Moore and G. A. F. Roberts, Determination of
degree of N-acetvlation of chitosan. Int. J. Biol. Macrom&‘. 2, 115 (1986).
19. J. Tingda and L. Fundao, IR spectroscopic determination of the degree of substitution of benzyl chitins,
Inr. J. Biol. Macromol. 9, 54 (1987).
of chitin
153
20. K. Tanabe, H. Hattori, T. Yamakuchi and T. Tanaka,
Acid-Base Catalysis, Proceedings of the International
Symposium on Acid-Base Catalysis, Rodansh Ed.,
Sapporo (1988).
21. K. Tanabe, M. Misono, Y. Ono and H. Hattori. New
Solid Acids-Bases. Their Catalytic Properfies, Elsevier.
Tokyo (1989).
22. J. M. Marinas, C. Jimenez, J. M. Campelo, M. A.
Aramendia, V. Rorau and D. Luna, Actas 7” Simposio
Ibero-Americano de Catalisis, Valoracion espectrofotometrica de bases absorbidas por diferentes soportes y
sistemas metalicos, 77-88 (1980).