Trade as an Engine of Growth: Patterns, Potential, and Problems
Bạn đang xem bản rút gọn của tài liệu. Xem và tải ngay bản đầy đủ của tài liệu tại đây (1.15 MB, 22 trang )
Chapter 1
Trade as an Engine of Growth:
Patterns, Potential, and Problems
Introduction
Trade has been integral to Zimbabwe’s growth since the days of antiquity. The
Great Zimbabwe Kingdom and the Mutapa Empire from the 13th century and
later based their astounding civilizations on trading gold, copper, and ivory in
exchange for cloth and other artifacts from as far away as China. Today, trade is
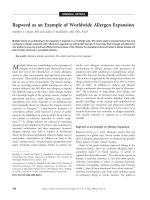
more important than ever. Modern day Zimbabwe enjoys one of the highest
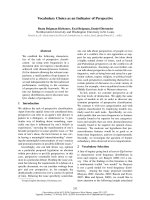
trade shares in GDP of continental Africa (figure 1.1, panel a). And since 1990,
increases in exports have been positively associated with growth in standards of
living as measured by GDP growth (figure 1.1, panel b). Trade is vital to growth
in Zimbabwe. Without export growth, the economy as a whole cannot
long prosper.
Several econometric studies have shown that trade has been an engine of
growth in other countries as well as in Zimbabwe. Of 14 major econometric
studies since 2000 exploring the relationship of trade to growth, 13 find a
strong positive relationship.1 Brückner and Lederman (2012) find that a
1 percentage point increase in the ratio of trade to GDP is associated with
a short-term increase in growth of approximately 0.5 percent per year, and
an even larger effect in the long term, reaching about 0.8 percent after
10 years.
In Zimbabwe, trade has once again begun to power economic growth. Since
dollarization and liberalization in 2009, exports have grown at an average annual
rate of 39 percent through 2012. This growth coincided with the incipient global
recovery from the Great Recession, resurgent commodity prices, and increasing
demand from China for raw materials, but the domestic revival of the price and
payment systems were arguably more important.
The government has recognized the importance of trade to economic
prosperity. In its National Trade Policy (2012–2016) (Ministry of Industry and
Trade in Zimbabwe •
37
38
Trade as an Engine of Growth: Patterns, Potential, and Problems
Figure 1.1 The Importance of Trade in Zimbabwe
a. Merchandise trade by country, Sub-Saharan Africa, 1990–2012
250
Zimbabwe
Percent of GDP
200
150
100
50
19
9
19 0
9
19 1
9
19 2
9
19 3
9
19 4
9
19 5
9
19 6
9
19 7
9
19 8
9
20 9
0
20 0
0
20 1
0
20 2
0
20 3
0
20 4
0
20 5
0
20 6
0
20 7
0
20 8
0
20 9
1
20 0
1
20 1
12
0
b. Export growth and GDP growth in Zimbabwe
0.4
2009
GDP growth (% change)
2011
0.2
2010
1996
2012
1999
1994
2001 2004
1995
1991
2005
1993 2000
1997
2002
2007 2006
2003
0
2008
–0.2
1998
1992
–0.4
–0.2
0
0.2
0.4
Export growth (% change)
0.6
0.8
Source: World Bank, World Development Indicators, />-development-indicators.
Commerce, n.d., vii), it set out important trade-related objectives as in the
following statements:
• “strategies that will enable trade to be the engine for sustainable economic
growth and development”
• “transform Zimbabwe from being an exporter of primary commodities to an
exporter of value added high quality processed goods and services”
Trade in Zimbabwe • />
Trade as an Engine of Growth: Patterns, Potential, and Problems
• “seeks to diversify the country’s exports, expand and explore new markets, as
well as promote the consumption of locally produced goods and services”
This chapter explores Zimbabwe’s major trading patterns. It focuses on three
questions:
• What trends dominate Zimbabwe’s trade performance?
• Have exports become more diversified and with increasing value added and
greater technological content?
• Is the recent export surge the harbinger of a sustained export-driven
expansion?
The first section explores patterns of Zimbabwe’s trade performance, focusing
on trend expansion of exports and changes in its major trading partners. The
second section zeros in on the composition of Zimbabwean exports to look at
diversification, technological content, and employment intensity. The third
section looks forward to briefly review the macroeconomic and investment
climate prerequisites for mounting an export-led surge to a sustained highergrowth plateau.
Zimbabwe’s Trade Performance: Growth and Direction
Mining Has Led the Rebound
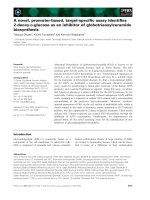
The trade rebound since 2009—for both exports and imports—has been astonishing (figure 1.2).2 Exports surged from US$1.6 billion to US$5.2 billion in
2011. Imports grew somewhat more slowly but more in total value, from about
Figure 1.2 Zimbabwe’s Exports and Imports, 1990–2012
8,000
7,000
US$, millions
6,000
5,000
4,000
3,000
2,000
1,000
19
9
19 0
9
19 1
9
19 2
9
19 3
9
19 4
9
19 5
9
19 6
9
19 7
9
19 8
9
20 9
0
20 0
01
20
0
20 2
03
20
0
20 4
0
20 5
0
20 6
0
20 7
0
20 8
0
20 9
1
20 0
11
20
12
0
Exports
Imports
Source: Based on data from Reserve Bank of Zimbabwe at />
Trade in Zimbabwe •
39
40
Trade as an Engine of Growth: Patterns, Potential, and Problems
US$3.2 billion to more than US$7.2 billion in 2011. Mineral exports drove twothirds of the increase, led by substantial increases in diamonds, platinum, and
gold. Agriculture, mainly tobacco and cotton lint, accounted for virtually all of
the remaining increase. The contribution of manufacturing actually declined during this period, continuing its decade-long slide.
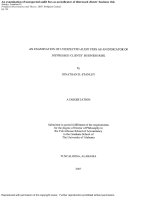
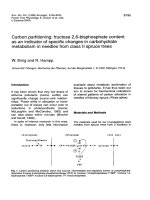
The impressive increase in nominal exports resulted from a mixture of both
volume and price effects in minerals and agriculture (figure 1.3).3 Mining
volumes rose eightfold and prices of precious metals on world markets nearly
doubled, supported by the coming on stream of diamond mines from the
Figure 1.3 Volumes and Prices of Exports
a. Export volume
Volume index (2008 = 100)
1,600
1,400
1,200
1,000
800
600
400
200
95
96
19
97
19
98
19
99
20
00
20
01
20
02
20
03
20
04
20
05
20
06
20
07
20
08
20
09
20
10
20
11
20
12
19
94
19
19
19
93
0
b. Export prices
200
Volume index (2008 = 100)
180
160
140
120
100
80
60
40
20
19
9
19 0
9
19 1
9
19 2
93
19
9
19 4
9
19 5
9
19 6
9
19 7
9
19 8
99
20
0
20 0
0
20 1
0
20 2
03
20
0
20 4
0
20 5
06
20
0
20 7
0
20 8
0
20 9
1
20 0
11
20
12
0
Manufacturing
Mining
Agriculture
Precious metals
Sources: Based on Reserve Bank of Zimbabwe data at World Bank, World
Development Indicators, at />
Trade in Zimbabwe • />
Trade as an Engine of Growth: Patterns, Potential, and Problems
Marange deposits. Similarly, agriculture experienced sharp increases in
volumes—nearly double 2009 levels—and price rises contributed another
10 percent to nominal values during the period. The small increase in
manufacturing nominal export values was explained almost entirely by the
recovery in volume.
The Long-Term Picture Reveals Disquieting Trends
Despite the recent increase, export performance since 1990 has been lackluster.
Exports declined from 1996 to 2009 (figure 1.2). Mining volumes were flat
through 2009, and agricultural volumes contracted by nearly two-thirds relative
to 2001;4 even with the export surge after 2009 agricultural volumes achieved
levels still one-third lower than their levels in 2001. Manufacturing performance
was even worse. The sector fell by two-thirds relative to its peak in 1995, and
even after the rebound through 2011, export production stood some 60 percent
lower than peak levels.
On the surface, when distinguishing between the effects of changes in world
prices and changes in volumes, the underlying picture is much bleaker: volumes
in agriculture and manufacturing remain well below their peaks in the mid to
late 1990s (figure 1.3). Agricultural exports, other than tobacco and cotton, have
lost their once dominant role in the region, and have made only a marginal contribution to the post-2009 recovery. They are no longer a source of diversification. Manufacturing has continued to wither in secular decline, and even though
many firms are operating at less than 60 percent capacity, manufacturing firms
seem unwilling or unable to sell their wares abroad. Services exports also have
grown slowly.
This sluggish long-term performance stands in sharp contrast to the progressive
increases in the total value of exports from neighboring and comparator countries. Since 2000, Zimbabwe has lagged behind Kenya, Zambia, Malawi, and
Tanzania in export growth (figure 1.4). If Zimbabwe’s exports had grown at a
pace as rapid as Kenya’s and Zambia’s, their value could have surpassed
US$20 billion instead of topping out at US$5.2 billion.
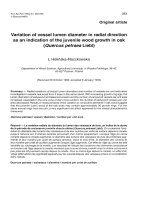
A careful decomposition of export growth underscores this point (figure 1.5).
During the 1990s, the contribution to export growth of the four potential
sectoral drivers—agriculture, mining, manufacturing, and services—was relatively balanced. However, by the start of the new century, a new pattern
emerged. Only minerals contributed significantly and positively to export
growth before the poststabilization period. The manufacturing sector’s contribution to export growth has been persistently negative throughout the
past decade.
Changing Export Destinations: South Africa and China Up, European
Union Down
The direction of Zimbabwean trade shifted sharply from the European Union
(EU) to South Africa between 2000 and 2008.5 The share of South Africa in
Trade in Zimbabwe •
41
42
Trade as an Engine of Growth: Patterns, Potential, and Problems
Figure 1.4 Exports of Zimbabwe and Comparator Countries, 1990–2012
10,000
9,000
US$, millions
8,000
7,000
6,000
5,000
4,000
3,000
2,000
1,000
19
9
19 0
9
19 1
9
19 2
9
19 3
9
19 4
9
19 5
9
19 6
9
19 7
9
19 8
9
20 9
0
20 0
0
20 1
0
20 2
0
20 3
0
20 4
0
20 5
0
20 6
0
20 7
0
20 8
0
20 9
1
20 0
1
20 1
12
0
Zimbabwe
Kenya
Malawi
Zambia
Tanzania
Mozambique
Source: Edwards and Kirk 2013.
Figure 1.5 Mining Drives Postrecovery Export Rebound
100
80
Percent contribution
60
40
20
0
–20
–40
–60
–80
–100
1993–2000
Agriculture
2001–2008
Mining
Manufacturing
2009–2012
Services
Source: Based on Reserve Bank of Zimbabwe data at />
Zimbabwean exports rose from 10.2 percent in 2000 to 35.6 percent in 2008,
before falling to 20 percent in 2011. Meanwhile, the share of exports destined
for the EU fell from 41.1 percent to 23.6 percent in 2008 before reviving to
30.0 percent in 2011. The main contributing factor to the decline in South
Africa’s share appears to be Standard International Trade Classification category
28-metalliferous ores and metal scrap, which is made up largely of nickel ore, the
price of which plummeted in 2009 (Edwards and Kirk 2013).
The other big shift occurred with China. Zimbabwe’s exports to China rose
from 5.7 percent to 7.0 percent in 2008 then surged to 22.0 percent in 2011
Trade in Zimbabwe • />
43
Trade as an Engine of Growth: Patterns, Potential, and Problems
Figure 1.6 Trade Partners: Consolidating Regional Partners and Gaining Others
a. Exports to China
900
800
US$, millions
700
600
500
400
300
200
100
11
20
10
20
09
20
08
20
07
20
06
20
05
20
04
20
03
20
02
20
01
20
20
00
0
b. Imports from South Africa
2,500
US$, millions
2,000
1,500
1,000
500
EU-27
Rest of SSA
South Africa
China
11
20
10
20
09
20
08
20
07
20
06
20
05
20
04
20
03
20
02
20
01
20
20
00
0
Source: Edwards and Kirk 2013.
Note: EU-27 = European Union 27; SSA = Sub-Saharan Africa.
(figure 1.6, panel a). Exports to China rose dramatically from 2010 on the
strength of huge mineral exports. As of 2011, China is the second biggest destination for Zimbabwean exports.
South Africa continues to dominate as the primary source of Zimbabwean
imports, making up 57 percent of the value of imports in 2011. This number is
slightly lower than South Africa’s 2008 share, given that imports from China and
the rest of the world have increased.
Trade in Zimbabwe •
44
Trade as an Engine of Growth: Patterns, Potential, and Problems
Regional Trade: Rebound to Neighboring Economies
Zimbabwe’s neighbors account for a high share of exports and an unusually high
share of its imports. Sub-Saharan Africa accounted for nearly 30 percent of
Zimbabwe’s exports. South Africa alone accounted for 20 percent of Zimbabwean
exports and 57 percent of its imports in 2011 (Edwards and Kirk 2013).
However, the relative importance of Sub-Saharan Africa as a destination for
Zimbabwean exports has declined with the growth recovery. Much of this
decline can be attributed to the dramatic decline in the value of exports to China
from South Africa in 2008. Although exports to South Africa recovered in 2011,
the increase was not sufficient to offset the earlier fall (figure 1.6, panel a). The
value and share of exports to the rest of Sub-Saharan Africa have also fallen. In
the middle of the first decade of the 2000s, the rest of Sub-Saharan Africa made
up 15 percent of Zimbabwean exports. By 2011, this share had fallen to slightly
less than 10 percent. The main contributors to this decline were Zambia and
Malawi, where export values fell sharply. Exports to the rest of Sub-Saharan
Africa recovered slightly from the trough of 2009, but this growth in exports
lagged behind growth of exports to other regions (China and the EU-27).
Zimbabwean imports are even more dependent on the region than are exports
(figure 1.6, panel b). As the Zimbabwean economy has recovered, imports have
risen from all major sources, including Sub-Saharan Africa. Five of the top
10 import sources are in Sub-Saharan Africa and include (in order of importance) South Africa, Zambia, Botswana, Malawi, and Mozambique. Altogether,
74 percent of Zimbabwean imports are sourced from Sub-Saharan Africa,
although the bulk of this share (57 percentage points) is sourced from South
Africa. Nevertheless, the share of total imports sourced from the rest of SubSaharan Africa is substantially higher than the share of the rest of Sub-Saharan
Africa in total Zimbabwean exports.
Composition of Trade: Lingering Vulnerabilities
Increasing the volume of exports is an important objective, but the composition
of those exports is no less important. The government has consistently held the
objective of diversifying away from commodity dependence and upgrading the
technological content of exports and the labor intensity of trade as a way to
improve the sustainability of trade-led growth.
Export Diversification: Unintended Reversal
The Zimbabwean government’s National Trade Policy (2012–16) (Ministry of
Industry and Commerce, n.d.) put significant emphasis on diversification.
The literature suggests that this focus is well founded. Export diversification may
improve growth through several channels. For example, diversification makes
countries less vulnerable to adverse terms-of-trade shocks by stabilizing export
revenues (Ghosh and Ostry 1994; Lederman and Maloney 2012). Other
studies have found that terms-of-trade-induced income volatility depresses longterm growth, in part by impairing human capital through ratchet effects,
Trade in Zimbabwe • />
Trade as an Engine of Growth: Patterns, Potential, and Problems
as unemployed workers lose contacts and skills and younger workers forgo
education to support themselves during downturns (Lutz and Singer 1994;
Easterly and Kraay 2000). Furthermore, cumulative investment in traditional
products will in most cases eventually exhaust the activity-specific economies of
scale and lead to stagnating or decreasing returns. In addition, knowledge spillovers from exporters (such as information on foreign quality specifications,
production processes, and management techniques), combined with increasing
returns to scale, create learning opportunities that lead to new forms of comparative advantage, and these spillovers tend to be more common in manufactures
than in primary commodities. Finally, Pritchett and others (2005) argue that
when exports are limited to a few minerals, rents from primary commodities are
associated with poor governance.
Some studies have found an empirical relationship between export diversification and growth. Al-Marhubi (2000) finds using cross-section data that export
diversification boosts growth; Piñeres and Ferrantino (1999) establish that export
diversification is associated with income growth in Latin America; and Feenstra
and Kee (2004) estimate that export product variety explains 13 percent of productivity gains in 34 industrial and developing countries. Hammouda and others
(2009) find that deepening diversification has been associated with increases in
total factor productivity in Sub-Saharan Africa.6 Hesse (2008) provides robust
empirical evidence of a positive effect of export diversification on growth of per
capita income in developing countries.
Diversification through a Prism
Export diversification can be analyzed through the prism of three lenses. The first
is the calculation of a simple Herfindahl concentration ratio that captures the
dominance of the leading products—platinum, gold, diamonds, tobacco, cotton
lint, and other processed commodities—in the total export basket. By this measure and using Reserve Bank of Zimbabwe (RBZ) data on the portfolio of product exports, the export basket of Zimbabwe has become markedly more
concentrated during the past decade (figure 1.7).
Variety Counts: Fewer Products Sold in Fewer Markets
Peering beneath the aggregate trends using a second lens illuminates the diversification process. Zimbabwe exports a comparatively broad range of products to
a relatively wide range of countries. For example, Zimbabwe exported 564 out
of 780 possible products in 2011. Many of the trade values are low and some of
these products may be reexported, but the trade data suggest a relatively broad
base from which exports can grow.
However, during the past decade Zimbabwe has experienced a steady retreat
from diversification. Diversification can take the form of adding a new product
to the export basket, or selling an established export product to a new market
(that is, a new country trading partner). One way to measure product and market
diversification is to simply count the number of product-markets that Zimbabwe
reaches, referring to each product-market combination as a different “variety.”7
Trade in Zimbabwe •
45
46
Trade as an Engine of Growth: Patterns, Potential, and Problems
Figure 1.7 Rising Product Concentration
0.16
0.14
Herfindahl index
0.12
0.10
0.08
0.06
0.04
0.02
12
20
10
20
08
20
20
06
04
20
02
20
00
20
98
19
96
19
94
19
92
19
19
90
0
Source: Based on UN Comtrade mirror data at />
Figure 1.8 The Export Portfolio Is Becoming Less Diversified
Number of trade varieties
7,000
6,000
5,000
4,000
3,000
2,000
1,000
Imports
11
20
10
20
09
20
08
20
07
20
06
20
20
05
20
04
03
20
20
02
20
01
20
00
0
Exports
Source: Edwards and Kirk 2013.
Although the number of import varieties has ranged between 5,000 and
6,000 since 2000, exports show a steady retreat from diversification (figure 1.8).
The number of export varieties fell consistently nearly every year. In 2000,
Zimbabwe exported 4,377 varieties. By 2008, this number had fallen to 2,715
and has risen only slightly with the economic rebound. The decade-long trend in
Zimbabwe, contrary to the objective boldly set forth in the national export strategy of increasing diversification, is headed downward.
The key driver of this decline is the ever-narrower range of products exported.
Although the number of country partners held steady, the number of products
exported fell from 681 to 552. The decline in the number of export varieties
Trade in Zimbabwe • />
47
Trade as an Engine of Growth: Patterns, Potential, and Problems
Mozambique
Kenya
Zambia
Malawi
Tanzania
South Africa
20
11
20
10
20
09
20
08
20
07
20
06
20
05
20
04
20
03
20
02
20
01
200
180
160
140
120
100
80
60
40
20
0
20
00
Number of product-market
combinations (index, 2000 = 100)
Figure 1.9 Zimbabwe’s Export Diversification in Contrast with That of Other
African Countries
Zimbabwe
Source: Edwards and Kirk 2013.
tapered off in 2008 and since 2010 has risen very slightly, driven by a slight
recovery in the number of export destinations and the range of products
exported. The implication is that the strong growth in the value of exports during
the economic recovery appears to have been driven by exports of existing products rather than by diversification.
This trend for Zimbabwean exports contrasts starkly with comparator
countries, all of which experienced a rise in export varieties (figure 1.9). For
example, Kenya, a larger and more diversified economy, increased the number of
export varieties by more than 40 percent during 2000–08. But even smaller
African countries that began the period with far less diversified export portfolios
than Zimbabwe trended sharply toward greater diversification. This situation
also holds in the post-2009 period, in which only South Africa and Malawi experienced slower growth in export varieties.
Traditional Goods to Known Markets Drive Exports
A third lens for analyzing diversification is a decomposition of the value that
existing products and existing markets (the “intensive margin”) contribute to
growth compared with the contribution of new products and new markets (the
“extensive margin”). Whereas the previous analysis simply counts the number of
product-market combinations, this decomposition highlights the contribution of
diversification to export growth. Table 1.1 decomposes Zimbabwean exports
into growth between new destinations and new products, and growth in value of
old varieties. The intensive margin denotes the growth in trade value that can be
attributed to product varieties that Zimbabwe exported (or imported) at the
beginning of the period in 2000. The extensive margin is made up of trade in new
products or new destinations.
Trade in Zimbabwe •
48
Trade as an Engine of Growth: Patterns, Potential, and Problems
Table 1.1 Growth of Extensive and Intensive Margins in Zimbabwean Exports
and Imports
Percentage change from base year
Intensive margin
Growth
Net growth
of initial
year
varieties
Extensive margin
Of which:
Growth of
surviving
varieties
New
Death of destinations
initial year (new origins
New
varieties for imports) products
Exports
2000–08
2008–09
2009–11
Imports
2000–08
2008–09
2009–11
21.8
−50.3
89.9
6.9
−53.6
52.1
31.2
−19.9
65.0
−24.2
−33.7
−12.9
14.7
3.1
37.3
0.1
0.2
0.5
76.8
−4.1
79.5
52.0
−7.2
70.9
69.4
−2.8
74.7
−17.5
−4.3
−3.8
24.6
3.0
8.5
0.2
0
0
Source: Edwards and Kirk 2013.
Note: Sample consists of 129 importing countries with reported trade data in the UN Comtrade database in
each year from 2000 to 2011. Data are at four-digit level of Standard International Trade Classification Rev.2.
The intensive margin is made up of (1) growth of surviving varieties and (2) death of initial year varieties. New
destinations extensive margin refers to exports of existing products to new destinations. New products
extensive margins refers to entry into new product categories.
The decomposition reveals a high degree of churning or export dynamics that
underpin aggregate export performance. Between 2000 and 2008, merchandise
exports grew by only 21.8 percent (or an average of 2.1 percent per year). This
slow growth can be attributed to two factors. At the intensive margin, the discontinuation of export varieties present at the outset of the period lowered the
value of exports by 24.2 percent. This impact was offset by increases in the value
of surviving variety exports, but with a contribution of only 31.2 percent, the net
effect on overall export growth was low (6.9 percent).
Looking at the extensive margin, new variety exports raised the value of
exports by 14.8 percent (14.7 percent + 0.1 percent) from 2000 to 2008. Most
of this margin is made up of the export of existing products to destinations with
which trade in other products already occurred. Existing channels of information, market linkages, or preference agreements (see chapter 2) developed
through the export of one product may therefore reduce the cost of exporting
other existing products into that market. The contribution to export growth of
new products to new destinations is less than half a percentage point. Diversification
into new products has therefore contributed little to export growth.8 Overall,
therefore, the failure to diversify sufficiently into new products, combined with
the death of initial year varieties and slow growth of surviving varieties, contributed to weak export growth from 2000 to 2008.
The period 2008–09 differs from the earlier period in that the value of exports
fell by more than 50 percent. This decline was driven by negative growth in
surviving varieties (19.9 percent), but even more so by the exit from existing
Trade in Zimbabwe • />
Trade as an Engine of Growth: Patterns, Potential, and Problems
varieties (33.7 percent). New products and new destinations (extensive margin)
raised exports marginally. These outcomes are not unexpected. The decline in
world growth led to a sharp reduction in global imports, which negatively
affected Zimbabwean exports through reductions in commodity prices and
reductions in demand. The decline, however, also arose from particular supply
constraints faced by domestic exporters (see chapter 2).
The post-2009 recovery period has been driven by improved export performance along both the intensive and extensive margins. Exports have risen by close
to 90 percent in this period with more than two-thirds of this growth arising from
growth in exports of surviving varieties. Exports of existing products to new destinations also contributed strongly to growth, raising exports by 37.3 percent.
The contribution of new product categories, however, remained very low.
In summary, by all three measures, Zimbabwean exports appear to be becoming less diversified. Not only is Zimbabwe becoming more dependent on a few,
mainly mineral, exports but it is failing to introduce new varieties and develop
new products. No less disheartening, it seems comparator countries are diversifying at a faster pace.
Factor Intensity: Retreat from Technology Intensity and Labor Intensity
Another objective of policy is to increase the technological content of exports.
Adapting the optic developed by Landesmann and Stehrer (2002) provides
insight into the technology and labor content of exports. Their work d
istinguishes
among three broad categories of production activities: (1) low-technology and
labor-intensive activities, (2) resource-intensive activities, and (3) medium- to
high-technology production activities. Low-technology and labor-intensive
activities include, among others, agricultural foods and feeds, some animal and
vegetable oils, simple manufactured goods, and textiles and clothing. Resourceintensive activities, accounting now for about two-thirds of Zimbabwe’s total
exports, cover such sectors as mining, steel and iron, and simple industrial products based on intensive use of natural resources (for example, wood materials,
cement, alloys, and so forth). Medium- to high-technology-intensive products
include machinery and transport equipment as well as some miscellaneous
manufactures such as furniture parts and medical instruments.
In the long term, the technology content of Zimbabwe’s exports has barely
registered on export charts (figure 1.10 and table 1.2). Through 2011, exports of
low-technology and labor-intensive products exhibited little growth from its
peak in 1997. Although the post-stabilization bounce was high, figures since
seem to have regressed to the mean.9
An implication of this pattern of export growth is that the impulse to create
jobs, particularly for unskilled labor, has attenuated over time. As manufactures,
and to a lesser extent, diversified agriculture, have given way to mining in export
composition, the capital intensity of production has risen. One offsetting factor
has been the revived output of smallholder tobacco production, which has
created some jobs in the rural sector although it has done little to help raise the
technological content of exports. Still, this trade pattern has created demand for
Trade in Zimbabwe •
49
50
Trade as an Engine of Growth: Patterns, Potential, and Problems
Figure 1.10 Increasing Dominance of Resource-Intensive Exports
3,000
US$, millions
2,500
2,000
1,500
1,000
500
11 a
20
09
20
07
20
05
20
03
20
01
20
99
19
97
19
95
19
19
93
0
Low-technology, labor-intensive exports
Resource-intensive exports
Medium- to high-tech exports
Source: Reserve Bank of Zimbabwe data at />a. Projected data.
more-skilled labor and imparted a skill-bias to the growth path, and with it,
tendencies toward greater income inequality.
Looking Forward: Consolidating Current Stability to Accelerate
Export Growth
The outlook for sustained export growth that might in turn power more rapid
economic growth is heavily dependent on global developments and the domestic
macroeconomic environment. Both give cause for concern. Even though the
global recovery is slowly building momentum, the international environment is
exposed to new uncertainties arising from slowing growth in China, persistent
slow growth in Europe associated with deep recession in its south, and the course
of monetary and fiscal policy in the United States. These conditions weigh heavily on prices of Zimbabwe’s commodity exports: prices are projected to fall relative to 2012 levels for platinum, gold, maize, and tobacco while cotton prices are
predicted to remain flat (World Bank 2013b). Moreover, higher interest rates in
the United States and internationally associated with the U.S. Federal Reserve’s
tapering of its purchases of bonds seems likely to slow the flow of capital to
developing countries.
The exchange rate casts a further shadow over export prospects. The U.S.
dollar has appreciated by almost 30 percent relative to the South African rand
since early 2012 and is forecast to fall further in 2014 (Buiter 2013). Because
such a large share of Zimbabwe’s trade is with South Africa, this appreciation
undermines the competitiveness of Zimbabwe’s exports because dollarized
exports are now priced higher in the regional market.
There are also domestic headwinds. Three interrelated pressures threaten
export performance and growth. First, the financing of the large and persistent
Trade in Zimbabwe • />
51
Trade as an Engine of Growth: Patterns, Potential, and Problems
Table 1.2 Export Composition by Type of Product Exported
1993–99
2000–04
2005–09
2010
2011a
2012b
US$, millions
Low-tech, labor-intensive
exports
Tobacco
Cotton lint
Resource-intensive exports
Platinum
Gold
Diamonds
Ferro-alloys
Medium- to high-tech exports
Transport equipment
Electrical machinery and
appliances
Other
1,085.5
540.7
90.9
753.1
1.5
260.1
4.2
168.6
28.6
7.8
858.3
437.3
96.1
697.3
57.4
203.2
1.3
129.7
47.5
5.9
543.6
243.2
98.7
932.5
343.5
159.0
30.8
138.6
28.6
4.6
1,001.5
475.5
119.2
1,890.3
700.6
334.2
344.4
118.3
143.1
69.0
1,431.4
830.5
142.5
2,604.7
898.9
598.7
419.0
260.0
155.9
75.2
1,344.9
821.6
198.0
2,542.3
854.9
714.9
657.9
126.0
16.6
0.9
8.1
77.0
8.6
188.6
8.4
80.5
25.8
153.9
28.1
167.8
9.0
29.4
2000–04
2005–09
2010
2011a
2012b
1993–99
Percent
Low-tech, labor-intensive
exports
Tobacco
Cotton lint
Resource-intensive exports
Platinum
Gold
Diamonds
Ferro-alloys
Medium-to high-tech exports
Transport equipment
Electrical machinery and
appliances
Other
56
28
5
39
0
13
0
9
1
0
48
24
5
39
3
11
0
7
3
0
34
15
6
59
22
10
2
9
2
0
31
15
4
59
22
10
11
4
4
2
33
19
3
60
21
14
10
6
4
2
34
21
5
65
22
18
17
3
0
0
0
4
0
11
1
5
1
5
1
4
0
1
Source: Reserve Bank of Zimbabwe data at />a. estimated.
b. projected.
current account deficit is unlikely to continue to sustain imports at current levels;
the bulk of current account financing comes from short-term capital inflows
(including errors and omissions) and arrears accumulation. The external debt is
estimated to be 82 percent of GDP at the end of 2013 (IMF 2012). About half
of this debt is arrears to creditors. If global interest rates were to rise and raise the
return to capital elsewhere relative to Zimbabwe, the country would be vulnerable to a sudden reversal of capital inflows. Absent the ability to adjust relative
prices through devaluation, the burden of adjustment will fall on import volumes, including machinery imports and intermediate inputs to export activities.
This will put a tourniquet on domestic investment and growth.
Trade in Zimbabwe •
52
Trade as an Engine of Growth: Patterns, Potential, and Problems
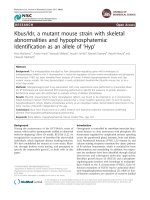
Figure 1.11 High Nominal Rates, High Spreads, and High Real Interest Rates
Constrain Investment
Interest rate (percent)
30
25
20
15
10
5
Lending rate
12
c-
2
12
De
vNo
t-1
12
Oc
p-
2
-1
2
Three-month deposits
Se
Au
g
l-1
Ju
2
12
nJu
ay
-1
M
2
Ap
r-1
2
ar
-1
2
M
-1
Fe
b
Ja
n-
12
0
Demand and savings
Source: Hove, Mawadza, and Vaez-Zadeh 2013.
Second, pressures are likely to develop in the national budget because the
primary fiscal deficit is rising while the very high level of the wage bill as a percentage of GDP is constraining fiscal space for public infrastructure.
Third, investor concerns about ownership policies and weak levels of domestic
confidence are dampening the financial system’s ability to mobilize savings
for investment. Credit conditions are tightening further—nonperforming loans in
the banking sector rose to 15.9 percent at the end of 2013. Real interest rates
remain high. Nominal lending rates are running between 20 percent and
25 percent, while inflation hovers between 2.0 percent and 2.5 percent
(World Bank 2013b). Bank spreads are extremely large (figure 1.11), reflecting
a combination of factors, including a low level of savings and very high perceived risk. The widespread perception of high risk has led to a low-level equilibrium in which the public’s desire to place funds at the banks is constrained. As a
result, real interest rates remain stiflingly high.
Behind these numbers linger concerns about property rights, asset protection,
weak governance, and corruption. Investor behavior shows strong inertia following the decade-long decline. Among the 139 countries that the World Economic
Forum’s Competitiveness Index tracks, Zimbabwe ranked 118 in overall score in
2013, and near the bottom in matters affecting investor c onfidence: 135 in property rights, 138 in policies and regulations, and 139 in policies affecting foreign
investors (WEF 2013). These rankings mark a considerable deterioration since
the mid-1990s. Similarly, according to the World Bank Worldwide Governance
Indicators, Zimbabwe had fallen to the 7th percentile of all countries in 2011,
down from the 37th percentile in 1996, the first year of the index; and ranks at
the lowest levels in various governance indicators that affect investor perception
and confidence in the economy (figure 1.12). As investor confidence remains
weak, investment rates continue to hover at levels insufficient to propel growth
in every sector, possibly save mining.
Trade in Zimbabwe • />
53
Trade as an Engine of Growth: Patterns, Potential, and Problems
Figure 1.12 Zimbabwe’s Rankings in Matters Affecting Investor Confidence,
1996–2011
a. Governance indicators: Zimbabwe and SSA
40
35
Percentile rank
30
25
20
15
10
5
0
1996 1998 2000 2002 2003 2004 2005 2006 2007 2008 2009 2010 2011
Zimbabwe
Sub-Saharan Africa
Political stability
Government
effectiveness
Rule of law
Control corruption
b. Governance indicators: Zimbabwe and Southern Africa
Botswana
South Africa
Malawi
Mozambique
Namibia
Mauritius
Tanzania
Zambia
Zimbabwe
Mauritius
Botswana
Namibia
South Africa
Malawi
Tanzania
Zambia
Mozambique
Zimbabwe
Mauritius
South Africa
Botswana
Namibia
Mozambique
Tanzania
Malawi
Zambia
Zimbabwe
Botswana
Mauritius
Namibia
Zambia
Mozambique
Malawi
South Africa
Tanzania
Zimbabwe
0
10
20
30
40
50
60
70
80
90
Source: World Bank 2013a.
Note: Average percentile rank values, 1996–2011; higher number reflects better governance. Data available
at two-year intervals prior to 2002; annually thereafter.
Trade in Zimbabwe •
54
Trade as an Engine of Growth: Patterns, Potential, and Problems
Patterns Point to Promise and Policy Possibilities
Zimbabwean standards of living are closely tied to the country’s trade performance. Its location and resource base, together with a low-cost but relatively
well-educated labor force, have endowed it with a naturally high trade ratio
built on a diversified base that facilitates using trade as an engine of growth.
Two bright spots in recent performance are underscoring the promise of
Zimbabwean exports for future growth: the surge of mining exports and the
emergence of China as a major export destination.
However, patterns of the past decade point to a slow erosion of the country’s
natural comparative advantages. Trade volumes have rebounded smartly from the
deep recession of 2007–08, but not sufficiently to offset other worrisome longerterm trends: Agricultural exports, other than tobacco, have lost their once prominent role in the region, and have made only a marginal contribution to the
post-2009 recovery. They are no longer a source of diversification. Manufacturing,
especially when resource-based manufactures are discounted, has continued to
wither in secular decline. In contrast to other countries in the region, Zimbabwe
has failed to introduce new products and expand to new markets with sufficient
vigor to power diversification. As a result of these trends, exports have become
less diversified, less technologically sophisticated, and less labor intensive—and
ever more dependent on a few large mining activities to provide foreign exchange
and employment.
The underlying causes of these patterns, while diverse and complex, are
deeply rooted in Zimbabwe’s policy framework. Indeed, that is both the bad
news and the good news of this report. It is bad news because policy was at the
center of the perfect storm in 2007–08: ill-conceived trade and industrial policies
came together with ultimately destructive macroeconomic and fiscal policies and
the global recession to propel Zimbabwe into the recessionary jaws of hyperinflation. It is good news because remedies are available through policy shifts, and the
country has already taken the first, most basic step of reactivating the price system through dollarization, which has allowed it to move out of high inflation and
into renewed growth.
The growth revival provides room for turning attention to the prevailing
incentives that could encourage private investment and deepen its connectivity
to regional and global markets. The country could thus seize opportunities now
open to it because of its newfound macroeconomic stability. Investment climate
policies—protecting property rights, honoring debt obligations, and providing a
stable policy and political environment—create the contours of the incentive
framework. Without improvements in these policies, the economy will not be
able to generate the much-needed new investment and productivity increases
that drive exports.
The government has indicated that it will undertake sufficient reforms
to begin to redress the underlying macroeconomic problems, and will work
with the International Monetary Fund (IMF), the World Bank Group, and
other
international creditors to reestablish its long-term creditworthiness.10
Trade in Zimbabwe • />
Trade as an Engine of Growth: Patterns, Potential, and Problems
Successful stabilization would lay the groundwork for reopening access to international financial markets. Enacted in combination with the reforms suggested in
this report and other World Bank reports (see World Bank 2012), stabilization
would markedly improve the positive incentives for domestic and foreign investors to produce in, and export from, Zimbabwe.
This report focuses on trade-related policy levers that the government could
use to make trade a driver of rapid growth, diversification, and poverty reduction.
These policies include revamping incentives and deepening connectivity through
trade policies (chapter 2), industrial policies (chapter 3), reducing trade costs
(chapter 4), and fostering services growth and exports (chapter 5). Taken
together, policy changes in these areas as well as in the investment climate can
allow Zimbabwe to take advantage of new export opportunities to drive growth
and poverty reduction.
Notes
1.See Newfarmer and Sztajerowska (2012) for a review of these studies.
2.Trade performance analysis is hampered by an immediate problem: an inadequacy of
statistics. As explained in box O.1, a wide discrepancy exists between Zimbabwean
reported trade flows and those reported by its trading partners. This report relies on a
combination of government-reported statistics from the Reserve Bank of Zimbabwe
(RBZ) to analyze aggregate trends and on UN Comtrade mirror data for the more
detailed product, destination, and econometric analyses in chapters 1 and 2.
3.Volume numbers in this section are from RBZ; price information is from the World
Bank commodities section in the Development Economics Prospects Group.
4.This is relative to 2001, the first year for which data are available.
5.The analysis in this section is based on UN Comtrade mirror data at http://comtrade
.un.org/.
6.Other studies could be added to the list: In Bangladesh and Nepal, export diversification is estimated to raise export growth, which increases GDP growth (Hasan and Toda
2004). Herzer and Nowak-Lehnmann (2006) find that export diversification played an
important role in growth in Chile. Lederman and Maloney (2008) present econometric
evidence that slow growth associated with dependence on natural resources is likely a
result of export concentration rather than dependence on natural resources per se.
7.See Schott (2004) on within-product variety in U.S. imports.
8.The small contribution of entry into new product categories is consistent with the
findings of Zahler, Sheu, and Morales (2011), although the contribution for Zimbabwe
is substantially lower than the average of 7 percent of export growth.
9.This regression to the mean could also be related to the fact that the original rebound
may have only been the result of one-time transactions of donations or second-hand
exports, which was observed in a more detailed inspection of the data at the product
level for the years of increased exports in this category.
10.The Finance Minister, according to press reports, indicated that the new Mugabe
administration will adhere to the IMF monitoring program established in June 2013
and set to expire at the end of the year. Reuters, “Zimbabwe Finance Minister Says to
Stick with IMF Program,” October 3, 2013.
Trade in Zimbabwe •
55
56
Trade as an Engine of Growth: Patterns, Potential, and Problems
References
Al-Marhubi, F. A. 2000. “Corruption and Inflation.” Economics Letters 66 (2): 199–202.
Brückner, M., and D. Lederman. 2012. “Trade Causes Growth in Sub-Saharan Africa.”
Policy Research Working Paper 6007, World Bank, Washington, DC.
Buiter, W. H. 2013. “Global Economic Outlook and Strategy.” Citigroup Global Markets.
Easterly, W., and A. Kraay. 2000. “Small States, Small Problems? Income, Growth, and
Volatility in Small States.” World Development 28 (11): 2013–27.
Edwards, Lawrence, and Robert Kirk. 2013. “The Opportunities and Constraints for
Stronger Regional and Global Integration of Zimbabwe.” Unpublished, World Bank,
Washington, DC.
Feenstra, R., and H. L. Kee. 2004. “Export Variety and Country Productivity.” Policy
Research Working Paper 3412, World Bank, Washington, DC.
Ghosh, A., and J. D. Ostry. 1994. “Export Instability and the External Balance in
Developing Countries.” IMF Staff Papers 41 (2): 214–35.
Hammouda, H. B., S. N. Karingi, A. E. Njuguna, and M. S. Jallab. 2009. “Why Doesn’t
Regional Integration Improve Income Convergence in Africa?” African Development
Review 21 (2): 291–330.
Hasan, M. Aynul, and Hirohito Toda. 2004. Export Diversification and Economic Growth:
The Experience of Selected Least Developed Countries. New York: United Nations
Economic and Social Commission for Asia and the Pacific.
Herzer, D., and D. F. Nowak-Lehnmann. 2006. “What Does Export Diversification Do for
Growth? An Econometric Analysis.” Applied Economics 38 (15): 1825–38.
Hesse, H. 2008. “Export Diversification and Economic Growth.” Commission on Growth
and Development Working Paper 21, World Bank, Washington, DC.
Hove, Seedwell, Crispen Mawadza, and Reza Vaez-Zadeh. 2013. “Zimbabwe—Trade
Finance as an Instrument of Trade Openness: Issues and Challenges in a Dollarized
Economy.” Unpublished, World Bank, Washington, DC.
IMF (International Monetary Fund). 2012. Zimbabwe: Staff Report for the 2012 Article IV
Consultation. Country Report 12-279. Washington, DC: International Monetary Fund.
Landesmann, M., and R. Stehrer. 2002. The CEECs in the Enlarged Europe: Convergence
Patterns, Specialization and Labour Market Implications. Research Report 286, Vienna
Institute for International Economic Studies, Vienna.
Lederman, D., and W. Maloney. 2008. “In Search of the Missing Resource Curse.” Policy
Research Working Paper 4766, World Bank, Washington, DC.
———. 2012. Does What You Export Matter? In Search of Empirical Guidance for Industrial
Policy. Washington, DC: World Bank.
Lutz, M., and H. W. Singer. 1994. “The Link between Increased Trade Openness and the
Terms of Trade: An Empirical Investigation.” World Development 22 (11): 1697–709.
Ministry of Industry and Commerce. n.d. National Trade Strategy (2012–2016). Harare,
Zimbabwe.
Newfarmer, R., and M. Sztajerowska. 2012. “Trade and Employment in a Fast-Changing
World.” In Policy Priorities for International Trade and Jobs, edited by Douglas Lippoldt.
Paris: Organisation for Economic Co-operation and Development.
Piñeres, S. A. G. D., and M. Ferrantino. 1999. “Export Sector Dynamics and Domestic
Growth: The Case of Colombia.” Review of Development Economics 3 (3): 268–80.
Trade in Zimbabwe • />
Trade as an Engine of Growth: Patterns, Potential, and Problems
Pritchett, L., J. Isham, M. Woolcock, and G. Busby. 2005. “The Varieties of Resource
Experience: Natural Resource Export Structures and the Political Economy of
Economic Growth.” World Bank Economic Review 19 (2): 141–74.
Schott, P. K. 2004. “Across-Product versus Within-Product Specialization in International
Trade.” Quarterly Journal of Economics 119 (2): 647–78.
WEF (World Economic Forum). 2013. The Global Competitiveness Report 2013–2014.
Geneva, Switzerland: World Economic Forum.
World Bank. 2012. Zimbabwe: From Economic Rebound to Sustained Growth: Growth
Recovery Notes. Washington, DC: World Bank.
———. 2013a.Worldwide Governance Indicators (database).World Bank,Washington, DC.
———. 2013b. “Zimbabwe Economic Briefing.” Unpublished, World Bank, Washington, DC.
Zahler, A., G. Sheu, and E. Morales. 2011. “Gravity and Extended Gravity: Estimating a
Structural Model of Export Entry.” MPRA Paper 30311, University Library of
Munich, Germany.
Trade in Zimbabwe •
57