Describing trends by viv quarry
Bạn đang xem bản rút gọn của tài liệu. Xem và tải ngay bản đầy đủ của tài liệu tại đây (124.31 KB, 2 trang )
25/2/2016
Describing trends by Viv Quarry
Describing Trends By Viv Quarry (www.vivquarry.com).
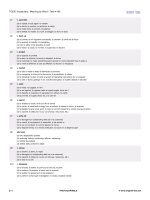
When describing changes in data represented in a graph or bar chart, the following structures are
common:
Adjective and Noun.
Time @
Adjective
Noun
steep
In February
sharp
considerable
Between March
there was a
marked
rise
and June
increase
in the
(variable*)
Since 1992***
there has been steady
a***
gradual
from ** to **
From January to
fall
May
small
drop
slight
Verb and Adverb.
Time @
Variable
Verb
Adverb
In February
rose/risen
steeply
increased
sharply
Between March
went up
considerably
and April
markedly
Since 1992***
the (variable*)
has gone
from ** to **
up***
steadily
went down
gradually
From January to
fell
September
has fallen***
slightly
dropped
a little
@ The time reference can come first or last.
* the price of sth, the number of sth, sales, profits etc.
** a number, an amount of money, a percentage etc.
*** Don't forget that if the data represented forms a link between the past and the present, the present
perfect simple should be used.
The highest point, the lowest point and no change in a trend.
Time @
Variable
Feature
Amount
In February
peaked
Between March
reached a peak
/>
1/2
25/2/2016
and
April
Since 1992***
Describing trends by Viv Quarry
the (variable*)
From January to
September
(has***)
levelled off/out
remained
steady/stable
reached its lowest
point
at **
Additional expressions
Plunge (verb & noun) and plummet (verb only), (take a) tumble and take a nose dive (idioms) are very
sharp drops.
Dip (verb & noun) is a slight fall against the trend.
Shoot up/down (phrasal verb) means to rise or fall very sharply.
Describing trends practice exercise
Back to vocabulary worksheets
/>
2/2