Asset Allocation in Active Portfolio Management using Treynor-Black Model and Technical Trends
Bạn đang xem bản rút gọn của tài liệu. Xem và tải ngay bản đầy đủ của tài liệu tại đây (2 MB, 40 trang )
Asset Allocation in Active Portfolio Management using
Treynor-Black Model and Technical Trends.
Shekhar Karande
September 2010
Dissertation submitted in partial fulfilment for the degree of
Master of Science in Computing for Financial Markets
Department of Computing Science and Mathematics
University of Stirling
Abstract
Active Portfolio Management is considered to be a very costly process and the results of this
process may not be entirely fruitful. Conventionally, fundamental analysis is used to evaluate a
stock, which is usually carried out by experts and consumes a lot of time. The Treynor-Black model
is a multifactor model applied to the equity universe. Equities being relatively less risky to Derivatives, suit the appetite of a moderate risk friendly investor.
Today, with the amount of free and reliable data available, one can use it generate information to
make profits. It is required that this information is transferred into a form suitable to be used in
portfolio optimisation models.
The main objective of the project is to use technical trends to analyse equities and use it to create optimum portfolios. Thus the software is able to generate technical charts for a stock and
calculates the expected returns, the sensitivity of the stock to the index. The data however has to be
manually collected and altered to be used by the software.
This is a project designed in Java following the object oriented methodology for emulating the
entities of a stock market. This allows extending the software to different kinds of investment instruments like bonds and derivatives.
The software package provides a GUI, divided into two distinct sections. One for representing
Technical Analysis and Regression analysis, and the second for emulating the Treynor-Black Model.
The first section allows the user to select a stock from a list of stocks and generate technical
charts. After evaluation, the user may proceed to add the stock to his portfolio and evaluate the
portfolio using the Treynor-Black Model.
The software can be improved to show more detailed technical charts and allow the comparison
of two or more portfolios.
-1-
Attestation
I understand the nature of plagiarism, and I am aware of the University's policy on this
I certify that this dissertation reports original work by me during my University project except for
the following (adjust according to the circumstances):
The section on Technical Analysis in Chapter 2 was largely derived from
.
The Treynor Black model described in Chapter 2, uses information available on
/>
The code discussed in Section 3.3, 3.4 and 3.5 was written by my supervisor Dr David
Cairns which I have adapted to apply to this software package.
The regression calculation code was adapted from regression analysis in the Statistics class
available in jFreeChart.
The Excel spreadsheet used to compare results of the Treynor-Black model was downloaded
from />
Signature
Date
-2-
Acknowledgements
I would like to thank everyone who has helped me to complete this project. Dr David Cairns, my
supervisor, for supporting me and helping me on every step especially to implement jFreeChart.
I would like to thank Kevin Campbell, for pointing me towards the Treynor-Black model for Active
Portfolio Management.
I would also like to thank Immanuel N. N. Kadhila for helping me understand the Treynor- Black
model.
I would like to thank Boonisaed Thanyaworaanan for teaching me the concepts of technical analysis and help design the test cases to test the software application.
I would like to thank Prateek, Immanuel and Boonisaed to help me with the Usability Testing.
-3-
Table of Contents
Abstract ................................................................................................................................. 1
Attestation ............................................................................................................................. 2
Acknowledgements ............................................................................................................... 3
Table of Contents .................................................................................................................. 4
List of Figures ....................................................................................................................... 6
1 Introduction...................................................................................................................... 7
1.1 Background and Context .......................................................................................... 7
1.2 Scope and Objectives ............................................................................................... 7
1.3 Achievements ........................................................................................................... 7
1.4 Overview of Dissertation ......................................................................................... 8
2 State-of-The-Art............................................................................................................... 9
2.1 Modern Portfolio Theory ......................................................................................... 9
2.2 Technical Analysis ................................................................................................. 10
2.2.1 Technical Trends. .............................................................................................. 11
2.2.2 Support and Resistance ..................................................................................... 12
2.2.3 Volume .............................................................................................................. 12
2.2.4 Charts ................................................................................................................ 13
2.2.5 Moving Averages .............................................................................................. 14
2.3 The Treynor Black Model ...................................................................................... 16
2.4 Current Software for Technical Analysis and Portfolio Optimisation .................... 16
2.5 Issues addressed by the Software Package ............................................................. 17
3 Technical Overview ....................................................................................................... 18
3.1 ActivePortfolioManagementApp class .................................................................. 19
3.2 ActivePortfolioManagementView class ................................................................. 19
3.2.1 Charts for Technical Analysis ........................................................................... 21
3.2.2 The Treynor-Black Model results-Black Results .............................................. 23
3.3 ActivePortfolioManagementEquity class ............................................................... 25
3.4 ActivePortfolioManagementPortfolio class ........................................................... 25
3.5 ActivPortfolioManagementHistory class ............................................................... 25
3.6 ActivePortfolioManagementTick class .................................................................. 25
4 Testing............................................................................................................................ 26
4.1 Data Sets ................................................................................................................ 26
4.2 Testing Functionality of the software ..................................................................... 29
4.3 Usability Testing .................................................................................................... 29
-4-
4.4 Testing conclusions ................................................................................................ 29
5 Conclusion ..................................................................................................................... 31
5.1 Summary ................................................................................................................ 31
5.2 Evaluation .............................................................................................................. 31
5.3 Future Work ........................................................................................................... 31
References ........................................................................................................................... 33
Appendix 1-Downloading and updating data files ............................................................. 34
Appendix 2 – User guide .................................................................................................... 38
Appendix 3 – Installation guide .......................................................................................... 39
-5-
List of Figures
Figure 1.
Example of Trend. Investopedia.com[4] .......................................................................11
Figure 2.
Support and Resistance Levels. Investopedia.com[5] .................................................. 12
Figure 3.
Line Chart example. Investopedia.com[6] ................................................................... 13
Figure 4.
Candlestick Chart Example. Investopedia.com[7] ....................................................... 14
Figure 5.
Moving Averages. Investopedia.com[8] ....................................................................... 15
Figure 6.
Trend indicator using Moving Averages. Investopedia.com[9] ................................... 15
Figure 7.
Design Preview of GUI ................................................................................................ 20
Figure 8.
Chart for Alliance Trust from January 01, 2009 to January 01, 2010 .......................... 22
Figure 9.
The Treynor-Black Model optimisation results............................................................ 24
Figure 10.
Risk Parameters[1] ................................................................................................... 26
Figure 11.
Macro Forecasts[1]................................................................................................... 27
Figure 12.
Computation of Optimal Risky Portfolio using Treynor-Black Model[1] ............... 27
Figure 13.
Results of produced by the software package. ......................................................... 28
Figure 14.
Yahoo!Finance ......................................................................................................... 34
Figure 15.
Symbol lookup for Tesco ......................................................................................... 34
Figure 16.
Stock information ..................................................................................................... 35
Figure 17.
Selecting Daily price list .......................................................................................... 35
Figure 18.
Download the file ..................................................................................................... 36
Figure 19.
Saving the file in the "Data" folder .......................................................................... 36
Figure 20.
Updating headers of data files .................................................................................. 37
-6-
1 Introduction
This chapter gives a brief overview of the project and the software development lifecycle. It outlines the background and context of the project. It spans into the scope and objectives continuing
into the achievements.
1.1
Background and Context
The Treynor-Black model was designed in 1973, with an effort to understand the relationship of
risk and return while constructing a portfolio of assets.
"According to Miller [1], this model is being used extensively in many portfolios optimising software. It is an easy to understand model requiring little information providing the
solution in an easy to understand algebraic formula."
Fundamental Analysis has been the conventional tool of stock evaluation; however this project
tries to implement the alternate to fundamental analysis. Technical analysis is traditionally used for
identifying trends in intraday trading. However, the same theories can be applied to evaluate long
term trends. The results of this analysis can be used as inputs to the Treynor-Black model.
This project tries to use Technical Analysis for analysis to help investors who are relatively new
to investment.
1.2
Scope and Objectives
The main aim of this project is to build an independent desktop application to help a moderately
knowledgeable investor to analyse stocks listed on FTSE100 and create a viable portfolio.
The functions of the software are:
1. Create technical charts for analysis using previously downloaded data.
2. Display results of regression
3. Evaluate results for the Treynor-Black Model
The first two sections can be used as a standalone tool for technical analysis as well.
1.3
Achievements
The software developed performs all 3 functions stated in the scope and objectives section. The
software was tested using predefined test cases and was able to reproduce the same results as generated in Excel Spreadsheet [1].
-7-
1.4
Overview of Dissertation
The rest of this dissertation will introduce the State of the Art in chapter 2, presenting a general discussion of Technical Analysis and The Treynor Black model. Chapter 3 introduces the technical
implementation of the classes related to the software architecture. Chapter 4 discusses the testing of
the software. Chapter 5 will provide the conclusion reached by this project.
-8-
2 State-of-The-Art
This chapter introduces the concepts of modern portfolio theory to be used in the overall design and
structure of an investment portfolio. The chapter introduces the concepts of Technical Analysis to
be used in evaluating the value of a stock. Later on a brief description of the Treynor-Black model
tries to lay the foundation of portfolio design using Equities.
2.1
Modern Portfolio Theory
All investors will look forward to maximise their profit on their investments with the least risk
as possible. The risk appetite of the investor will determine the cost of profit. It is highly likely that
a risk averse investor will make less profit as compared to an investor who is willing to take more
risks, in the same market environment. However, this does not undermine the fact that both types of
investors stand to make a loss/profit at the end of their investment horizon which is equivalent to
their risk appetite.
All investors are exposed to the same kinds of risk irrespective of their risk appetite. The risks
are mainly of two different kinds. First the systematic risk, which is inherent to the equity that the
investors invest in. Inherent risks arise due to the performance of the equity. The underlying factors
supporting the instrument. For example, consider an investment in buying stocks of a car manufacturer. The systematic risk will include the sales of the company, the manufacturing capacity of the
company, the competition in the car market, the demand of cars manufactured by the company, etc.
If an investor is keen on purchasing stocks for a car manufacturing company, he is exposed to all of
the above mentioned risks for one single company. To reduce one's risk, the best option is to diversify the investment to minimise systematic risk. If applied properly, diversification can help
eliminate systematic risk completely.
The unsystematic risk on the other hand depends on macro economic factors, for example the
state of the economy (recession/depression), the interest rates, external influential factors like natural disasters, war. All investments are equally exposed to the unsystematic risks and will react to
bad news in the same manner. An investor at all times will expect to minimise the unsystematic risk
and eliminate the systematic risk.
Thus, it implies that investing will always be a trade off between the expected return on an investment whilst being exposed to risk. As commonly observed, investments with higher expected
returns tend to be more risky. This leads to classifying investments based on their systematic risks.
Traditional investments in financial markets include bonds, equities and derivatives. Bonds are
considered to be the least risky of the three and derivatives the most risky. An investor will invest
-9-
in all or any of these investments based on his risk appetite. The investor can choose to combine
the three different kinds of investments to be included in his portfolio.
"According to Markowitz [2], Modern Portfolio theory proposes a method to design a
portfolio with a highest possible return with the lowest possible risk. According to the
theory, it's possible to construct an "efficient frontier" of optimal portfolios offering the
maximum possible expected return for a given level of risk."[3]
The four basic steps of Portfolio selection are:
1. Security Valuation after analysis
2. Choosing the security
3. Optimising the portfolio
4. Measuring performance of Portfolio
2.2
Technical Analysis
Security valuation helps us to determine whether a security is undervalued or overvalued as
compared to the theoretical value of the security. It is safe to say that an undervalued security will
appreciate in price and an overvalued security will depreciate. Irrespective of the different kinds of
investors, there exist two ways to analyse an investment and predict the future prices of the security.
1. Fundamental Analysis
2. Technical Analysis
Fundamental Analysis involves understanding all possible information available for the security.
Considering the example of investing in the stock of a car manufacturing company, the analysis
will consider the financial statement of the company, the performance of the company compared to
its past performance as well as performance as compared to other car manufacturing companies.
Fundamental analysis will help in determining the intrinsic (theoretical) value of the security.
Technical Analysis uses charts and other tools to identify different emerging patterns favourable
for trade. It relies on historical information of price and volume of a particular security to entail
interest in trading the security.
Technical analysis theory assumes that the market discounts everything. The price of the stock reflects all factors which determine the price of a stock. This means that technical analysis adopts the
Efficient Market Hypothesis and studies the price movement. Analysing the price movements helps
to forecast prices; this is one of the fundamental ideas of Technical analysis. It is always observed
that prices tend to move in trends. Thus establishing a trend will help predict the direction of the
- 10 -
price movement. Once a price movement is determined, the historical information available helps
to determine the amount of profit/loss one makes on a particular movement.
The different kinds of trends help us establish different kinds of trading patterns, consistent with
the trading strategies of investors. Technical Analysis does tend to help traders more than investors,
due to the fact that traders usually have a short time horizon as compared to fundamental analysts.
2.2.1
Technical Trends.
One of the most important concepts for technical analysis is the Trend. Trends are observed in
everyday life, for example if we look at the weather for the past week, we can use it to predict the
weather tomorrow. Similar trends are observed in stock prices. Trend is a dataset spread over a period of time, indicating a movement in a certain direction.. Stock prices will never move in a
straight line. They will always move in a series of highs and lows. The number of highs and lows,
individually or together, will indicate an Uptrend, a Downtrend or Sideways/Horizontal trends.
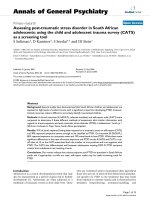
Figure 1. Example of Trend. Investopedia.com[4]
Referring to the figure 1 above, points 2 and 4 are termed as peaks, whereas points 3 and 5 are
troughs. An uptrend is a series of higher peaks and higher troughs. A downtrend is a series of lower
peaks and lower troughs. A sideways/horizontal trend does not have a clear series of an uptrend or a
downtrend. In technical terms, it may not be a trend at all. The direction of the trend after point 6 is
difficult to determine. The price may fall down as seen in points 3 and 5 to form a new trough or
continue forward to create a new peak. If a new peak is formed, it means that the uptrend is extended and the price will continue to move upwards; however a trough, lower than point 5 may indicate
the start of a downtrend which signals a reversal. The timelines of the trends determine the length
of the trends.
- 11 -
2.2.2
Support and Resistance
Support and Resistance are indicators of supply and demand. These are usually the levels where
traders tend to buy or sell their stock. They are established by stock prices moving in certain set of
trends over a period of time.
Figure 2. Support and Resistance Levels. Investopedia.com[5]
As seen in the figure 2 above, support level is the price level through which a price will rarely
fall and resistance level is the price level through which the price will rarely surpass. These are the
levels indicating the comfort zone of the price movement. As long as these levels are not broken,
the price will continue to oscillate between these levels. Once a support or resistance level is broken, it indicates a start of a new trend and possible shift in the psychology of demand and supply in
the market. This shift in trend is termed as trend reversal, it holds only if the movement thru either
support or resistance is very strong.
2.2.3
Volume
Although the price and its movement are of primary concern, technical analysis also terms the
volume to be equally important. Volume for a security is defined as the total number of shares or
contracts that were traded over a given period of time for that particular security. Volume indicates
the markets interest in a particular stock, the more the volume the more active the stock. Volume
can confirm a trend; the larger the volume along with the change in price indicates a strong movement of price. Volume is a reliable indicator of a trend, if price goes up along with volume,
identifying a strong signal to buy the security; similarly a strong volume with reducing price of the
security, is a strong signal to sell the security. If a correlation between volume and trend doesn't
exist, it is considered to be an indicator for weakness in trend. Thus, showing that the trend is either
over or may soon end.
- 12 -
2.2.4
Charts
Charts are more than a mere representation of stock prices over a period of time, the properties
of a chart will help analyse the information available in the chart. The time scale property of a chart
indicates the range of dates at the bottom of the chart. The time scale may vary from a few seconds
to well over a decade. Refer figure 3 below for example of a chart.
Figure 3. Line Chart example. Investopedia.com[6]
The price movements can be represented by different types of charts. For example, line chart,
bar chart and Candlestick Charts.
Line Charts: It's the most basic of all the charts. It represents only the closing prices over a
time interval. The line chart is drawn by connecting consecutive data points within the time interval. Apart from the closing prices that are plotted, not much visual information is available from the
line chart.
- 13 -
Figure 4. Candlestick Chart Example. Investopedia.com[7]
Candlestick Charts: These types of charts pack more visual information in their representation
as compared to Line Charts. It consists of vertical lines, which indicate the time period's trading
range. The width of the vertical line is the difference between the opening price and closing price
of the security for the day. Colours are used extensively to depict the movement of the stock price.
In figure (above), if the stock has closed above the opening price, it is displayed in blue (generally
lighter colours), indicating an UP day. A DOWN day is represented by the red vertical bars (generally depicted by black or dark colours). The choice of colours is specific to the website or technical
charting tool used and a general rule or colour scheme does not exist.
2.2.5
Moving Averages
Most charts are difficult to interpret, due to the volatility of price movements. To simplify the
charts, traders rely on moving averages. It is the average price of the security over a period of time.
Plotting the average price over a period of time helps smooth the price movement on the chart. The
moving averages help in determining the true trends of a stock price.
Simple Moving Averages: Calculated by taking the sum of all the past closing prices over the
time period and dividing the sum by the number of prices in that particular period. As seen in the
figure below moving averages are less sensitive to fluctuating prices when the time period increases.
- 14 -
Figure 5. Moving Averages. Investopedia.com[8]
Types of Moving averages also include Linear moving averages, Exponential moving averages
and Weighted moving averages.
Moving averages help to identify trends and establish support and resistance levels. They help
in identifying a trend fairly quickly. As can be seen from the figure below, as long as the moving
average is moving upward and the price remains above the average, it establishes an uptrend. Conversely a downward moving average is with the price below the average is a downtrend.
Figure 6. Trend indicator using Moving Averages. Investopedia.com[9]
An order of a pair of moving averages can also help determine momentum, for example, if the
short term moving average is above a long term moving average, it indicates an uptrend. The converse will indicate a downtrend.
- 15 -
2.3
The Treynor Black Model
Technical analysis will help in stock valuation for designing your portfolio. However, portfolio
selection and optimisation are a different ball game altogether.
"The Capital Asset Pricing Model [10] suggests that an investor should hold on to a
market portfolio in absence of special information of the market. A market portfolio can
easily be constructed by randomly selecting 50-100 securities, as they will tend to highly correlate with the market. This eliminates the use of the elaborate balancing
algorithms proposed by Markowitz and Sharpe [11,12]. However, if the investor has
special insights, he needs to convert the insights into expected returns, variances and
covariance's the balancing algorithms require as inputs."[3]
The Treynor-Black model, tries to define risk and return when constructing a portfolio of assets.
The model tries to be consistent with Efficient Market Hypothesis to construct a portfolio, while
using alpha, which is the projected return of the security over the market adjusted risk free
rate/return. The optimal portfolio will lean towards securities with alphas greater than zero, indicating outperformance. Alpha is determined in a subjective manner and helps in deciding whether to
buy, hold or sell the security.
The model tries to find a mix of securities, where their associated alphas and systematic risks
generate the highest possible benefit from active management. The ratio of the portfolio alpha
(weighted average of the alpha of each asset) to the portfolio specific risk (square root of portfolio
variance, where portfolio variance is the weighted sum of the asset specific risks squared). This
ratio is known as the "Appraisal ratio/Information ratio", is considered to be a good measure of
portfolio optimisation. The Treynor-Black model gives one important result, which is, in order to
maximise the performance of the portfolio with both active and passive components, as measured
by Sharpe ratio, it is necessary to increase the appraisal ratio of the active component. The TreynorBlack model assumes a time period of one year or more.
2.4
Current Software for Technical Analysis and Portfolio Optimisation
Software available in the current markets depends heavily on third party software like Microsoft
Office Excel. This leads to unnecessary licensing costs of the third party software. The user also
needs to learn to use of these third party software.
Customer support for third party software issues is not readily available which could dissuade customers from using the portfolio optimisation software.
- 16 -
2.5
Issues addressed by the Software Package
Portfolio optimisation for a long term investment period requires balancing and rebalancing your
portfolio. In order to create an optimum portfolio, the investor requires complete information of the
investments.
The software package is unconventional in terms of technical analysis. Most software optimisation tools traditionally follow the Modern Portfolio Theory and use Fundamental Analysis to
evaluate stock and use it in the allocation. The software package uses candlestick charts and simple
moving averages to value the stock and use it for portfolio optimisation. The software package also
focuses on the Treynor-Black model as it is designed for using equities for portfolio optimisation.
The software package helps the user to construct a single portfolio at a time and use the results
for investments.
The software package also focuses on stocks listed on FTSE100 of the London stock exchange.
The list was compiled on 25th August 2010. The historical prices of these stocks are downloaded
from Yahoo finance () and Google finance ().
- 17 -
3 Technical Overview
The Software package is designed to carry out 3 main functions.
1. Create charts for the stocks selected
2. Determine Alpha, Beta and Correlation of the stock with the index
3. Create the portfolio according to the rules of The Treynor-Black model
Using an object oriented approach to emulate the working of a stock market; the following initial
class structure was designed.
Class Portfolio
Class Chart
Class History
Class Equity
Class TreynorBlack
Class Tick
Class Portfolio encompasses the entire investment universe of 6 equities and is extended by class
Equity. Class Equity will help store information for equity objects and help to plot charts using
class Chart. Class History and class Tick help to retrieve and store information for a particular equity.
The software package was created using Java along with Netbeans. The software package includes
the following classes.
- 18 -
ActivePortfolioManagementApp: Launches the software package.
ActivePortfolioManagementView: It is the GUI for the package. The layout is designed to help the
investor select a stock and add to his portfolio following a series of steps.
ActivePortfolioManagementEquity: A class to emulate the behaviour of a stock.
ActivePortfolioManagemetnPortfolio: A class to emulate the behaviour of a portfolio.
ActivePortfolioManagementHistory: A class to record the information of a stock.
ActivePortfolioManagementTick: A class to record information of the stock at a particular date.
ActivePortfolioManagementChart: A class to generate the chart for the selected stock.
3.1
ActivePortfolioManagementApp class
This class is created by Netbeans IDE to help launch the application. The code is generated by netbeans and contains the main class.
3.2
ActivePortfolioManagementView class
This class contains the GUI for the package. The preview can be seen in figure 7 below
- 19 -