The Drivers of Aging in Europe and Central Asia
Bạn đang xem bản rút gọn của tài liệu. Xem và tải ngay bản đầy đủ của tài liệu tại đây (1.13 MB, 38 trang )
1
The Drivers of Aging in Europe and
Central Asia
Introduction
This chapter reviews the effects of fertility rates, mortality rates, and migration patterns on aging in the Europe and Central Asia (ECA) region. Population aging is
attributable primarily to declines in fertility rather than to improvements in life expectancy, which have lagged behind what most other regions have achieved. The
region is moving toward a more balanced age structure, which will imply increases
in the ratio of older dependents to the working-age population (that is, the oldage dependency ratio1) going forward. Outward migration flows have also contributed to aging in the region, and immigration is unlikely to make a significant
contribution to maintaining the size of working-age populations.
The Aging Populations of Europe and Central Asia
The average age of the population of Europe and Central Asia rose from 29 years
in 1950 to 37 years in 2015, and the share of the population over 64 rose from 5.8
This chapter uses results from two background papers commissioned for aging work in the
Europe and Central Asia Region of the World Bank: “Starting or Enlarging Families? The
Determinants of Low Fertility in Europe” (2014) by Angela Greulich, Olivier Thévenon, and
Mathilde Guergoat-Larivière; and “Fertility in Turkey, Bulgaria, and Romania: How to Deal with
a Potential Low-Fertility-Trap? (2014) by Angela Greulich, Aurélien Dasre, and Ceren Inan.
39
40 ●
BOX 1.1
Golden Aging
Nearing the End of a Demographic Transition to Stable or
Declining Populations in Europe
For most of human history, high rates of mortality
(in part generated by periodic famines, wars, and
epidemics) kept population growth low, despite
high birth rates. People could not expect to live
beyond 25 or 30 years of age (Bogue 1969). The
decline in mortality, particularly at early ages,
began in northwestern Europe in the second half
of the 18th century and then spread to the rest
of Europe. Population growth rose to 0.5 percent
per year from 1700 to the advent of the Industrial
Revolution in 1820 and then to about 1 percent per
year (excluding the two world wars) until the 1970s
(figure B1.1.1).
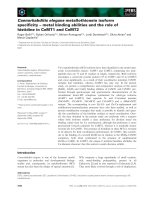
FIGURE B1.1.1 Europe’s population has stabilized after a period of
unprecedented growth
900
Population, millions
800
700
600
500
400
300
200
100
47
16
20
86
20
55
19
25
19
19
82
17
13
17
43
17
74
18
04
18
35
18
66
18
94
51
16
21
16
90
16
60
15
29
15
15
15
00
0
Year
Sources: World Bank calculations based on data in Maddison 2010; World Population Prospects:
The 2012 Revision.
Note: The definition of Europe follows that of Maddison.
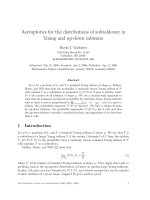
A model of the different stages of demographic
transition was first proposed by Warren Thompson
in 1929 to explain the change over time in population dynamics. Preindustrial societies represent the
first stage, when a combination of highly fluctuating
birth and death rates, punctuated by periodic famines, wars, and epidemics, resulted in little population growth (stage 1 in figure B1.1.2). Europe was
the first region to transition from this stage of low
population growth that had typified most of human
history. However, in the early stage of expanding
populations (stage 2 in figure B1.1.2), the demographic structure was bottom heavy because of the
large numbers of children and shaped like a pyramid because mortality in later life had not yet improved substantially.
(Continued)
percent to 11.8 percent. Aging reflects the rapid declines in fertility that have
sharply reduced the share of younger age cohorts in the total population and not
a substantial rise in longevity. By 1990, the fall in fertility in Europe had put an end
to the rapid population growth that began in the 18th century (see box 1.1).2 Europe’s population is now expected to decline over the next 40 years, making it the
The Drivers of Aging in Europe and Central Asia
BOX 1.1
● 41
(continued)
Most countries moved to a late stage of
expanding populations (stage 3 in figure B1.1.2)
by the early 20th century, with falling birth rates
and a continued decrease in mortality at all ages.
The young countries of Central Asia are still in
this stage. Finally, in recent decades, births have
dropped rapidly in European countries, leading to
low population growth (stage 4 in figure B1.1.2).
Northwestern Europe moved first to stable population growth in the 1970s, the rest of Europe fol-
lowed by the 1990s, and Central Asia is converging
rapidly with the rest. For a number of countries,
fertility has fallen to well below the replacement
rate, and populations have since begun to decline
(a possible stage 5 in figure B1.1.2). But a move to
shrinking populations is not a given. In France, for
example, one of the first countries to begin the
demographic transition (in the 18th century), fertility is at the replacement rate and the population
has been increasing.
FIGURE B1.1.2 Most European countries are at the late stage of the demographic transition
Amazon Basin
tribes
Ethiopia
India
United
Kingdom
Source: World Bank simulations using data from World Population Prospects: The 2012 Revision.
only region in the world where the population is expected to fall (table 1.1). In
Turkey and the countries of Central Asia, populations are much younger than in
Europe and continue to increase. Nevertheless, recent and substantial declines in
fertility are also driving increases in the average age and slowing population
growth in those countries as well.
Russian
Federation
42 ●
Golden Aging
TABLE 1.1 Global Population Growth, 1500–2060
percent
Period
1500–1700
1700–1870
1870–2012
1870–1950
1950–70
1970–90
1990–2012
2012–30
2030–60
North America
Latin America
Europe
Africa
Asia
0.0
2.1
1.5
1.7
1.6
1.0
1.1
0.9
0.4
0.0
0.7
1.9
1.8
2.8
2.2
1.5
1.0
0.3
0.1
0.5
0.5
0.6
0.8
0.4
0.1
0.1
–0.1
0.1
0.2
1.8
1.2
2.4
2.8
2.5
2.0
2.1
0.1
0.4
1.2
0.7
2.1
2.0
1.5
0.8
0.1
Sources: World Bank calculations based on data in Maddison 2010; World Population Prospects: The
2012 Revision.
Note: The regional grouping follows that of Maddison. The data for 1500–2012 represent actual
population; the data for 2012–60 are projections based on the medium-fertility variant.
The Effects of Declining Fertility on Aging and
Population Growth
The total fertility rate (TFR) has declined in many regional countries to well below
2.1 children per woman, the replacement rate required to maintain populations at
current levels without immigration (figure 1.1). While the timing, intensity, and
persistence of the fertility decline vary, in many countries the decline has been
dramatic and has occurred rapidly. For example, the shift from an average fertility
rate of over five children per woman to below the population replacement
In many countries the
rate took two centuries in France but only 34 years in Albania (figure 1.2).
recent fertility decline has been
The average fertility rate per woman in Central Asian countries was six
dramatic and rapid. The shift
children in the early 1960s but is fewer than three children today.
The decline since 1990 has been especially sharp in the Central
from an average fertility rate
Asian
countries and Turkey, which had the highest fertility rates in the
of over five children per woman
early
1970s.
Fertility rates in the Caucasus—Armenia, Azerbaijan, and
to below the population
Georgia—are now all below replacement levels. TFRs have continued to
replacement rate took two
drop significantly in Armenia, Tajikistan, and Turkmenistan over the past
centuries in France but only
decade, while a fertility upturn has occurred in Kazakhstan and the Kyrgyz
34 years in Albania.
Republic and, to a lesser extent, in the Russian Federation, Ukraine, and Uzbekistan. Overall, however, the Central Asian countries still have comparatively
high fertility rates that exceed population replacement rates.
In addition to the transition from high to low mortality and fertility rates, the current population structure reflects demographic shocks in discrete time periods.
Some countries in Central Europe, the Eastern Partnership countries, and Russia
experienced an increase in fertility (a baby boom) following the Second World War,
although the boom was less pronounced than in Western Europe and the United
States. A number of countries did not experience a baby boom; the Baltic states,
for instance, exhibited some of the lowest fertility rates in the world in the 1950s
and 1960s. A baby boom echo occurred in the 1970s and the 1980s, when the
children of the boomers started to have families of their own, and this generation
reached peak size in the early 1980s.
In Central Europe and the Baltics, the Eastern Partnership, Russia, and the Western Balkans, the social and economic hardship of the 1990s resulting from the col-
The Drivers of Aging in Europe and Central Asia
● 43
FIGURE 1.1 Total fertility has declined to below the replacement rate in many countries
a. Selected countries at or near the replacement rate, 2012
7
Average total fertility rate,
children per woman
6
5
4
3
2
1
en
n
Sw
ba
er
Tu
Az
ed
ija
e
Ire
Fra
nc
d
lan
d
lan
Ice
y
Tu
ist
rkm
en
kis
be
Uz
rke
an
n
ta
n
sta
kh
za
Ka
Ky
rg
yz
Ta
Re
jik
pu
ist
bli
an
c
0
Country
b. Selected lower-fertility countries, 2012
6
Average total fertility rate,
children per woman
5
4
3
2
1
It
Ge aly
rm
an
y
Un
ite
dK
Un ing
ite do
dS m
ta
t
No es
rw
a
Ge y
or
gia
Fin
la
Be nd
lgi
u
Al m
ba
n
Ar ia
me
D nia
Ne enm
th ark
e
M rlan
on ds
te
ne
Ru
ss Lit gro
ian hu
Fe ani
de a
ra
ti
Sl on
ov
e
Lu
xe nia
mb
ou
Es rg
to
n
Uk ia
ra
Ro ine
ma
ni
Cr a
oa
Bu tia
lga
ria
Cy
pr
u
Cz Mol s
ec do
h R va
ep
ub
li
Au c
str
ia
M
ac La
ed tvi
on a
ia,
FY
R
M
alt
a
Ja
pa
n
0
Country
c. Lowest low-fertility countries, 2012
5
4
3
2
1
B
He osn
rze ia
go an
vin d
a
l
ga
rtu
Re
a,
re
Ko
Po
p.
d
lan
Po
ain
Sp
bia
Se
r
y
ar
ng
Hu
ee
Gr
ub
Sl
ov
ak
Re
p
ce
0
lic
Average total fertility rate,
children per woman
6
Country
1970
2012
Replacement rate
Source: WDI.
Note: The replacement rate is defined as 2.1 children per woman. Lower-fertility countries had a total fertility rate (TFR) of at least 1.4 children,
but below 2.0 in 2012. The lowest low-fertility countries are defined as those having a TFR of around 1.3 children. Countries are ranked in
descending order of TFR as of 2012. The data on Cyprus refer to the southern part of the island. Data on Serbia for 1970 refer to 1971.
44 ●
Average total fertility rate, children per woman
7
6
5
4
3
2
Replacement rate
1
0
17
5
17 0–5
6 9
17 0–6
70 9
17 –7
8 9
1 7 0–8
90 9
18 –9
0 9
18 0–0
1 9
1 8 0–1
2 9
18 0–2
3 9
1 8 0–3
4 9
1 8 0–4
5 9
18 0–6
6 0
18 1–7
7 0
1 1–
18 881 80
91 – 9
–1 0
1 9 900
0
19 1–1
1 0
19 1–2
21 0
19 –3
3 0
1 9 1–4
41 0
19 –5
5 0
19 1–6
61 0
1 9 –7
7 0
1 1–
19 981 80
91 – 9
– 0
2 0 200
01 0
–1
0
France
England
Russian FederaƟon
Poland
Ireland
Korea, Rep.
Albania
Turkey
Tajikistan
a. Total fertility rate
8
Years
b. Years to reach below replacement rate fertility
Korea, Rep. (1966–1983)
Russia (1937–1967)
Economy and period
FIGURE 1.2
The fertility transition in
some countries in Europe
and Central Asia is occurring
much more rapidly than in
advanced European
countries
Golden Aging
Albania (1970–2004)
Turkey (1975–2011)
England (1845–1973)
France (1775–1976)
0
50
100
150
200
No. of years
Sources: World Bank calculations based on World Population Prospects data: The 2012 Revision,
except England and France prior to 1950 (Chesnais 1998); the Russian Empire in 1897 (Borisov 2001);
and Russia for all o
ther years prior to 1950 (Andreev, Darskiy, and Kharkova 1998).
Note: Panel b shows the number of years it takes countries to move from a total fertility rate of 5 to a
sustained decline to under the replacement rate of 2.1.
lapse of the Soviet Union reversed the positive fertility trends of the 1980s. The recovery of births that were postponed during the 1990s has been slow.3 Fertility rates
in all countries are below that needed to replace current generations (referred to as
the replacement rate). The average TFR in these countries is just above 1.3, while
the medium variant of the United Nations Population Division forecasts (commonly
used for baseline population projections) assumes that these countries converge
toward a TFR of 1.8 by 2040 (see World Population Prospects: The 2012 Revision).
The Drivers of Aging in Europe and Central Asia
● 45
Moving to a TFR of 1.8 would reduce the shrinking of younger generations as
it implies 0.9 children per adult or a 10 percent decrease in every generation (if all
children survive). In contrast, a TFR of 1.3 implies a 35 percent total decline in every
generation (if all children survive), or about a 1.2 percent per year decline in population. Returning to a population structure that is balanced across generations
would require that fertility rates recover toward replacement rates. But even if
fertility recovers, such a rebalancing would take time. Low fertility now, even if it
rises in the future, has a multiplier effect. Fewer children today mean fewer parents
in the future.
Why Has Fertility Declined?
Researchers have identified the declines in fertility to below replacement rates as
a major driver of population aging and noted that increases in fertility are important to avoiding very large reductions in the population. Understanding why fertility has declined is a first step toward formulating policies to support families who
wish to have more children (policy recommendations are addressed in part III of
this report). Decisions on whether and when to have children are influenced by
myriad factors.4
Rising income per capita has been accompanied by a decline in fertility. A shift
in preferences from having a large number of children to having fewer children
of higher “quality” (with higher human capital) is one explanation (Becker,
As women are
Murphy, and Tamura 1990; Galor and Weil 2000). Development is associmore educated and
ated with improved opportunities in the labor market, and higher wages
among women have been found to reduce fertility (Galor and Weil
participate more in the
1996). For example, in England the Black Death led to a delay in the
formal labor market,
age of first marriages (and thus a decline in fertility), because the high
reconciling work and
mortality rates increased the availability of land per person, which infamily life are at the core
creased employment opportunities in farming for women (Voigtländer
of women’s fertility
and Voth 2013).
The increasing importance of education is associated with a growing
choices.
tendency for women to postpone having a child until later in life (Blossfeld
1995; Goldstein, Sobotka, and Jasilioniene 2009). Indeed, there has been a
sharp decline in fertility rates among women below age 30, which started in many
countries almost five decades ago.5 The effect on family size seems to vary considerably across countries, however. For example, in Nordic countries long-standing support for a balance between work and family life (Hoem, Neyer, and Andersson 2006) appears to have enabled educated women to progressively catch up
with their peers; thus, the differences in completed fertility rates—that is, the number of children women have had by the end of their reproductive lives—by level
of educational attainment are small, especially in Finland and Sweden (Andersson
et al. 2009). Overall, the impact of decisions to postpone child rearing on total
fertility varies, since this is often accompanied by a significant increase in fertility
among women in their 30s.
Cultural change has also had an impact on fertility decisions, particularly as the
secular decline in fertility appeared to happen at the same time in many countries.
Women are postponing childbirth because of shifting ideas about the ideal family
46 ●
Golden Aging
size and about the relationship between quality of life and number of children
(Becker, Murphy, and Tamura 1990; Galor and Weil 2000).
The rising cost of having children has been an important determinant of the
declines in fertility since the early 1970s (for example, see Hotz, Kerman, and Willis
1997). Having children incurs both a direct, visible cost and an indirect, less visible
cost (Thévenon and Luci 2012; Willis 1973). The direct costs of children include the
additional consumption incurred by households because of the presence of children: housing, food, clothing, child care, education, transport, leisure activities,
and so on. Surveys of the literature on the cost of children suggest that a child
would account for approximately 15–30 percent of the budget of a childless couple (OECD 2011; Thévenon and Luci 2012). Variations depend on several factors,
including the child’s birth order, the age of the child, parental educational attainment and income level, and the bargaining power of household members. Housing and education are particularly important items in the expenditures of families
with children. The growing cost of housing, the rising number of years spent in
education, and the expanding importance attached by parents to education are
thus likely to represent a barrier to fertility (OECD 2011). The 2008 economic crisis
may have reduced the ability of households to meet these costs and thus may have
reduced fertility rates (box 1.2). Households also bear indirect costs if they have
children because parents, usually mothers, must invest time in caring for, educating, and raising the children rather than in paid employment. These costs can be
measured by the earnings forgone by parents who reduce their working hours or
stop work altogether. Full-time leave or temporary reductions in working hours can
also incur costs by lowering long-term career prospects.
The availability of modern contraceptives has facilitated the postponement of
children and a reduction in family size (Frejka 2008). The use of modern contraceptives reduces the number of unwanted and mistimed pregnancies and births. It is
likely that modern contraceptive methods have also facilitated the shift toward
smaller families, but they cannot be seen as a principal cause of currently low fertility rates (Leridon 2006).
The Effect of Labor Market Conditions on Fertility
The decline in fertility with increasing economic development has not been uniform. Figure 1.3 shows that, while many of the countries with the highest level of
human development have very low fertility rates, in recent years fertility rates began increasing again once a certain threshold was reached (Myrskylä, Kohler, and
Billari 2009). The differences in fertility levels among the advanced countries are in
large part due to differences in family policies and the institutional environment for
the labor market, particularly as these affect the employment of women (see box
1.3 for a comparison of France and Germany).
Recent studies have emphasized the importance of labor market conditions for
fertility in advanced countries. Long working hours make juggling work and care
commitments more difficult and have been found to affect fertility rates negatively
(Luci-Greulich and Thévenon 2013; Schmitt 2012). In contrast, part-time employment opportunities have had a positive effect on fertility rates in Organisation for
Economic Co-operation and Development (OECD) countries, especially among
women with higher educational attainment (Adsera 2011; d’Addio and d’Ercole
The Drivers of Aging in Europe and Central Asia
BOX 1.2
● 47
Have People Had Fewer Children because of the 2008
Economic Crisis?
Fertility generally declines in economic downturns
(for a review of the literature, see Sobotka, Skirbekk, and Philipov 2011). Evidence on the impact
of previous economic recessions suggests that
spells of unemployment seem to affect the timing
of births, but not the size of families (Adsera 2005;
Kravdal 2002). The rise in unemployment during
the recent economic crisis has created economic
uncertainties that may cause households to put off
having children. The consequences can be short
term if births are simply postponed or longer term
if the downturn persists and is not followed by a
catch-up in fertility.
Fertility responses to economic downturns
differ by gender and socioeconomic status (see
OECD 2011 for a review of empirical results). The
largest decline in birth rates is likely to be associated with poorly educated, low-skilled men. Available evidence for previous economic shocks in
Germany and Sweden suggests that women with
high levels of educational attainment are most
likely to postpone childbirth, especially if they
do not already have children; less well educated
women often maintain or increase the rate of entry
into motherhood (Hoem 2000; Kreyenfeld 2010).
In the decade before the recent economic crisis, the trend in many countries was for fertility
to increase. Partly this has been explained by the
diminishing impact on annual fertility of women
delaying having children until later in life. From
2000 onward, the rise in the age of women at childbirth slowed, and women started to have the children they had delayed (Goldstein, Sobotka, and
Jasilioniene 2009; Bongaarts and Sobotka 2012).
Recent changes in fertility rates suggest, however,
that the observed rise in total fertility rates reversed
in some countries. In Europe, the crisis was accom-
panied by a fall in fertility in countries that were
severely affected, such as Greece, Latvia, and
Spain. In contrast, in Iceland, Ireland, and Romania,
fertility increased somewhat in the crisis period.
One explanation for this difference is that the
crisis has had a stronger impact on fertility in countries where younger people were disproportionately hit by unemployment, while in other countries family policies played a role in diminishing the
impact of the recession on fertility. Goldstein et
al. (2013) find a strong association between fertility and unemployment in the central, eastern, and
southern countries of Europe. The greatest effects
occur among the youngest age cohorts and in
first births, which makes sense because unemployment rates have jumped drastically among young
people, who also can postpone childbearing the
most easily. Whereas fertility rates declined markedly in Latvia in 2009, fertility in the other Baltic
states showed no major downturn. One possible explanation is that generous parental leave
schemes were introduced in the latter shortly
before the economic crisis. Fertility in countries
with a high level of welfare and family support,
such as France, Norway, Slovenia, and the United
Kingdom, has been more resilient in the face of
the recession.
The evidence on recent changes in fertility does
not allow a conclusive assessment of the impact of
the crisis, as a decline in fertility during the crisis
may simply reflect the postponement of births.
Thus, a few more years will be required before
the impact of the recent crisis on fertility can be
properly judged. But what is clear is that the crisis
has been more prolonged than past downturns in
the most severely hit countries and thus could have
more drawn-out implications for fertility.
2005; Del Boca, Pasqua, and Pronzato 2009). The likelihood of being in full-time
employment was 1.5 times greater or more among childless women than among
mothers aged 20–44 in Austria, Hungary, the Netherlands, Poland, Spain, and the
United Kingdom in the 1990s and up to around 2005 (Thévenon 2009). The likelihood of working part-time increases with the number of children in every country,
but especially in the Netherlands, where the vast majority of employed women
work part-time. Greulich, Dasre, and Inan (2014) find that the provision of child
48 ●
1980
2013
9
Total fertility rate, children per woman
FIGURE 1.3
A U-shaped relation is
emerging between fertility
and level of development
Golden Aging
7
5
3
1
0.2
0.3
0.4
0.5
0.6
0.7
0.8
0.9
1.0
Human Development Index
Sources: HFA-DB; WDI.
care coverage has a significant and positive effect on the likelihood of having a
second child, while the length of leave schemes and the amount of total cash
transfers (family benefits, leave benefits, and income tax rebates) have no significant effect. Luci-Greulich and Thévenon (2013) emphasize that increases in fertility
with economic development would be supported by institutional changes that
improve parents’ opportunities to combine work and family life. Myrskylä, Kohler,
and Billari (2011) argue that an increase in fertility in advanced countries is conditional on gender equality: countries ranking high in development (as measured by
health, income, and education) but low in gender equality continue to see declining fertility.
Employment status appears to have some effect on whether women have a
second child, which is the major difference between low- and high-fertility countries (see box 1.4). Being employed during the months before potential conception is found to significantly increase the probability of having a second child for
women aged 15–49, in comparison to both unemployed and inactive women
(Greulich, Dasre, and Inan 2014).6 Taking into account interaction effects, being in
stable employment is positively correlated to child arrival, particularly for women
who have a partner who is also in stable employment. These results are stronger
for high-fertility countries, such as Denmark, France, the Netherlands, Norway, and
Sweden, but do not hold in some lower-fertility countries, such as Latvia, Lithuania,
the Slovak Republic, and Slovenia, that have high full-time employment rates, low
fertility rates, and a low average probability of a second child. In these lower-fertility countries, the low probability of a second child may be explained by institutional barriers, such as family policies (parental leave or child care, for instance).
Women who already have one child may decide against a second for fear of a fall
in income after the birth of the second child. Or for families with insufficient incomes, the direct cost of having an additional child in itself may be a constraint.
The Drivers of Aging in Europe and Central Asia
BOX 1.3
● 49
Why Fertility Is Higher in France Than in Germany
Despite similar income per capita and recent history, Germany has a significantly lower fertility rate
than France, 1.36 versus 2.03, which is near the
replacement level (see table B1.3.1). An explanation of this disparity may lie in the more precarious
position of German women, particularly mothers,
in the labor market. German women face more
difficulty in reconciling work and family life. Once
they have children, German women are more likely
to drop out of the labor market or work part-time.
In France, by contrast, the gap in the employment
rate between childless women and women with
one or two children is fairly small.
Traditionally, German tax and expenditure policies have tended to provide only limited support
for working mothers. German spending on family support programs is relatively high (Thévenon
2011), including generous lump-sum grants and
tax reductions for married couples, but dualearner couples with young children have tended to
receive only limited support. Child care costs can
be deducted for tax purposes, but only to a small
extent. In general, child care facilities for children
aged 0–3 have been limited in Germany. Fewer
than 18 percent of under-three-year-olds were
enrolled in formal care services in 2010, although
an ambitious plan to develop child care facilities
was adopted in 2010 and helped raise public child
care coverage to 29.3 percent of under-three-yearolds (Rainer 2013). For children aged 3–6, there is a
system of mostly privately operated kindergartens,
but, as with the majority of schools for children
aged 6–18, they are often closed in the afternoon.
Because of the limited availability of child care
facilities, women have faced sizable barriers to full
reintegration into the labor market after childbirth
(Luci-Greulich 2011).
Recent reforms in Germany have aimed at
helping women return to the workforce after having children and have reduced the opportunity
cost for employed women to have children. This
is important, given the low fertility rates of educated women in Germany. Nearly a third (31 percent) of tertiary educated women in the former
West Germany have no children, and on average
they have 0.7 fewer children than women who have
not completed secondary school (Bujard 2012). In
2007, to encourage parents to combine work and
TABLE B1.3.1 Relationship between Work and Family Life, by Gender, France and
Germany, 2011–12
Indicator
Total fertility rate
Employment, women 20–64 years of age
Overall rate, %
Part time, % of total employment
Full time, % of total employment
Average hours of usual employment per week
Difference in employment rates of women and men (aged 20–49) with
and without a child
Formal part- or full-time child care, by age group of the child, % of the
relevant child population
Ages 0–2
Ages 3–6
Gender pay gap, average gross hourly earnings among women, % of
corresponding earnings among men
Gender pension gap, women relative to men, pensioners 65+, %
Women at risk of poverty or social exclusion, % of 55+ female population
France
Germany
2.03
1.36
65.0
30
70
34.6
71.5
45
55
30.5
–5
–18
45
97
25
90
14.7
39
17
22.2
44
22
Sources: Based on data in EU LFS; WDI.
Note: The data year depends on the indicator: EU LFS data are for 2011–12; WDI data are for 2011.
(Continued)
50 ●
BOX 1.3
Golden Aging
(continued)
family life, Germany reformed the parental leave
system following the Norwegian/Swedish model.
In the Norwegian/Swedish model, maternity leave
benefits are linked to a woman’s prebirth earnings,
with high replacement rates. This contrasts with the
pre-2007 reform scheme in Germany of flat transfers that did not compensate those with relatively
high prebirth earnings. Instead of a flat monthly
means-tested transfer targeted to lower-income
families over the 24 months after birth, parents now
receive a net wage substitution of 67 percent (to
a maximum of €1,800 a month) for 12 months. In
addition, fathers are explicitly encouraged to take
at least two months of leave. Raute (2014) assessed
the effects of the changes in parental leave benefits on fertility by taking advantage of the large
differences in parental leave benefits across education and income groups and found a positive and
statistically significant effect of a rise in benefits
on fertility. These results were driven mostly by
women in the middle and upper end of the education and income distribution. This suggests that
earnings-dependent parental benefits may have a
role in increasing the fertility rates of highly educated, higher-income women. Another 2013 reform
was the introduction of the right for every child
between the ages of one and three to have a place
in day care.
While German female employment rates are
actually above the European Union (EU) average,
the majority of women with children are working
part-time or in other precarious work arrangements
(mini-jobs). These are associated with low incomes,
limited career options, and insufficient social security. Difficulties in combining a professional career
with family life not only reduce fertility rates but
also contribute to widening the inequalities in Germany, because these difficulties result in economic
dependence among women and poverty among
single-parent families and elderly women.
In France, women are generally more successful
in combining work and family life, and family, social,
and labor market policies are more centralized than
in Germany. The promotion of equality between
men and women is seen as a universal goal that
applies to all policy domains. Gender equality in
work and family life is encouraged through a welldeveloped system of public child care and subsidized nannies, child minders, and all-day schools.
Ongoing reforms relate to parental leave, family
tax splitting, and the differences in costs of homebased versus center-based child care (Thévenon
2013). As a result, the majority of women, including
even women with young children, work full-time
or part-time but generally for longer hours than
women in Germany (part-time work in France usually involves a four-day week).
In Germany—particularly the more conservative
former West Germany—the imbalance between
work and family life among women reflects broader
social differences in attitudes toward combining
child rearing and work. Evidence from voting patterns in a 2004 Swiss referendum on a maternity
and parental leave system (subsequently established) reveals the effects of cultural norms on the
development of family support systems. Universal paid maternity leave received 9.2 percentage
points more votes in Romance-language border
towns than in German-language border towns
(Eugster et al. 2011). Cultural attitudes can differ
substantially even between closely neighboring
countries and communities.
Overall, these results suggest that stable employment among women does not
raise the probability of a second child on its own: the relationship with a partner
and the institutional context are also important. For some countries—particularly
those with lower income levels—the general economic conditions facing families
play an important role in whether people can afford to increase the family size. But
for many higher-income countries, the key barriers to having a second child are
difficulties associated with reconciling work and family life. The development of
The Drivers of Aging in Europe and Central Asia
BOX 1.4
● 51
Do Decisions on Having a Second Child Determine Variations
in Fertility across Europe?
An empirical investigation of individual fertility
behavior in Europe has been carried out using the
European Union Statistics on Income and Living
Conditions (EU-SILC) to determine whether the
fertility rates in the lowest-fertility countries are
caused by barriers to starting a family or barriers
to greater family size (see Greulich, Thévenon, and
Guergoat-Larivière 2014). a Figure B1.4.1 shows
the share of women aged 39–45 with 0, 1, 2, or
3 or more children in the 28 countries covered.
Several results stand out. First, the incidence of
childlessness is not remarkably higher in lowfertility countries than in high-fertility countries.
There are, however, exceptions. For example,
childless women represent a considerable share of
women in Austria, Germany, Italy, and Spain and a
growing share among women born after 1960 in
Central European and Baltic countries (especially
Hungary, Poland, and Romania). Second, the share
of women having only one child is about twice
as high in low-fertility countries as in high-fertility
countries. Third, in high-fertility countries such as
Denmark, Finland, Iceland, Norway, and Sweden
about 70 percent of women aged 39–45 have
two or more children, but in low-fertility countries
such as Austria, Bulgaria, Germany, Italy, Latvia,
Portugal, and Romania the share is only around
50 percent. This suggests that there are barriers to having a second child in most low-fertility
countries. Indeed, the probability of transitioning
from the first to a second child is about 20 percentage points lower in these lower-fertility countries than in France or the high-fertility Nordic
countries.
FIGURE B1.4.1 Having two children was most common for women aged 39–45 in Europe, 2008
100
40
36
24
25
17
26
27
14
32
27
21
35
23
27
19
22
23
14
20
11
7
13
11
17
39
39
49
48
53
43
42
53
36
39
45
31
42
38
45
39
35
44
37
47
48
41
42
36
12
15
12
9
40
35
35
32
80
Percent
60
37
40
20
10
12
18
17
21
19
19
24
15
9
9
10
8
11
18
23
14
12
8
10
15
17
19
18
21
17
9
20
19
26
20
14
ak
ov
Sl
32
19
Country
0 children
Source: EU-SILC.
31
14
15
26
35
24
22
22
16
Re
pu
b
De lic
nm
a
Sl rk
ov
en
Sw ia
ed
e
Cz No n
ec rw
h R ay
ep
ub
li
Fin c
lan
d
P
Ne ola
th nd
er
lan
d
Ire s
lan
d
Fra
nc
Es e
to
n
Hu ia
Le nga
xe ry
mb
ou
Be rg
lgi
um
Un
ite Gre
d K ece
ing
do
m
Sp
ain
Bu
lga
Po ria
rtu
Lit gal
hu
an
i
Au a
str
ia
Ita
ly
La
tvi
Ge a
rm
a
Ro ny
ma
nia
15
31
us
9
22
24
pr
d
21
22
Cy
lan
27
14
0
Ice
26
27
28
1 child
2 children
3 or more children
52 ●
Golden Aging
child care services tends to reinforce the positive impact of stable employment on
women’s decisions to have a second child. Moreover, the positive interaction between the development of child care services and stable employment suggests
that reconciliation issues between work and family life are at the core of women’s
fertility choices. Countries in which child care structures are well developed tend
to combine the integration of women into the labor market with a higher probability that women will have a second child.
The link between fertility and labor market participation is relevant for older
European countries, but, as opportunities increase for women to join the formal
labor market, it is also likely to become a feature for the young countries in the
region. In a background paper for this report, Greulich, Dasre, and Inan (2014)
conduct an analysis of the socioeconomic determinants of child arrival in Turkey
using longitudinal data from the European Union Statistics on Income and Living
Conditions (EU-SILC) covering the years 2006–11, where individuals are followed
up for a maximum period of four years. Female participation in the labor market is
relatively low in Turkey, at 30 percent. The findings of the analysis show varying
results depending on level of education. For educated women (with at least
Since the 1960s,
a primary diploma), being in stable employment has a significant and
the Europe and Central
negative effect on childbearing, regardless of birth rank. Employment is
more negatively correlated with child arrival for a third child in compariAsia region has added
son to a second or first child. But being employed does not significantly
only 10 years to average
reduce the probability of child arrival for uneducated women or for
life expectancy, the
women who work in agriculture as family workers and who work inforsmallest gain across all
mally. What is behind this result? The more children an educated woman
has in Turkey, the less likely she is to work. The opportunity cost of having
global regions.
a child for an employed, well-educated woman is then high, particularly in
the absence of significant government support. In contrast to highly educated
women, less educated women working in subsistence activities are less likely to
exit employment due to having a child. Of course, education and type of employment could also be capturing nonobservable characteristics like cultural norms or
access to family planning. But this analysis suggests that fertility may continue to
fall in the young countries of Central Asia and Turkey without stronger efforts to
support the integration of mothers into the labor force as they become more educated and are more likely to be in the formal labor market.
The Slower Improvement of Life Expectancy in Europe
and Central Asia
Since the 1960s, the Europe and Central Asia region has experienced the smallest
gains in life expectancy of all global regions (figure 1.4). Since 1960, people in this
region have added only 10 years to average life expectancy, whereas life expectancy has increased by 18 years in Latin America and the Caribbean—another
middle-income region with a rapidly aging population—and by more than 27
years in East Asia and the Pacific. A person born in Europe and Central Asia in 2011
can expect to live 72 years, a full 10 years less than a counterpart in the EU-15
countries. This divergence is even starker if better performers such as Turkey and
70
65
EU-15
Europe and Central Asia
Latin America and the Caribbean
East Asia and Pacific
Middle East and North Africa
South Asia
Sub-Saharan Africa
60
55
50
45
85
80
75
70
65
60
55
50
45
Year
Sources: WDI; HFA-DB.
the Western Balkans are excluded from the regional average. In essence, although
the number of older people is rising in the region, many people’s lives are shorter
than they could be.
Gains in male life expectancy have been particularly limited in Belarus, Bulgaria,
the Czech Republic, Hungary, Moldova, Poland, Romania, Russia, the Slovak Republic, and Ukraine (the group defined as Eastern Europe by the United Nations’
World Population Prospects, which is used here as it has the longest time series for
cross-country comparison). The gap in male life expectancy between Eastern Europe and Southern Europe grew from five years in 1950–55 to 13 years in 2005–10
(figure 1.5). In contrast, Western Europe—Austria, Belgium, France, Germany, Luxembourg, the Netherlands, and Switzerland—achieved the highest male life expectancy, on average 77 years at birth, in 2005–10. In 1950–55, Central Asia—
Kazakhstan, the Kyrgyz Republic, Tajikistan, Turkmenistan, and Uzbekistan—had
an average male life expectancy of 50 years, as did Latin America and the Caribbean; East Asia was even lower, at 46 years. However, Central Asia failed to keep
up with the gains of these other areas. By 2005, men in Latin America and the
Caribbean had gained 21 years and in East Asia 28 years, compared with only 12
years in Central Asia. As in Eastern Europe, life expectancy of men in Central Asia
stagnated during the transition to a market economy that began in 1990.
In contrast to global trends, mortality in middle age has hardly improved in the
region and indeed has become worse for men in their mid-40s to early 60s (see
figure 1.6, where higher values indicate greater declines in mortality, and lower
values signify smaller declines in mortality).
Middle-aged men (45–59 years) in the region were dying at higher rates in 2010
than in 1970. Moreover, mortality among 60- to 79-year-old men has barely
changed over the past 40 years, compared with a consistent 30–40 percent decline worldwide. While adult women fare better than men at all ages except for the
oldest (80+ years), they are still not reaping the rewards of the longer average lives
60
19
08
20
10
20
12
06
20
04
20
02
20
00
20
98
20
96
19
94
19
92
19
90
19
88
19
86
19
84
19
82
19
80
19
78
19
76
19
74
19
72
19
70
19
68
19
66
19
19
19
19
64
35
62
40
35
60
40
6
75
Life expectancy at birth, years
Africa
80
19
entral Asia
and the Caribbean
Pacific
nd North Africa
FIGURE 1.4
Life expectancy gains in
Europe and Central Asia
have been the lowest in
the world
85
Life expectancy at birth, years
y gains in
ntral Asia
lowest in
● 53
19
The Drivers of Aging in Europe and Central Asia
54 ●
60
57
55
5 years
50
45
–0
5
–1
0
05
20
00
20
00
0
–2
5
95
90
–9
19
19
–9
0
85
–8
5
80
19
–8
0
19
75
19
–7
5
70
19
–7
0
–6
5
65
19
60
–6
0
40
19
Eastern Asia
61
55
Central Asia
64
65
19
Eastern Europe
70
–5
5
Southern Europe
13 years
75
50
Western Europe
77
19
Northern Europe
80
Male life expectancy at birth, years
FIGURE 1.5
Life expectancy of men in
Eastern Europe has diverged
from the better performers
in Europe
Golden Aging
Years
Source: World Population Prospects: The 2012 Revision.
Note: The figure shows male life expectancy at birth by United Nations level-2 regional classifications.
This grouping is different from the country grouping used by this report. The divergence in years between life expectancy in regions may differ from whole-number calculations due to rounding. Eastern
Europe comprises Belarus, Bulgaria, the Czech Republic, Hungary, Moldova, Poland, Romania, the
Russian Federation, the Slovak Republic, and Ukraine. Northern Europe includes Denmark, Estonia,
Finland, Iceland, Ireland, Latvia, Lithuania, Norway, Sweden, and the United Kingdom. Southern
Europe consists of Albania, Bosnia and Herzegovina, Croatia, Greece, Italy, FYR Macedonia, Malta,
Montenegro, Portugal, Serbia, Slovenia, and Spain. Western Europe includes Austria, Belgium, France,
Germany, Luxembourg, the Netherlands, and Switzerland. Central Asia includes Kazakhstan, the Kyrgyz
Republic, Tajikistan, Turkmenistan, and Uzbekistan. Eastern Asia includes China, Japan, Mongolia, the
Democratic People’s Republic of Korea, and the Republic of Korea.
that have occurred in all other regions, with the exception of Sub-Saharan Africa,
where gains were reversed due to the HIV epidemic.
Large differences in mortality rates that persist over significant periods of time
have important implications for the age structure of the population. For illustration,
figure 1.7 shows estimations of how Ukraine’s population would appear today if it
had experienced the same reductions in mortality as France since 1950. Overall, if
Ukraine had experienced the same mortality reductions, its labor force would be
19 percent larger today.
Longevity varies widely across population groups. In Europe and Central Asia,
women live longer than men, and people in richer socioeconomic groups also live
longer. Poorly educated men in many countries enjoy considerably fewer life years
than the rest of the population. International evidence shows that countries with
the least inequality in life spans are those that enjoy the longest average life expectancies (Christensen et al. 2009). To catch up with the EU-15, countries in the
region would have to focus on increasing average life expectancy among less
advantaged population segments.
The Drivers of Aging in Europe and Central Asia
FIGURE 1.6
The midlife mortality crisis
continues in Europe and
Central Asia, 1970–2010
a. Europe and Central Asia
100
80
Women
Men
60
40
20
60
40
20
<1
+
9
80
4
–7
75
9
–7
70
4
–6
65
9
–6
60
4
–5
55
9
–5
50
4
–4
45
9
–4
40
4
–3
35
9
–3
30
4
–2
25
9
–2
20
–1
15
–1
10
5–
4
–20
9
–20
4
0
<1
0
1–
Decline in mortality rate, %
80
100
Decline in mortality rate, %
rtality crisis
rope and
970–2010
● 55
Age group
80
80
70
70
Decline in mortality rate, %
90
60
50
40
30
20
60
50
40
30
20
<1
+
9
80
4
–7
75
9
–7
70
–6
65
4
9
–6
60
4
–5
55
9
–5
50
4
–4
45
9
–4
40
–3
35
4
9
–3
30
4
–2
25
9
–2
20
4
–1
15
–1
10
5–
9
0
4
10
0
<1
10
1–
Decline in mortality rate, %
b. Western Europe
90
Age group
80
70
70
Decline in mortality rate, %
60
50
40
30
20
60
50
40
30
20
Age group
Sources: Institute for Health Metrics and Evaluation 2010; Global Burden of Disease Study 2010.
<1
80
–1
10
5–
+
0
4
15
–1
9
20
–2
4
25
–2
9
30
–3
4
35
–3
9
40
–4
4
45
–4
9
50
–5
4
55
–5
9
60
–6
4
65
–6
9
70
–7
4
75
–7
9
0
9
10
<1
10
1–
4
Decline in mortality rate, %
c. Global
80
56 ●
Golden Aging
FIGURE 1.7
What a difference 60 years
make: Ukraine’s population
structure in 2010 if mortality
had declined as in France
from 1950
Size of age cohort in 2010 if Ukraine had
experienced a decline in mortality as in
France after 1950
100+
95–99
90–94
85–89
80–84
75–79
70–74
65–69
60–64
55–59
50–54
45–49
40–44
35–39
30–34
25–29
20–24
15–19
10–14
5–9
0–4
Age cohort
Male, actual
Female, actual
Ukraine 2010
3
2
1
0
0
1
2
3
Cohort population, millions
Source: World Bank calculations based on World Population Prospects: The 2012 Revision.
The Contribution of Migration to Aging in Some
Countries
Most countries in Europe and Central Asia exhibit high rates of emigration (figure
1.8). For example, in Albania, Georgia, and Moldova, the number of emigrants
represented more than 10 percent of the population in 2000–10. This level of emigration is also high relative to other regions, such as Latin America. In contrast,
Russia has been a net receiver of migrants.
Migration flows are contributing to aging in Central Europe and the Baltics
(figure 1.9a). Migration in the region follows two distinct patterns: most migrants
from Central Asia, the Eastern Partnership, and Russia move within this group of
countries, while migrants from Central Europe and the Baltics move mostly to
Western Europe. Migrants from each subregion are more likely than the people
they leave behind to be part of the working-age population (figure 1.9b).
For example, significant emigration from Central Europe and the Baltics in
2000–10 resulted in a severe shrinkage in the size of younger age cohorts. Conversely, immigration is making Western Europe younger: the age structure of migrants born in Central Europe and the Baltics and now living in Western Europe is
more concentrated at younger ages than the age structure of individuals born and
living in Western Europe. The same patterns emerge from an analysis of the effects
of migration from Central Asia on the age structure of Russia.7
Migration is playing an important role in shaping the population structure in
many countries in Europe and Central Asia (figure 1.10). In Central Europe and the
Baltics, emigration sped up following EU accession and the opening up of some
labor markets in 2004. Latvia has experienced the largest population decline in the
The Drivers of Aging in Europe and Central Asia
● 57
FIGURE 1.8 Europe and Central Asia is currently a region of emigrants
Eastern Partnership
and Russian Federation
Young countries
Subregion and country
Western Balkans
Central Europe
Baltics
Western Europe
Other
Moldova
Georgia
Armenia
Ukraine
Belarus
Russian Federation
Kyrgyz Republic
Uzbekistan
Turkmenistan
Tajikistan
Turkey
Kazakhstan
Azerbaijan
Albania
Serbia
Montenegro
Macedonia, FYR
Bosnia and Herzegovina
Bulgaria
Croatia
Poland
Romania
Slovak Republic
Hungary
Slovenia
Czech Republic
Lithuania
Latvia
Estonia
Greece
Germany
Netherlands
Finland
Denmark
France
Malta
Portugal
United Kingdom
Iceland
Sweden
Austria
Belgium
Norway
Italy
Switzerland
Ireland
Spain
Luxembourg
Latin America and the Caribbean
Africa
United States
Oceania
–15
–10
0
–5
5
10
15
Net immigration rate 2000–10 per 100 population in 2000
2000–05
2005–10
Source: World Population Prospects: The 2012 Revision.
Note: The data are derived from a variety of sources, including border statistics, administrative records, surveys, and censuses, that may differ in
quality and accuracy.
58 ●
Golden Aging
FIGURE 1.9 Migrants from Europe and Central Asia are making rich countries younger (a) and poor
countries older (b)
a. Natives vs. foreign-born
Population structure, %
30
20
10
0
15–19
20–24
25–29
30–34
35–39
45–49
40–44
50–54
55–59
60–64
65–69
> 69
Age group
Population living in Western Europe, but born in
Turkey
Western Balkans
Central Europe and the Baltics
Eastern Partnership, Russian
Federation, and Central Asia
Western Europe native population
b. Nonmigrants vs. migrants
0
9
15
69
10
>6
64
65
–
59
60
–
54
55
–
49
50
–
Age group
Age group
Turkey
10
9
4
9
9
>6
–6
65
–6
60
4
55
–5
9
–5
–4
50
9
4
–4
35
40
4
Age group
age-group
–3
9
–3
30
–2
25
20
–2
4
0
–1
–5
4
55
–5
9
60
–6
4
65
–6
9
>6
9
50
–4
9
–4
4
45
40
–3
9
35
–3
4
30
–2
9
25
20
15
–2
4
0
20
15
10
30
9
Population structure, %
20
–1
9
Population structure, %
Central Europe and the Baltics
30
45
44
45
–
39
40
–
34
35
–
29
30
–
25
–
20
–
15
–
24
0
20
20
10
Eastern Partnership, Russian Federation,
and Central Asia
30
–1
9
–2
4
25
–2
9
30
–3
4
35
–3
9
40
–4
4
45
–4
9
50
–5
4
55
–5
9
60
–6
4
65
–6
9
>6
9
Population structure, %
20
19
Population structure, %
Western Balkans
30
Age group
Nonmigrants
Migrants to Western Europe
Source: World Bank calculations based on DIOC.
region in recent years, a fall of over a fifth since 1990, and about 60 percent of this
decline was due to emigration.8 The recent financial crisis provided additional
impetus for younger segments of the population to leave. Whether emigration will
continue at these rates is an open question.
The Drivers of Aging in Europe and Central Asia
● 59
FIGURE 1.10 Migration played a role in population decline in many Central European countries
100
80
Percent
60
40
20
0
–20
–40
La
tvi
Ge a
or
g
M ia
old
ov
a
Es
to
nia
Lit
hu
an
Ar ia
Bo
me
sn
n
ia
an Bu ia
d H lg
er aria
ze
go
vin
Uk a
ra
ine
Cr
oa
ti
Al a
ba
nia
Be
lar
Ro us
ma
n
Ru
H ia
ss
ian ung
a
Fe
de ry
ra
Ka tion
za
kh
sta
n
Se
rb
ia
P
M olan
on
d
t
Cz en
ec
e
h R gro
ep
ub
li
Sl Slo c
ov
ve
ak
nia
M Re
ac pu
ed bli
o
c
Ky nia
,
rg
yz FYR
Re
pu
Az blic
er
ba
ija
n
Tu
r
Uz k e y
be
Tu kis
rkm tan
en
is
Ta tan
jik
ist
an
–60
Country
Births
Deaths
Net immigration rate
Population change, 1990–2010
Source: World Bank calculations based on World Population Prospects: The 2012 Revision.
Migration flows could potentially be a powerful instrument for offsetting the
effects of aging on the economy. If the constraints on immigration were relaxed,
workers would relocate from low- to high-productivity economies, and efficiency
would increase. Empirical studies show that the welfare gains from the elimination
of restrictions on labor mobility are enormous.9 In these models, a large share of
the estimated welfare gains arises from the higher incomes that the new migrants
earn in the destination countries, compared with what they would have earned in
their countries of origin. Remittances from emigrants, coupled with technology
transfers and trade links provided by migrant networks, mean that sending countries can also reap substantial benefits from emigration.
The contribution of immigrants to regional economies may be greater than
indicated by their number. Employment and labor force participation rates have
been, respectively, four and five percentage points higher on average among
foreign-born individuals than natives in Central Europe and the Baltics and in Turkey since 2000 (figure 1.11). Nonetheless, there is substantial heterogeneity across
economies. While immigrants perform better than natives in most of Central
Europe and the Baltics and in Turkey, the opposite is true in Russia. The better labor market performance of immigrants in Central Europe and the Baltics is driven
to a large extent by the characteristics of the migrants: they are more likely to be
men and to possess a college degree and are less likely to be enrolled in school
than natives. In fact, controlling for these observable characteristics, researchers
find that migrants perform worse than natives not only in labor force participation
and employment rates but also in wages.
Evidence from Europe shows that immigration does not seem to have a large
negative impact on the employment or wages of natives. Indeed, Docquier,
Özden, and Peri (2010) find that immigrants to Western Europe from 1990 to
2000 had skills that were complementary to those of natives and hence contributed to increasing wages and reducing inequality among natives. The massive
movements of workers from east to west after the 2004 and 2007 EU enlarge-
60 ●
Golden Aging
FIGURE 1.11 Migrants are more likely to be active and employed than natives, circa 2000–10
a. Employment rates
100
90
Percent
80
70
60
50
40
Turkey
Poland
Latvia
Hungary
Lithuania
Slovenia
Estonia
Slovak
Republic
Romania
Czech
Republic
Bulgaria
Russian
Federation
Slovak
Republic
Czech
Republic
Latvia
Russian
Federation
Bulgaria
Country
b. Labor force participation rates
100
90
Percent
80
70
60
50
40
Turkey
Romania
Hungary
Poland
Slovenia
Estonia
Lithuania
Country
Natives
Migrants
Natives (average)
Migrants (average)
Sources: Data for the Russian Federation: RLMS–HSE (database); for Turkey: Labour Force Statistics, TurkStat, Ankara,
/Start.do; for all other countries: EU LFS.
ments do not appear to have had a major impact on the labor markets of receiving economies.10
While emigration can affect the labor markets of sending economies by shrinking the working-age population, it may also benefit those who are left behind.
Emigration may decrease the returns to complementary inputs (such as capital or
workers with different skill levels) but increase the returns to nonemigrating workers with similar skills. Evidence on Lithuania and Moldova—where emigration is, in
relative terms, among the largest in the world—shows that a rise in emigration has
a positive, albeit small, effect on the wages of nonmigrants (Bouton, Paul, and
Tiongson 2011; Elsner 2013). This experience is similar, although smaller in magnitude, to the rise in wage rates in Europe as a result of the mass emigration to the
Americas in the late 19th and early 20th centuries (box 1.5). College graduates in
The Drivers of Aging in Europe and Central Asia
BOX 1.5
● 61
Lessons of the Age of Mass Migration
More than 50 million Europeans emigrated during the age of mass migration from 1850 to 1930.
The vast majority left for the New World, where
the scarcity of labor and the abundance of natural resources widened the wage gap with the Old
World. Others chose a new home within Europe.
Emigration during this period was driven by high
and rising rates of natural population increase, real
wage gaps, and migrant networks (Hatton and
Williamson 1992). In certain decades during this
period, countries such as Ireland, Italy, and Norway were losing an average of about 1 percent of
their populations each year because of emigration.
Meanwhile, immigration significantly contributed
to increasing the populations of Argentina, Australia, Canada, and the United States.
Unlike today, the higher fertility rates and lower
life expectancy of this period meant that aging
populations in the Old World were not a concern.
On average, the share of 65-year-olds in the population was only 5 percent in 1870 and increased
by only two percentage points over the next 40
years. However, emigration seems to have had a
large impact on total dependency ratios in the Old
World. Indeed, the difference between the growth
rate of the active population and the growth rate
of the dependent population in the Old World during this period can be fully explained by emigration
flows (Williamson 1998).
This era of open borders was accompanied by
an economic convergence across countries that
had never before been witnessed. Among nations
receiving and sending migrants, economic indicators such as real wages, gross domestic product
(GDP) per capita, and GDP per worker tended to
improve more in economies that had been lagging
in 1870 than in their initially more well-off counterparts. Taylor and Williamson (1997) estimate that
mass migration was, by far, the main factor responsible for the process of economic convergence during this period. Emigrants from the Old World con-
tributed to a rise in wage rates that was relatively
much greater in the sending economies than in the
receiving economies, and they provided a factor
of production to sustain economic growth in the
receiving economies.
As the convergence continued, real wages in
Europe were catching up with those in the New
World, which tended to keep more potential
migrants at home and thereby maintain lower emigration rates. Then, the age of uncontrolled mass
migration ended because of war and the emergence of restrictions on immigration in receiving
countries (the landmark event was the introduction
of immigration quotas in the United States in the
1920s). Consequently, the rapid economic convergence significantly slowed over the next 40 years
(Taylor and Williamson 1997).
Nowadays, the countries of Western Europe
are among the favorite destinations of migrating
workers in search of better opportunities, including workers from Europe and Central Asia. The
long-term experience of Western Europe provides two important messages for countries in
the region today. First, emigration can be beneficial for those who move, but also for those who
are left behind who can benefit from increases
in real wages. Second, immigration flows are
volatile; changing attitudes in receiving countries, economic upheavals, and conflict can lead
to abrupt changes in the ability and willingness
of migrants to seek out new lives. In the United
States, the anti-immigrant sentiment started to
take hold in the latter half of the 1800s, when
the main source of immigrants began changing
from wealthier parts of northern Europe to poorer
areas of Central, Eastern, and Southern Europe.
However, the effort to enact laws to restrict immigration required a quarter-century. In the end, it
was exogenous forces—economic downturn, war,
a rash of labor unrest—that helped close the door
(Goldin 1994).
62 ●
Golden Aging
most Central European and Baltic economies generally experienced a positive,
though small, increase in wages as a result of emigration during the 1990s. In
contrast, less well educated workers witnessed a decline in wages and employment (Docquier, Özden, and Peri 2010).
Toward More Balanced Age Structures over the
Next Half-Century
Rapid drops in fertility across age groups, baby booms, limited improvements in
longevity at middle age, and upticks in emigration among younger age groups
have led to large differences in size across age cohorts in the region. In the Eastern
Partnership countries and Russia, the cohorts born between 1956–65 and 1981–90
are larger than other age groups (figure 1.12), while cohorts born in the 1980s are
particularly large relative to other subregions (table 1.2). By contrast, the relatively
young countries of Turkey and Central Asia reflect the bottom-heavy age structure
typical of the high fertility of the earlier transition stage: 56 percent of the population is under 30 years of age. Of course, individual countries have divergent demographic histories, so this dating may not be appropriate for all countries. In
Romania, for example, the Ceaus¸escu regime’s policies aimed at increasing the
population resulted in a rise in births over 1967–89.
The substantial imbalances in the Eastern Partnership countries and Russia are
expected to ripple through the population structure in the next 50 years. By 2060,
if fertility were to recover, the age structure would be more balanced, with roughly
similar population shares in all age cohorts, with the exception of the very old
(figure 1.12). A similar evolution is expected for Turkey and Central Asia, although
their relatively young populations in 2010 would mean that by 2060 their middleaged groups would have a somewhat larger share of the population than in Central Europe and the Baltics and the Western Balkans (figure 1.13).
The region’s aging societies will face changes in needs generated by age
groups of different sizes going forward. For example, the shrinking of student
FIGURE 1.12 The larger cohorts aged 20–29 and 45–54 of Eastern Partnership countries and the Russian
Federation in 2010 will transition through the population structure
100+
95–99
90–94
85–89
80–84
75–79
70–74
65–69
60–64
55–59
50–54
45–49
40–44
35–39
30–34
25–29
20–24
15–19
10–14
5–9
0–4
100+
95–99
90–94
85–89
80–84
75–79
70–74
65–69
60–64
55–59
50–54
45–49
40–44
35–39
30–34
25–29
20–24
15–19
10–14
5–9
0–4
5
4
3
Males
2
1
0
0
Percent
1
2
3
4
Females
5
5
4
3
Males
2
1
0
0
Percent
Age group
c. 2060
100+
95–99
90–94
85–89
80–84
75–79
70–74
65–69
60–64
55–59
50–54
45–49
40–44
35–39
30–34
25–29
20–24
15–19
10–14
5–9
0–4
Age group
b. 2030
Age group
a. 2010
1
2
3
4
Females
5
5
4
3
Males
2
1
0
0
Percent
1
2
3
4
Females
Source: World Bank calculations based on World Population Prospects: The 2012 Revision.
Note: Data are the sum of the population of the country group, and thus the outcome is dominated by the Russian Federation, the most
populous country.
5
The Drivers of Aging in Europe and Central Asia
● 63
TABLE 1.2 Dates of Birth of the Largest Age Cohorts, by Subregion, 2010
EU-15, Northern
and Central Europe
Age in 2010
0–4
5–9
10–14
15–19
20–24
25–29
30–34
35–39
40–44
45–49
50–54
EU-15, Southern
Europe
Western
Balkans
1991–95
1986–90
1981–85
1976–80
1976–80
1971–75a
1966–70a
1961–65
1971–75
1966–70
1961–65
1956–60
Central Europe
and the Baltics
(plus Cyprus
and Malta)
Eastern Partnership and
Russian Federation
2006–10a
2001–05a
1996–2000a
1991–95a
1986–90a
1981–85a
1986–90a
1981–85a
1976–80
1981–85
1976–80
1971–75
Young countries
1961–65
1956–60
1956–60
Source: World Bank calculations based on World Population Prospects: The 2012 Revision.
Note: Age cohorts are considered among the largest if they exhibit the greatest deviation from a hypothetical population structure that is equally
balanced across all age cohorts. The young countries include Turkey and Central Asia.
a. The age cohort is particularly large relative to the corresponding age cohort in other subregions.
6 5 4 3
Males
2 1
b. 2030
c. 2060
100+
95–99
90–94
85–89
80–84
75–79
70–74
65–69
60–64
55–59
50–54
45–49
40–44
35–39
30–34
25–29
20–24
15–19
10–14
5–9
0–4
0
0 1 2 3 4 5 6
100+
95–99
90–94
85–89
80–84
75–79
70–74
65–69
60–64
55–59
50–54
45–49
40–44
35–39
30–34
25–29
20–24
15–19
10–14
5–9
0–4
0
0
100+
95–99
90–94
85–89
80–84
75–79
70–74
65–69
60–64
55–59
50–54
45–49
40–44
35–39
30–34
25–29
20–24
15–19
10–14
5–9
0–4
0
0
Percent
Females
5
4
3
2
Males
1
Percent
Age group
a. 2010
Age group
Age group
FIGURE 1.13 Rapid aging is expected in Central Asia and Turkey over 2010–60
1
2
3
4
5
4
Females
Source: World Bank calculations based on World Population Prospects: The 2012 Revision.
populations has allowed countries to cut back on education infrastructure. Likewise, a surge in deaths for a transitional time period would imply increasing demand for health services. A wave of people reaching pension age at the same time
would place additional demands on public budgets, which requires planning (see
the discussion on the fiscal consequences of aging in chapter 3). But these waves
of larger age groups are part of the transition to a more balanced population
structure and so are expected to be temporary. The transition period will be long,
however.
3
2
Males
1
Percent
1
2
3
Females
4