Assignment 3 Marketing Intelligence FPT Greenwich
Bạn đang xem bản rút gọn của tài liệu. Xem và tải ngay bản đầy đủ của tài liệu tại đây (1.44 MB, 40 trang )
qwertyuiopasdfghjklzxcvbnmqw
ertyuiopasdfghjklzxcvbnmqwert
yuiopasdfghjklzxcvbnmqwertyui
Marketing Intelligence
opasdfghjklzxcvbnmqwertyuiopa
Assignment 3
sdfghjklzxcvbnmqwertyuiopasdf
[Pick the date]
Ha Hung Minh
ghjklzxcvbnmqwertyuiopasdfghj
klzxcvbnmqwertyuiopasdfghjklz
xcvbnmqwertyuiopasdfghjklzxcv
bnmqwertyuiopasdfghjklzxcvbn
mqwertyuiopasdfghjklzxcvbnmq
wertyuiopasdfghjklzxcvbnmqwe
rtyuiopasdfghjklzxcvbnmqwerty
1. (4.1)Evaluate techniques of assessing customer response
Define
Advantages
Sample survey
Experiment
Observational
A sample survey is a study
An experiment is a
Like experiments,
that obtains data from a
controlled study in which
observational studies
subset of a population, in
the researcher attempts to
attempt to understand
order to estimate
understand cause-and-
cause-and-effect
population attributes.
effect relationships. The
relationships. However,
study is "controlled" in the
unlike experiments, the
sense that the researcher
researcher is not able to
controls how subjects are
control how subjects are
assigned to groups and
assigned to groups and/or
which treatments each
which treatments each
group receives.
group receives.
Relatively easy to
The people conducting the
Very direct method for
administer
research have a very high
collecting data or
Can be developed in less
level of control over their
information – best for the
time (compared to other
variables. By isolating and
study of human behavior.
data-collection methods)
determining what they are
Data collected is very
Cost-effective, but cost
looking for, they have a
accurate in nature and also
depends on survey mode
great advantage in finding
very reliable.
Can be administered
accurate results.
Improves precision of the
remotely via online,
Can be used in many
research results.
mobile devices, mail,
different types of
Problem of depending on
email, kiosk, or telephone. situations. Just like
respondents is decreased.
Conducted remotely can
pharmaceutical companies
Helps in understanding the
reduce or prevent
can utilize it, so can
verbal response more
geographical dependence
teachers who want to test
efficiently.
Capable of collecting data
a new method of teaching.
By using good and modern
from a large number of
It is a basic, but efficient
gadgets – observations can
respondents
type of research.
be made continuously and
Numerous questions can
Since there is such a high
also for a larger duration of
be asked about a subject,
level of control, and only
time period.
giving extensive flexibility
one specific variable is
Observation is less
in data analysis
being tested at a time, the
demanding in nature,
With survey software,
results are much more
which makes it less bias in
advanced statistical
relevant than some other
working abilities.
techniques can be utilized
forms of research. You can
By observation, one can
to analyze survey data to
clearly see the success,
identify a problem by
determine validity,
failure, of effects when
making an in depth
reliability, and statistical
analyzing the data
analysis of the problems.
significance, including the
collected.
(mbaofficial, 2013)
ability to analyze multiple
There is a very wide variety
variables
of this type of research.
A broad range of data can
Each can provide different
be collected (e.g.,
benefits, depending on
attitudes, opinions,
what is being explored. The
beliefs, values, behavior,
investigator has the ability
factual).
to tailor make the
Standardized surveys are
experiment for their own
relatively free from
unique situation, while still
several types of errors.
remaining in the validity of
(snapsurveys, 2013)
the experimental research
design. (flowpsychology,
2013)
Disadvantages Respondents may not feel
Just like anything, errors
Problems of the past
encouraged to provide
can occur. This is especially
cannot be studied by
accurate, honest answers
true with experiments. Any
means of observation.
Respondents may not feel
form of error, whether a
Having no other option
comfortable providing
systematic (error with the
one has to depend on the
answers that present
experiment) or random
documents available.
themselves in an
error (uncontrolled or
Observations like the
unfavorable manner.
unpredictable), or human
controlled observations
Respondents may not be
errors such as revealing
require some especial
fully aware of their
who the control group is,
instruments or tools for
reasons for any given
they can all completely
effective working, which
answer because of lack of
destroy the validity of the
are very much costly.
memory on the subject,
experiment.
One cannot study opinions
or even boredom.
By having such deep
by this means.
Surveys with closed-
control over the variables
Attitudes cannot be
ended questions may
being tested, it is very
studied with the help of
have a lower validity rate
possible that the data can
observations.
than other question types. be skewed or corrupted to
Sampling cannot be
The number of
fit whatever outcome the
brought into use.
respondents who choose
researcher needs. This is
Observation involves a lot
to respond to a survey
especially true if it is being
of time as one has to wait
question may be different
done for a business or
for an event to happen to
from those who chose not
market study.
study that particular event.
to respond, thus creating
With experimental testing
The actual presence of the
bias.
individual experiments
observer himself Vis a Vis
Survey question answer
have to be done in order to
the event to occur is
options could lead to
fully research each
almost unknown, which
unclear data because
variable. This can cause the
acts as a major
certain answer options
testing to take a very long
disadvantage of
may be interpreted
amount of time and use a
observation.
differently by
large amount of resources
Complete answer to any
respondents. Customized
and finances. These costs
problem or any issue
surveys can run the risk of
could transfer onto the
cannot be obtained by
containing certain types
company, which could
observation alone.
of errors. (snapsurveys,
inflate costs for consumers.
(mbaofficial, 2013)
2013)
(flowpsychology, 2013)
2. (2.4)Prepare a marketing research plan to obtain information
on customer satisfaction for your client
Research problem
After running for 3 months, Ress Pub is facing with low customers lead to low revenue. Customers are
no longer enthusiastically participating in the event of Ress Pub. The number of loyal customer also
decreased significantly.
Customers decrease maybe dependence on satisfaction. Customers feel some services that make they
are not satisfied and no longer interested to go to Ress pub. Therefore, the authors decided to do
survey research about customer satisfaction, the main object is customers of Ress Pub, aged 18-24
years old. Author use quantitative for this research.
Research purpose
The main purpose of this survey is to assess the level of customer satisfaction with the services of Ress
Pub. Based on customer satisfaction, Ress Pub can evaluate the weaknesses, strengths to repairs and
upgrades.
Research objectives
There are 2 main purposes in this research: Customer satisfaction and weaknesses, strengths of Ress
Pub.
Objectives to complete the evaluation about Customer satisfaction:
-
Step 1: Filter out the target customers that Ress pub wants to analyze. Ress pub want to focus
on analyzing customers aged 18-24 so the question in personal information will filter out the
target customers.
-
Step 2: Customers should evaluate the services from general to specific. Therefore, question
design in this research will have general question and detail question. After collect the
database, author will analyze the customer satisfaction from general to detail in each service
Evaluate weaknesses, strengths of Ress Pub
-
Step 1: understanding customer tastes (based on question 3)
-
Step 2: assess the current time are doing well or not based on the tastes of customers (based
on columns of customer satisfaction 1-5) => find the strengths and weaknesses
-
Step 3: give recommendation to repair and upgrade
The primary data collection method
Criteria to select techniques
Ress Pub
Scale
Medium-sized, from 50-100 people
Type of customers
Customers have the basic qualifications
Time
Research needs to do in a short time (1 week)
Budget
1 million VND
Research capabilities
Medium capacity, the number of people who designed
the research are limitations
Sample survey is the most suitable technique for Ress Pub
Strength
Weakness
High representativeness
Not precise results
Low costs
Not ideal for controversial issues
Convenient data gathering
Possible inappropriateness of questions
Good statistical significance
Little or no observer subjectivity
Inflexible design
Ress Pub should use quantitative method (Paper survey and online survey, because there are 2
easiest channels to reach customers. Online survey can collect data in very little time. With many
online survey software solutions, creating online surveys is simple and can be administered to author
population via email or social media networks within minutes. Because of this rapid distribution,
author sample population can respond almost immediately, and data is collected automatically. More
sophisticated survey software systems provide real-time analysis tools so author can track the progress
of customer survey. Paper survey in black ink offers a better resolution than customer will find on any
computer monitor making it easier for the respondent to read) to collect data because quantitative
data collection methods are much more structured than qualitative data collection methods. Customer
self-conducted surveys to get the most objective assessment. In this research, information needs to
be collect from a large number of people (100-150 people) in a short period of time (1 week) and in a
relatively cost effective way. Moreover, the results of the questionnaires in a survey can usually be
quickly and easily quantified by either a researcher or through the use of a software package (SPSS or
Microsoft Excel).
The sampling method
Sample selection:
Location: Ress Pub and fanpage of Ress Pub (there are where many clients participate in the survey)
Age: 18 to 24 years old
Sample size: 100-150
There is a survey of customer satisfaction with Ress Pub so it will be implemented at Ress Pub and on
fan page of Ress Pub. Survey sent to customers who have used the services of Ress Pub. According to
statistics from Ress Pub, 100 - 150 customers accounted for 20% of customers that they have served
(Trung, 2015). 18 to 24 years old are the main age of Ress Pub customers.
Sampling selection method
Sampling Methods can be classified into one of two categories:
Probability Sampling: Sample has a known probability of being selected
Non-probability Sampling: Sample does not have known probability of being selected as in
convenience or voluntary response surveys Đang dùng
Non-probability sampling methods offer two potential advantages - convenience and cost. The main
disadvantage is that non-probability sampling methods do not allow you to estimate the extent to
which sample statistics are likely to differ from population parameters. Only probability sampling
methods permit that kind of analysis. (onlinecourses, 2013)
Because this researcher is bounded by time, money and workforce and because of these limitations,
it is almost impossible to randomly sample the entire population and it is often necessary to employ
another sampling technique, the non-probability sampling technique.
3. (4.2)Base on your research proposal in task 2, design and
complete a customer satisfaction survey
Questionnaire design
For purpose off investigating the different level of customer satisfaction, author decided to use a
questionnaire survey to collect data. Surveys were given to customer at Ress Pub within supervisor and
combine with online survey in 1 week. After that, author summary all data on Microsoft Excel, then
analyzed by SPSS for final result. In the questionnaire survey, author must determine the data
requirements to achieve each of the result objectives. After that, author select out important items as
the most affected on customer satisfaction and eliminate redundant details. Based on measuring
customer satisfaction theories (Measuring customer satisfaction, 2013), author has decided to create
3 sections: General question, evaluate question and personal information.
Product, service variables: The design of the product or service is designed to give customers benefit.
In this survey; product, service variables are questions from 4 to 13.
Sales and promotion-related: question 4, question 14
Assessed on a scale from 1 (very dissatisfied) to 5 (very satisfied) based on the likert attitude scaling
technique was developed by Osgood, Suci and Tannerbaum in 1957. The scale consists of a number
of bipolar adjectival phrases and statements that could be used to describe the objectives being
evaluated. In this research, each bipolar adjective rating scale consists of five categories. The
respondent is asked to mark one of the five categories that best describes their views about the
object along the continuum implied by the bipolar object pair. An overall attitude score is calculated
by summing the responses on each adjective (such as very satisfied or very dissatisfied). Before
calculating score, author categories must be coded (1 is very dissatisfied, 2 is dissatisfied, 3 is normal,
4 is satisfied and 5 is very satisfied) (Likert attitude scale, 2013) The reason that author use the likert
scale because likert-type scales can be scored in a variety of ways. Author would score each item so
that higher scores always indicate "very" of some characteristic (dissatisfied and satisfied) and then
take the mean (average) of all of the items. Likert-type scales are useful in this research because it
can measure latent constructs - that is, characteristics of people such as attitudes, feelings, opinions,
etc. Latent constructs are generally thought of as unobservable individual characteristics
After- sales variables: question 15
In general question used likert scale.
All questions in evaluate question were asked about customer satisfaction and used likert scale
Personal information used multiple choices (Likert attitude scale, 2013)
In the first section, author offer general questions such as:
1. Satisfaction when come to Ress Pub
Very dissatisfied
Dissatisfied
Normal
Satisfied
Very satisfied
Direction customers in issues are assessed satisfaction. Make customer know that survey is about
customer satisfaction.
2. Satisfaction with each service of Ress Pub
Very
dissatisfied
Dissatisfied
Normal
Satisfied
Very
satisfied
Staffs
Space
Drinks
Foods
Music
Responses to customer
Promotion
Customer support
This question is clarified to the first question by giving each service of Ress Pub. Customers will assess
satisfaction on each service. Tại sao (theo theories) All of services will be clear in Section 2.
3. Level important of each service *
You choose follow score 1 to 6 (1- most important, 6- less important)
Staffs
Spaces
Menu
Music
Responses to customer
Promotion
Meaning of the 3rd question is assessing the importance of each service. When to Ress Pub, what
services are most important to customers?
In the second section, author will delve into each service, each service will have some logical
questions to help customer can answer in circuit thoughts. Moreover, author will be easy when
analyzing information. Notice, all of question in second section use the scale of satisfaction from 1 to
5 ( 1 – Very dissatisfied, 5 – Very satisfied)
There is question about Staffs of Ress Pub (Staffs mean people who get your order) with three
criteria (attitude, speed, ability) that make customer easy to image when evaluate. This question is to
assess customer satisfaction with staffs.
4. Satisfaction with Staffs of Ress Pub
Very
dissatisfied
Dissatisfied
Normal
Satisfied
Very
satisfied
Service attitude
(welcoming, friendly)
Speed for catering
The consultancy ability of
staffs
Based on measuring customer satisfaction theories and service marketing theories (createspace,
2013), Space service will have 5 key questions for customer evaluation. Customers will evaluate the
design, colors, decorated furniture, temperature, light of Ress Pub. Areas to assess are outdoor, bar,
game room, 2nd floor and 3rd floor. 5 questions below will help the researchers collect data of
customer satisfaction with the space of Ress Pub.
5. Satisfaction with decorated furniture of Ress Pub
Very
dissatisfied
Outdoor
Bar
Dissatisfied
Normal
Satisfied
Very
satisfied
Very
dissatisfied
Dissatisfied
Normal
Satisfied
Very
satisfied
Game room
2nd floor
3rd floor
6. Satisfaction with the lighting of Ress Pub
Very
dissatisfied
Dissatisfied
Normal
Satisfied
Very
satisfied
Outdoor
Bar
Game room
2nd floor
3rd floor
7. Satisfaction with temperature of Ress Pub
Very
dissatisfied
Dissatisfied
Outdoor
Bar
Game room
2nd floor
3rd floor
8. Satisfaction with design of Ress Pub
Normal
Satisfied
Very
satisfied
Very dissatisfied
Dissatisfied
Normal
Satisfied
Very satisfied
9. Satisfaction with color of Ress Pub
Very dissatisfied
Dissatisfied
Normal
Satisfied
Very satisfied
Based on measuring customer satisfaction theories, next are questions assess customer satisfaction
with 2 main items on the menu of Ress Pub are foods and drinks. Criteria for customer to assess are the
diversity, the decor, taste, and price.
10. Satisfaction with drinks of Ress Pub
Very
dissatisfied
Drinks diversity
The decoration of drinks
The taste of drinks
Price of drinks accordance
with quality of drinks
11. Satisfaction with foods of Ress Pub
Dissatisfied
Normal
Satisfied
Very
satisfied
Very
dissatisfied
Dissatisfied
Normal
Satisfied
Very
satisfied
Foods diversity
The decoration of foods
The taste of foods
Price of foods accordance
with quality of foods
Based on measuring customer satisfaction theories ,following is question to assess customer
satisfaction about music of Ress Pub. In the music service, customers will assess through 3 criteria are
sound quality, quality of DJs and music genres.
12. Satisfaction with music of Ress Pub
Very
dissatisfied
Dissatisfied
Normal
Satisfied
Very
satisfied
Sound quality
DJs quality
Music genres
Based on measuring customer satisfaction theories, the next question is to assess the level of
satisfaction of customers with transmission of information and advertising of Ress Pub. 5 criteria that
help customers easy to visualize are information on the menu, information about promotions,
communication via social networks (Facebook, Instagram), feedback via social networks (Facebook,
Instagram), and signboard. This question helps the researcher know the satisfaction of customers about
transmit information.
13. Satisfaction with the information and advertising of Ress Pub
Very
dissatisfied
Dissatisfied
Normal
Satisfied
Very
satisfied
Information on the menu
Information about
promotions
Communication via social
networks (Facebook,
Instagram)
Feedback via social
networks (Facebook,
Instagram)
Signboard
Based on measuring customer satisfaction theories, this question wants to know about the level of
customer’s satisfaction for the promotion of Ress Pub. Currently, Ress Pub is running 4 events: Lady
Night, Free BBQ, Happy hours, sell BBQ on 5, 6, 7. Customers will assess the frequency of organized
events and the level of satisfaction for each event
14. Satisfaction with the promotions of Ress Pub
Very
dissatisfied
Frequency organize Events
Lady Night Event
Free BBQ Event
Happy hours
Dissatisfied
Normal
Satisfied
Very
satisfied
Based on measuring customer satisfaction theories, below is a question to learn about customers’
satisfaction with customer support services after they used the service. The criteria for evaluation are
customer support, handle feedback, incentives for loyal customers.
15. Satisfaction with the after – sale variable of Ress Pub
Very
dissatisfied
Dissatisfied
Normal
Satisfied
Very
satisfied
Customer support
Receiving and handling of
customers’ feedback
Incentives for loyal
customers
This is a question about the location of Ress pub, Ress pub's location has created facilitate for the
movement of customers.
16. Satisfaction with location of Ress Pub
Very dissatisfied
Dissatisfied
Normal
Satisfied
Very satisfied
Last but not least, here is question to assess the level of customer’s satisfaction with the toilet of Ress
pub
17. Satisfaction with Toilet of Ress Pub
Very dissatisfied
Dissatisfied
Normal
Satisfied
Very satisfied
Above are all questions in the evaluate questions.
In the third section, the author asks for some personal information of customers, including: gender,
age, affordability for an outing, the distance from home to Ress pub, frequencies go to Ress pub per
week and purpose to go to Ress Pub. At each question, author gives some choice and customers select
one of them.
18. Gender *
o
Male
o
Female
o
LGBT
o
Below 18
o
18 - 24 years old
o
25 - 30 years old
o
Above 30 years old
19. Age *
20. Affordability for an outing*
o
Below 50.000 VND
o
50.000 - 100.000 VND
o
100.000 - 200.000 VND
o
Above 200.000 VND
21. Distance from home to Ress pub *
o
Below 2 km
o
2 - 5 km
o
Above 5 km
22. Frequencies go to Ress Pub per week
o
1-2
o
3-5
o
Above 5
23. Purpose when you come to Ress Pub *
o
Enjoy Event
o
Enjoy music
o
Enjoy drinks and foods
o
Relax
o
Meet friend
o
Other:
The last question of the survey was a question of customer’s comments; customers will write the
comments to the pub in the blanks
Conducted and collected data
After design the questionnaire survey, author will send paper survey and online survey to customer.
Paper survey will put in Ress pub. While waiting for drinks, customers will do the survey. If customers
complete survey, they will get 10% discount on the total bill. Author has printed 150 copies of the
survey. Besides, author put up survey on fanpage of Ress pub. With random sampling method, all of
customer can perform survey. After 1 week, author collected 96 responses through paper survey and
34 responses through online survey. However, there are 100 responses that valid (from 18-24 years
old). Author will analyze all the valid survey.
Analyze data and discuss the research findings
After collecting survey, data is generated into Microsoft Excel and SPSS. All quantitative data will be
used for descriptive statics analysis by calculating mod, mean, median, variance, standard deviation of
the value and be showed in a table, diagram or chart. From this table, we can have some conclusion
about frequency, the average of total customer satisfaction value, etc.
There are all of question in the above survey with detail analyze and comments of author. Author
will divide each section, each part of the service to analyze; this way will make the report have in
depth view.
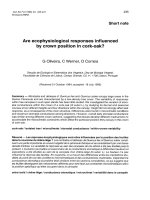
General Question
Satisfaction when come to Ress
Pub
45
50
40
30
20
10
0
35
10
Very
dissatisfied
Mean
Dissatisfied
10
Normal
Satisfied
Very satisfied
3.56
Standard
Error
0.082045
Median
4
Mode
4
In this question, Mean is 3.56 ranged between satisfied and normal, the overall score is quite good.
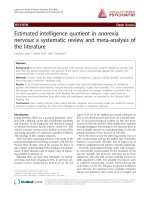
Mean of each service
5
4.65
4.5
4.22
4.3
4.22
4
3.6
3.5
3.25
3
2.5
2.1
Mean
2
1.5
1.5
1
0.5
0
Staffs
Spaces
Drinks
Foods
Music
Respones to Promotions Customer
customer
support
In figure 1.2, foods were the worst service (Mean = 1.5). Next is the issue of staffs (Mean = 2.1). In 2nd
section will have further studies and details to know the reasons why customers made that evaluate.
Besides, generally remaining services were rated quite good, especially the promotions (4.65).
`Customer satisfaction on customer support service in the middle of very satisfied and satisfied (mean
= 4.3). This is an advantage to build the relationship with customers. Drinks and music have the same
response (Mean = 4.22). However, there will be a number of detail criteria in the service were rated no
higher compared with the overall assessment of service. Evaluate question will help author clarify the
elements that customers dissatisfied to have most appropriate changes.
Evaluate Question
Staffs
Mean of Staffs
2.5
2.3
2
2
1.8
1.5
Mean of Staffs
1
0.5
0
Service attitude
Speed for catering The consultancy
ability of staffs
According that table above, the majority of responses are dissatisfied with staffs in all the above
criteria. It can be seen, most customers felt dissatisfied of the consultancy possibility of staffs (Mean
=1.8), then the service attitude (Mean= 2). This also matches with the manager of Ress pub has seen;
he has received a lot of bad feedback about staffs (Trung, 2015).
Mean average =2
Spaces
Decorated furniture
Mean of Decorated furniture
3.9
3.8
3.8
3.7
3.6
3.5
3.4
3.4
3.35
3.3
3.3
3.3
Mean of Decorated
furniture
3.2
3.1
3
Outside
Bar
Game
room
2nd floor 3rd floor
Decorated furniture in the bar is highest score (mean=3.8). 2 nd floor and 3rd floor are lowest score
(mean=3.3)
Mean average =3.43
Light
Mean of Lighting
4
3.7
3.3
3.5
3.1
3
2.5
2.2
2.1
2
Mean of Lighting
1.5
1
0.5
0
Outside
Bar
Game
room
2nd floor 3rd floor
Outside have highest score (mean=3.7) and Bar have lowest score (mean = 2.1)
Mean average =2.88
Temperature
Mean of Temperature
5
4.5
4
3.5
3
2.5
2
1.5
1
0.5
0
4.7
4.1
Outside
2
1.9
Bar
Game
room
4
Mean of Temperature
2nd floor 3rd floor
Outside have highest score (mean=4.7) and Game room have lowest score (mean = 1.9)
Mean average =3.34
Overall analyze of space service about each area in Ress pub
-
Outside: In the current time, the outdoor furniture layout is acceptable (mean=3.35). The
manager of Ress pub has designed lighting for outdoor area is quite good (mean=3.7). When to
Ress pub, customers have felt the warm glow of the yellow light bulbs in outdoor areas. This
brings to the customer comfortable feeling. Moreover, because Ress pub close to West Lake so
temperature in the outdoor area is perfect (Mean=4.7).
-
Bar: The layout furniture in the bar area is quite good (Mean=3.8). However, temperature
(mean=2) and light (mean=2.1) is rated very poorly.
-
Game room: game room has the layout (mean = 3.4) and lighting (mean =3.3) was acceptable.
However, temperature in the game room also has bad evaluation (mean=1.9).
-
2nd floor and 3rd floor: 2nd and 3rd floor have furniture layout is quite similar (mean=3.3).
Lighting of floors 2 was good (mean =3.1) but lighting of floors 3 (mean = 2.2) was rated worse
(perhaps customers feel quite dark).
Design
70
60
60
50
40
30
20
20
Design
20
10
0
0
Very
Dissatisfied
dissatisfied
Mean
Standard Error
Normal
Satisfied
Very
satisfied
4
0.070353
Median
4
Mode
4
Standard
Deviation
0.703526
Sample Variance
0.494949
The current design of Ress pub is quite good (mean =4); Ress pub should add some details to create
accents with customers. Design must be unique and interesting be able create satisfied.
Color
60
50
50
40
40
30
Color
20
10
10
0
0
Very
dissatisfied
Mean
Standard Error
Dissatisfied
Normal
Satisfied
Very satisfied
2.7
0.064354
Median
3
Mode
3
Standard
Deviation
0.643538
Sample Variance
0.414141
At present, the main colors of Ress pub are black and gray. Based on the evaluation results of customer
satisfaction, the dominant color is not made satisfaction (mean=2.7). Management should add bright
colors; bright colors can be used to draw textures to create focal points or can paint a wall with bright
colors (red or orange). Winter is coming, so the bright colors (red or orange) will brings warmth and
intimacy.
Overall mean average =3.27
Drinks