An empirical model for brand loyalty measurement
Bạn đang xem bản rút gọn của tài liệu. Xem và tải ngay bản đầy đủ của tài liệu tại đây (138.41 KB, 12 trang )
An empirical model for brand
loyalty measurement
Received (in revised form): 20th February, 2007
M. Punniyamoorthy
has been in academia for over 20 years, teaching in the areas of data analysis, marketing research production and operations management, supply
chain management, logistics management, etc. He earned his PhD at Bharathidasan University, India. He acquired a BTech in production technology
from the Madras Institute of Technology, Chennai, India, and later obtained an MTech in industrial engineering and operations research from the
Indian Institute of Technology, Kharagpur, India. He has published five papers in international journals. One of his papers, ‘A strategic decision model
for the justification of technology selection’ published in the International Journal of Advanced Manufacturing Technology, Vol. 21, pp. 72–78 was
selected by the American Society for Mechanical Engineers as one of the best 10 papers in the area of technology selection. He is presently working
as a professor in the National Institute of Technology.
M. Prasanna Mohan Raj
has experience in the newspaper industry, research and academia. He has published papers on brand architecture and brand loyalty in Indian
journals. He teaches marketing research, consumer behaviour and services marketing at the Bharathidasan Institute of Management (BIM), India.
He has presented research papers at various international and national conferences, and is also pursuing a PhD in brand loyalty measurement at the
National Institute of Technology (NIT), Trichirapalli.
Keywords brand loyalty, perceived value, customer satisfaction, commitment, brand trust,
analytical hierarchy process (AHP)
Abstract This study attempts to develop the empirical model for measuring brand loyalty in English
newspapers. The model has been developed by using factor analysis, multiple regression analysis and
the analytical hierarchy process (AHP) model. It describes the results of a survey of 180 respondents
in three dominant cities of India. The work focuses on the factors that influence loyalty. The model
has been built based on the factors found which influence loyalty. The study also examines the loyalty
behaviour of customers, especially from an Indian perspective, and measures the brand loyalty score
of three major English newspapers by using the developed model, concluding with suggestions for
mounting high loyalty among customers.
Journal of Targeting, Measurement and Analysis for Marketing (2007) 15, 222–233. doi:10.1057/palgrave.jt.5750044
INTRODUCTION
While the importance of brand loyalty has been
recognised in the marketing literature for at least
three decades, the conceptualisation and empirical
validation of a brand loyalty model for the
newspaper context has not been addressed. This
paper describes a theoretical model for
investigating the major antecedent influences on
loyalty in the newspaper context: involvement,
Correspondence: M. Punniyamoorthy, Department of Management
Studies, National Institute of Technology, Tiruchirappalli 620 015, India.
Tel: + 91 431 250 0281;
Fax : +91 431 250 0133;
E-mail:
222
perceived value, brand trust, customer satisfaction,
commitment and purchase pattern.
Newspapers have always been one of the most
important providers of news and entertainment,
even though internet and telecommunications are
the key sources of information. People have
different norms, values and beliefs. When looking
for a newspaper, people are interested in those
that correspond to their beliefs, they are looking
for a newspaper that they can identify themselves
with. Consequently, it is important for newspapers
to be able to tie customers to them, to deliver
something that satisfies the customer, to give the
customer an incentive to be loyal.
Journal of Targeting, Measurement and Analysis for Marketing Vol. 15, 4, 222–233 © 2007 Palgrave Macmillan Ltd 0967-3237 $30.00
www.palgrave-journals.com/jt
An empirical model for brand loyalty measurement
The CEO and Chairman of one of the world’s
leading media research companies, Forrester, said
that consumers are going back to reading
newspapers and the newspaper industry is ready
to respond in accordance with evolving consumer
behaviour.1 The research conducted by World
Association of Newspapers shows that the
newspaper industry has more print titles and
greater circulation than it had ten years ago,
globally. It also added that newspapers in
developing countries and emerging markets have
been particularly successful — learning from the
mistakes of their peers in developed countries and
making preemptive moves to claim their territory
online.2 The World Association of Newspapers
claims that newspaper circulations worldwide rose
slightly in 2005 while newspaper advertising
revenues showed the largest increase in four years.3
According to NRS 2006 (the largest survey of
its kind in the world), the readership of daily
newspapers continues to grow. They have added
12.6 million readers since last year and reach
203.6 million people in India.4
The Indian newspaper industry is witnessing
high growth. Earlier, newspaper owners thought
opportunities lay within their own geographical
area. But, in the coming years publishers will be
spending over Rs 1,000 crores to invade each
other’s territories. The newspaper market is bound
to grow. New brands are coming into different
territories. Newspapers have to identity the factors
making the customers loyal to their brands, to
defend their market share in this intense
competition. Although a great deal of research on
loyalty has been extensively carried out on
tangible goods, it is suggested that the existing
findings in the field of tangible product loyalty
cannot be generalised to loyalty for newspapers.
Newspapers have distinct attributes from other
consumer products. It has very little life-time
value. For example, the morning newspaper has
sellable value only from early morning to 10am
in one day. Newspapers are sold at less than their
manufactured cost, unlike other products. Profit
can be made only through advertising revenue,
which will be backed by circulation.
This study attempts to measure brand loyalty of
customers by identifying the key factors that
© 2007 Palgrave Macmillan Ltd 0967-3237 $30.00 Vol. 15, 4, 222–233
influence the customers to be loyal to their
preferred brands. This study has developed the
model for measuring brand loyalty for newspapers
by incorporating behavioural and attitudinal
attributes. The major objectives of this research
study are to find out the factors influencing brand
loyalty and to develop the model to measure
brand loyalty by incorporating the above factors.
THEORETICAL FOUNDATIONS
Brand loyalty is a term that researchers and
practitioners use to describe a number of
phenomena in marketing.5 Brand loyalty has had
a rich tradition of research in the field and the
construct is sometimes identified as having a
complex mixture of attitudinal and behavioural
elements.6 Indeed, brand loyalty might be viewed
as a special case of relationship marketing, where
the consumer has a significant psychological
attachment to the brand entity consumed.7
Researchers have started to investigate the
relational variables that lie at the heart of a
consumer–brand relationship (Chaudhuri and
Holbrook8), which lead to brand loyalty.
Evolution of the conceptualisation and
measurement of brand loyalty can be classified
into three phases. In earlier days, too much
attention had been placed on the earlier history
of brand loyalty research on operational
measurements with technique–oriented models,
emphasising well-defined mathematical models
such as Bernoulli, Markov chain or linear learning
models.9
Researchers and marketers simply defined
loyalty as a behaviour of the customer. Thus,
repeated purchase in terms of volume and value
was alone a significant measurement of customer
loyalty until the 1950s.10
This one-dimensional measurement model of
loyalty concept customer behaviours can be
criticised in that the domain of customer loyalty
has to conceptually go beyond customers’
behavioural measures. Dick and Basu11 argue that
loyalty should not be regarded as mere repurchase
behaviour. This opens the door for a large
number of variables that can be examined as the
consequences of evaluative constructs in studies of
brand loyalty.
Journal of Targeting, Measurement and Analysis for Marketing
223
Punniyamoorthy and Prasanna Mohan Raj
Customer behaviours can be induced by
situation factors such as the lack of available
alternatives, high switching cost or a tendency
towards inertia.12
In fact, nearly 75 per cent of customers’
purchasing decision is based on their attitude and
emotion.13
This implies loyalty measurement should
include customers’ attitudes rather than repeated
purchase behavioural pattern only.14 But at the
same time attitudinal measure is also insufficient
for measuring loyalty. Therefore, researchers had
measured customer loyalty by incorporating
behavioural and attitudinal measures
simultaneously.15 In this phase of loyalty
development, a liking or attitude toward the
brand developed, on the basis of cumulatively
satisfying usage occasions. The brand loyalty
exhibited is directed at the degree of liking for
the brand.
Oliver5 defines brand loyalty as ‘a deeply held
commitment to rebuy or repatronise a preferred
product/service consistently in the future, thereby
causing repetitive same-brand or same brand-set
purchasing, despite situational influences and
marketing efforts are having the potential to cause
switching behavior.’ This definition emphasises the
two different aspects of brand loyalty: behavioural
and attitudinal measures.
Jacoby and Chestnut16 provided the preferencebehaviour model for measuring brand loyalty
based on these two dimensions: behaviour and
attitude.
In the third phase, brand loyalty can be viewed
as a ‘multidimensional’ construct. Several distinct
psychological processes determine brand loyalty
and it entails multivariate measurements.
Park17 argued that attitudinal loyalty and
involvement contribute independently to the
prediction of different measures of behavioural
loyalty.
The path analytical model of relationships
between involvement, psychological commitment
and loyalty proposed that customers have to go
through sequential psychological processes to
become loyal participants including (a) the
formation of a high level of involvement in
purchase, (b) the maintenance of strong attitudes
224
toward resistance to change preferences of the
brand and (c) the development of psychological
commitment to a brand.18
Chaudhuri and Holbrook19 suggest that
behavioural, or purchase, loyalty consists of
repeated purchases of the brand, whereas
attitudinal brand loyalty includes a degree of
dispositional commitment in terms of some
unique value associated with the brand. Following
the commitment brand trust acts as a significant
factor in influencing brand loyalty.20 Brand trust
is conceptualised as ‘The confident expectations
of the brand’s reliability and intensions in
situations entailing risk to the consumer.’21 In the
consumer-brand domain, this idea implies that the
brand is an active relational partner. One way to
legitimise the brand as an active member of the
relationship rather than a passive object is to
highlight ways in which brands are personalised
and animated.7 It is widely known that perceived
value, the potential key determinant of loyalty, is
composed of a ‘get’ component — that is, the
benefits a buyer derives from a seller’s offering —
and a ‘give’ component — that is, the buyer’s
monetary and nonmonetary costs of acquiring the
offering.22 Customer satisfaction is the major
factor that influences the loyalty behaviour. An
increase in the amount of satisfaction goes along
with an increase in loyalty.23
It has been suggested that loyalty includes some
degree of pre-dispositional commitment toward a
brand. Commitment is considered as a necessary
condition for brand loyalty.
MEASURES OF BRAND LOYALTY
OF NEWSPAPERS
Based on theoretical foundations, this study
preliminary identifies the following measures for
brand loyalty.
Involvement
Several studies 16,17,24–26 have examined the
relationship between product involvement and
loyalty. LeClerc and Little (1997) found that
brand loyalty interacted with product involvement.
In a similar vein, Park,17 in a study on leisure
activities, found that involvement and attitudinal
loyalty were highly correlated. Product
Journal of Targeting, Measurement and Analysis for Marketing Vol. 15, 4, 222–233 © 2007 Palgrave Macmillan Ltd 0967-3237 $30.00
An empirical model for brand loyalty measurement
involvement involves an ongoing commitment on
the part of the consumer with regard to thoughts,
feelings and behavioural response to a product
category.27,28 Involvement is an unobservable state
of motivation, arousal or interest toward a
product. Park’s17 and Kim et al.’s29 research
provided additional evidence that involvement is
closely related to intentions and behaviours,
corroborating evidence from numerous studies.
H1: Higher level of involvement will lead to
higher level of brand loyalty.
Perceived value
The perceived value can be regarded as a
‘Consumer’s overall assessment of the utility of a
product based on perceptions of what is received
and what is given’. The assessment denotes
comparison of a product’s ‘get’ and ‘give’
components.30,31 Several prior research studies
strongly validated the theme that perceived value
contributes to customer loyalty (eg Dodds,22
Voss,31 Parasuraman and Grewal32). Reichheld33
strongly suggested that there is a strong value–
loyalty linkage in his work on loyalty.
H2: Higher level of perceived value will lead
to higher level of brand loyalty.
The following four dimensions can be used to
describe the Consumer Perceived Value:
Functional value
The utility derived from the product quality and
expected performance of the product is called as
functional value. Functional value was seen to be
the key influence on consumer choice. Functional
value was created by attributes such as reliability,
durability.
H2a: Higher level of functional value will lead
to higher level of brand loyalty.
Emotional value
The utility derived from the feelings or affective
states that a product generates is called emotional
value. Emotions play a part in every purchase
decision.
© 2007 Palgrave Macmillan Ltd 0967-3237 $30.00 Vol. 15, 4, 222–233
H2b: Higher level of emotional value will lead
to higher level of brand loyalty.
Price-worthiness factor
The utility derived from the product due to the
reduction of its perceived costs.
H2c: Higher level of price worthiness will
lead to higher level of brand loyalty.
Social value
The utility derived from the product’s ability to
enhance social self-concept.
H2d: Higher level of social value will lead to
higher level of brand loyalty.
Brand trust
The relationship between loyalty and brand trust
has been explained by Garbarino and Johnson34
(amongst other authors) in their work. They
highlighted the importance of trust in developing
positive and favourable attitudes. Brand trust is
the central construct for any long-term
relationship. So, in the consumer-brand domain it
may be an important contributor to the kind of
emotional commitment that leads to long-term
loyalty.35 So it seems reasonable to expect that the
higher the feeling of trust in a brand, the more
the consumers are loyal to it.
H3: Higher level of brand trust will lead to
higher level of brand loyalty.
Customer satisfaction
Customer satisfaction is believed to mediate
consumer learning from prior experience and to
explain key post-purchase behaviours such as
complaining, word of mouth, and repurchase
intention and product usage.36 Indeed Wang et al.37
have suggested that customer satisfaction has a
significant influence on repurchase intention and
post purchase complaint.
H4: Higher level of customer satisfaction will
lead to higher level of brand loyalty.
Journal of Targeting, Measurement and Analysis for Marketing
225
Punniyamoorthy and Prasanna Mohan Raj
Commitment
Customer commitment is a central construct in
the development and maintenance of marketing
relationships because it is a key psychological
force that links the consumer to the selling
organisation.38 The nature of commitment is that
it is an attitudinal construct in that it represents
customer feelings about the act of maintaining a
relationship with a commercial partner
(Fullerton).39 Commitment likely explains the
process by which it is presumed that a customer
is loyal because he/she has a favourable attitude
toward the brand and is also a frequent buyer of
that brand. This process is a feature of brand
communities in which consumers share
identification with a brand they consume as
individuals and as part of the community.40
Intuitively, affective commitment would lie at the
heart of a consumer–brand relationship because
consumers come to be identified with and be
involved with many of the brands they regularly
consume.7,41
H5: Higher level of commitment will lead
to higher level of brand loyalty.
BRAND LOYALTY MEASUREMENT
MODEL
It has been suggested that loyalty is a
multidimensional construct. The brand loyalty in
this study includes multidimensional constructs
including both attitudinal commitment and
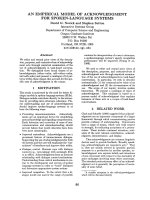
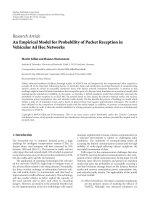
behavioural purchase loyalty. We propose that
involvement, perceived value, trust, customer
satisfaction and commitment influence loyalty. The
proposed model of brand loyalty for buying
English newspaper consists of nine constructs. The
constructs and their proposed relations are
presented in Figure 1.
Based on the above measures, the regression
model can be developed by assuming linear
relationship among theses variables.
Yi = b0 + b1xi1 + b2xi2 + ត + bmxim + ei
where b1,b2 … bm are partial regression coefficients.
x1,x2 … xm are the variables influencing loyalty.
The above regression model denotes the
relationship between attributes and loyalty. The
relative contribution or influence of each attribute
on brand loyalty is measured by
Relative weightage for attribute Aj = bj/ bj,
Involvement
Repeated purchase behaviour
The consistent repeat purchase is one kind of
‘Loyalty-Prone’ behaviour,42 which forms the base
for brand loyalty. Repeated purchase behaviour is
an axiomatic term that simply refers to the extent
to which consumers re-purchase the same brand
in any equal-length period of time.43 The
strength of behavioural brand loyalty is, therefore,
directly a function of the repetitive occurrence of
purchase or consumption behaviour. The
consumer establishes a systematic biased response
or habit simply due to the frequency of
encounters. Once the behavioural brand loyalty is
strongly manifested by the consumer, it is very
difficult to change the systematic bias away from
the brand.
Functional
value
Price
worthiness
Brand
Loyalty
Emotional
value
Social value
Brand trust
Satisfaction
Commitment
Repeat
purchase
H6: Repeated purchase pattern will lead to
higher level of brand loyalty.
226
Figure 1: The proposed model for measuring brand loyalty
Journal of Targeting, Measurement and Analysis for Marketing Vol. 15, 4, 222–233 © 2007 Palgrave Macmillan Ltd 0967-3237 $30.00
An empirical model for brand loyalty measurement
comparison between i&j. If the (i, j) cell is a
strong cell, then (j, i) becomes a weak cell and it
takes the reciprocal value of the (i, j) cell. This
matrix is a general matrix for the attribute j and
the relative weightage of each brand is arrived at
by the AHP.
It denotes the score obtained by brand ‘i’ in
the attribute of ‘j’. Thus the relative weightage of
attribute and the relative weightage of brand with
respect to attribute are arrived at by using
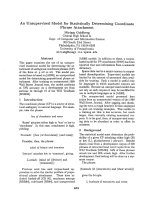
regression and the AHP model. The final model
of measuring loyalty will be developed by using
the above findings as shown in Figure 2.
Here Bij is the relative weightage of brand ‘i’
with respect to attribute ‘j’.
The brand loyalty index for a brand i,
where bj is the partial regression coefficient of the
‘j’th attribute and bj is the sum of all the partial
regression coefficients of the attributes.
The regression equation can be used to
develop the model for measuring brand loyalty
along with the Analytical hierarchy process (AHP)
model.44 The AHP model is used to find out the
relative weightage of brands. The AHP is a
mathematical decision-making technique that
allows consideration of both qualitative and
quantitative aspects of decisions. It reduces
complex decisions to a series of one-on-one
comparisons, and then synthesises the results. The
relative weightage of brand on each attribute will
be calculated by using pairwise comparison
matrix of brands with respect to attributes
identified for loyalty measurement.
Pairwise comparison matrix for attribute ‘j’ for
‘n’ number of brands.
B1
B2
B3
.
.
BJ
B1
B2
B3
Bi
.
.
BM
.
.
M
L i = Σ A j B ij
J=1
Bij = relative weightage for brand i with respect
to the Jth attribute; Aj = relative weightage for the
attribute J.
BM
B1j
aij
Bij
RESULTS AND DISCUSSION
Bmj
Measurement assessment
To ensure the content validity of the scales, the
items selected must represent the concept about
which generalisations are to be made. Therefore,
items selected for the constructs were mainly
Bij is the relative weightage of brand ‘i’ with
respect to attribute ‘j’; aij is the value that varies
between 1 and 9, when we carry out pairwise
BRAND LOYALTY
SCORE
Attributes
A1
Aj
Am
Brands
B1
Bi
Bn
B1
Bi
Bn
B1
Bi
Bn
B11
Bi1
Bn1
B1j
Bij
Bnj
B1m
Bim
Bnm
Figure 2: Model for measuring loyalty
© 2007 Palgrave Macmillan Ltd 0967-3237 $30.00 Vol. 15, 4, 222–233
Journal of Targeting, Measurement and Analysis for Marketing
227
Punniyamoorthy and Prasanna Mohan Raj
adapted from prior studies to ensure content
validity. Construct validity determines the extent
to which a scale measures a variable of interest. In
this study, Straub’s45 processes of validating
instruments in MIS research in terms of
convergent validity and discriminant validity are
followed. Thus, a principal components factor
analysis with varimax rotation was conducted to
investigate the distinctions among customer
satisfaction, trust, perceived value, commitment,
satisfaction, involvement and loyalty (Table 1).
Perceived value was measured by the ‘PERVAL’
Consumer Perceived scale developed by Sweeney
and Soutar.46
Four items for measuring brand trust construct
were adapted from Delgado.47 The item to
measure customer satisfaction was taken from
previous measures of the overall level of user
satisfaction. Commitment was measured by four
items adapted from the Pritchard et al.48
Table 1:
‘resistance to change’ scales. Table 2 lists the items
used in this study.
The methodology was based on the
development of a self-administered questionnaire
using a convenience sampling. In total, 180
completed surveys were received and all the
respondents had responded. Data were collected
from the Indian cities of Chennai, Bangalore and
Trichy. The data were factor analysed using principal
components analysis with varimax rotation.
The nine factors emerged with no crossconstruct loadings above 0.5, indicating good
discriminant validity. The instrument also
demonstrated convergent validity with factor
loadings exceeding 0.5 for each construct.
Consequently, these results confirm that each of
the five constructs is unidimensional and
factorially distinct and that all items used to
operationalise a particular construct is loaded onto
a single factor.
Factor analysis results: Principal component extraction
Scale
items
Functional
value
F1
F2
F3
F4
F5
F6
F7
F8
F9
PR1
PR2
PR3
EM1
EM2
EM3
SO1
SO2
SO3
T1
T2
T3
T4
SA1
CO1
CO2
CO3
CO4
PUR1
PUR2
PUR3
PUR4
0.954
0.757
0.971
0.608
0.912
0.781
0.842
0.922
0.712
Price
worthiness
Emotional
value
Social
value
Brand
trust
Satisfaction
Commitment
Repeated
purchase
0.940
0.873
0.794
0.800
0.630
0.792
0.791
0.773
769
0.943
0.578
0.853
0.943
0.561
0.515
0.834
0.807
0.790
0.781
0.914
0.902
0.940
Note: Only loadings greater than 0.500 are shown.
228
Journal of Targeting, Measurement and Analysis for Marketing Vol. 15, 4, 222–233 © 2007 Palgrave Macmillan Ltd 0967-3237 $30.00
An empirical model for brand loyalty measurement
Table 2: Scale for measuring loyalty
F1
F2
F3
F4
F5
F6
F7
F8
F9
PR1
PR2
PR3
EM1
EM2
EM3
SO1
SO2
SO3
T1
T2
T3
T4
SA1
CO1
CO2
CO3
CO4
PUR1
PUR2
PUR3
PUR4
This newspaper is a highly reliable and credible source
It sticks to its rich heritage of consistent quality of news
It has an acceptable standard of print quality make reading easy
I like the design and layout of this newspaper
Variety of supplements coming from this newspaper are very interesting
This newspaper gives me detailed coverage of news
Variety of advertisements coming from this newspaper are very informative
Job opportunity advertisements coming from this newspaper are useful
This newspaper comes with rich and bold editorial and columns
This newspaper offers value for money
It is reasonably priced
It is economical
It makes me feel good
It gives me pleasure
Wherever I see this newspaper, I would read it
I will consider my newspaper as a status symbol
I feel proud of being the reader of this newspaper
Reading of this newspaper will improve the way I am perceived
I can say, my newspaper is honest and sincere
I rely on my newspaper
My newspaper never disappoints me
I believe my newspaper meets my expectations
Overall, in buying this newspaper, I believe that I would be pleased with it
I have strong preference for this newspaper
My preference for this newspaper would not willingly change
To change my preference from this newspaper would require major rethinking
Even if close friends recommend another newspaper, I would not change my preference
I have been buying this newspaper since I started the habit of reading English newspapers
I consider myself to be loyal to this newspaper
I will recommend this newspaper as worth reading and buying to friends/relatives
If I don’t get my newspaper in my doorstep, I will search and buy it in stalls
Reliability was evaluated by assessing the
internal consistency of the items representing
each construct using Cronbach’s alpha. The
reliability of each construct was as follows:
Functional Value = 0.93; price worthiness = 0.92.
Emotional value = 0.88; social value = 0.95;
customer satisfaction = 0.70; brand trust = 0.88;
commitment = 0.84; repeated Purchase = 0.96,
involvement = 0.87.
Hypothesis testing
The hypothesised relationships were tested using
the multiple regression analysis of SPSS 11.5 for
Windows. The average scores of the items
representing each construct were used in the data
analysis. The R2 was used to assess the model’s
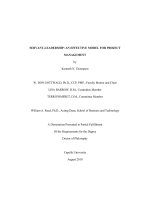
overall predictive fit. Properties of the causal
paths, including standardised path coefficients, tvalues and variance, explained for each equation
in the hypothesised model are presented in Figure 3.
The influence of perceived value (functional
value, price worthiness, emotional value and social
value), trust, customer satisfaction and repeated
© 2007 Palgrave Macmillan Ltd 0967-3237 $30.00 Vol. 15, 4, 222–233
purchase commitment on loyalty has been proved
by hypotheses H1, H2a, H2b, H2c, H2d, H3, H4, H5
and H6.
As expected, repeated purchase (b = 0.769,
t-value = 7.159, p < 0.001) and functional value
(b = 0.138, t-value = 6.312, p < 0.001) have
relatively strongest influence on loyalty, followed
by commitment (b = 0.127, t-value = 1.484,
p = 0.148) and emotional value (b = 0.108,
t-value = 1.800, p = 0.082). Brand trust (b = 0.095,
t-value = 2.150, p < 0.05), price worthiness
(b = 0.046, t-value = 0.778, p = 0.443) ,customer
satisfaction (b = 0.034, t value = 1.523, p = 0.138)
and social value (b = 0.026, t-value = 1.207,
p = 0.237) have a significant positive effect on
loyalty. Customers’ involvement (b = 0.057,
t-value = 2.622, p < 0.05) also has a significant
influence on loyalty.
Therefore, hypotheses H1, H2a, H2b, H2c, H2d,
H3, H4, H5 and H6 are supported. So the
proposed model explained a significant percentage
of variance in loyalty (R2 = 98.6 per cent, F
value = 236.175, p < 0.001).
Journal of Targeting, Measurement and Analysis for Marketing
229
Punniyamoorthy and Prasanna Mohan Raj
BRAND LOYALTY
SCORE
A1
A2
A3
A4
A5
A6
A7
A8
A9
0.098
0.033
0.077
0.018
0.068
0.024
0.091
0.550
0.041
B11
B12
B13
B14
B15
B16
B17
B18
B19
0.73
0.05
0.08
0.74
0.76
0.76
0.74
0.74
0.33
Figure 3: Hypothesis testing results
MANAGERIAL IMPLICATIONS
This study investigated the direct effects of
involvement, perceived value (integration of
functional value, price worthiness, emotional value
and social value), brand trust, satisfaction,
commitment and repeated purchase on loyalty.
Integrating these perspectives and empirically
examining the factors that build brand loyalty in
newspapers advanced our understanding of these
constructs. The result suggests that repeated
purchase has the strongest influence on loyalty
followed by functional value. As suggested by this
proposed model, commitment plays a crucial role
in building brand loyalty followed by emotional
value and brand trust. Interestingly, the priceworthiness factor has less influence on brand
loyalty than above–mentioned factors. Therefore,
management attention might more fruitfully focus
on the development of internal psychological
processes such as commitment, emotional value.
Building strong perceived value in the minds of
customer is forming the foundation for brand
loyalty. Brands should develop trust among the
customers.
As per the proposed model, nine variables are
found to have an influencing power on loyalty.
So the brand loyalty index
9
Li =
Σ
J=1
230
Aj B 1j
The above equation can be written as follows:
L1 = A1B11 + A2B12 + A3B13 + A4B14 + A5B15
+ A6B16 + A7B17 + A8B18 + A9B19
B19 is the relative weightage for brand 1 with
respect to the 9th attribute; A9 is the relative
weightage for attribute 9.
Calculation of attribute’s relative
weightage (Aj)
The regression equation comprises nine attributes,
Yi = b0 + b1x1 + b2 x2 + b3 x3 + b3 x3 + b4 x4
+ b5 x5 + b6 x6 + b7 x7 + b8 x8 + b9x9
where b1,b2 … b9 are partial regression
coefficients.
X1 is the functional value; X2 is the price
worthiness; X3 is the emotional value; X4 is the
social value; X5 is the brand trust; X6 is the
satisfaction; X7 is the commitment; X8 is the
repeated purchase; X9 is the involvement.
Yi = b0 + b1 0.138 + b2 0.046 + b3 0.108
+ b4 0.026 + b5 0.095 + b6 0.034 + b7 0.127
+ b8 0.769 + + b9 0.057
The relative weightage of functional
value = 0.138/1.4 = 0.098.
Similarly, relative weightage scores for all
attributes are found and the brand loyalty index
for any brand can be calculated by substituting
the relative scores of the nine attributes in the
Journal of Targeting, Measurement and Analysis for Marketing Vol. 15, 4, 222–233 © 2007 Palgrave Macmillan Ltd 0967-3237 $30.00
An empirical model for brand loyalty measurement
Involvement
b = 0.057
b = 0.138
b = 0.046
Brand
Loyalty
Functional
value
Price
worthiness
b = 0.108
Emotional
value
b = 0.026
Social value
b = 0.095
Brand trust
b = 0.034
Satisfaction
Figure 4 illustrates the above measurement of
brand loyalty index for a brand The Hindu.
Similarly, loyalty index can be calculated for all
other brands.
Deccan Chronicle brand
0.098 (0.2) + 0.033 (0.73) + 0.077
+ 0.018 (0.19) + 0.068
+ 0.024 (0.18) + 0.091
+ 0.550 (0.21) + 0.041
= 0.2985 = 29.85%
(0.71)
(0.05)
(0.21)
(0.33)
Deccan Chronicle is placed in the second
position by scoring 29.85 per cent brand loyalty.
b = 0.127
The New Indian Express brand
b = 0.769
Commitment
Repeat
purchase
Figure 4: Measurement of brand loyalty index for a brand
‘The Hindu’
following equation:
Loyalty Index = 0.098 B11 + 0.033 B12
+ 0.077 B13 + 0.018 B14
+ 0.068 +B15 + 0.024 B16 + 0.091B17
+ 0.550 B18 + 0.041 B19
The final brand loyalty scores will be calculated
by substituting their relative weightage in the
above equation. The relative weightage of a brand
with respect to the attributes are calculated by
using the AHP model. Three Indian English
newspaper brands are taken for study and their
loyalty is measured by using the above loyalty
index. The brand loyalty score of the brand ‘The
Hindu’ is calculated by substituting their scores on
the nine attributes in the above equation
The Hindu brand
Loyalty = 0.098 (0.73) + 0.033 (0.05) + 0.077(0.08)
+ 0.018(0.74) + 0.068 (0.76) + 0.024 (0.76)
+ 0.091 (0.74) + 0.550 (0.74)
+ 0.041 (0.33) = 0.6501
The Hindu enjoys 65.01 per cent brand loyalty.
Similarly, brand loyalty score is calculated for other two
brands The New Indian Express and Deccan Chronicle.
© 2007 Palgrave Macmillan Ltd 0967-3237 $30.00 Vol. 15, 4, 222–233
0.098 (0.06) + 0.033 (0.21) + 0.077 (0.21)
+ 0.018 (0.07) + 0.068 (0.19)
+ 0.024 (0.06) + 0.091 (0.05)
+ 0.550 (0.05) + 0.041 (0.33)
= 0.1309 = 13.09%
The New Indian Express is placed in the third
position by scoring 13.09 per cent brand loyalty.
In the above examples, ‘The Hindu’ brand has
the highest brand loyalty score as it scored high
on the attributes that have high influences on
loyalty. For example, The Hindu brand scored high
on the attributes of repeated purchase behaviour
(0.74) and functional value (0.73), which makes
The Hindu brand have high brand loyalty.
In contrast, though Deccan Chronicle brand
scored high in the price-worthiness factor (0.73),
it has created less impact on loyalty as the priceworthiness factor has little impact on loyalty
(0.033).
Both Deccan Chronicle and The New Indian
Express brands should score high on the attribute
of repeated purchase behaviour. They could
increase the repeated purchase by implementing
customer franchise sales promotion programmes.
Both brands can devise a special loyalty
programme for annual subscribers linked with
benefits of offering free insurance scheme along
with the subscription. The Hindu scores less in
emotional value (0.08) when compared to other
brands, sending alarm signals to the management.
So, if The Hindu brand wants to be a market
Journal of Targeting, Measurement and Analysis for Marketing
231
Punniyamoorthy and Prasanna Mohan Raj
leader, it should develop emotional bondage with
customers to retain its market position.
CONCLUSION
Developing and sustaining the brand loyalty is the
biggest challenge in the relentless competition
market. Brand loyalty is a multidimensional
construct. After having strong theoretical
foundation this study has developed model for
measuring brand loyalty including
multidimensional constructs both attitudinal
commitment and behavioural purchase loyalty.
The model proposed that involvement, perceived
value, trust, customer satisfaction and commitment
are having influencing power on the loyalty.
Relative weightage of the above attributes were
mainly given importance in determining the
loyalty score.
References
1 />congress/balding.html.
2 />Concepts_light.pdf.
3 />4 />htm.
5 Oliver, R. L. (1999) ‘Whence consumer loyalty’, Journal of
Marketing, Vol. 63, pp. 33–44.
6 Jacoby, J. and Kyner, D. B. (1973) ‘Brand loyalty vs repeat
purchasing behaviour’, Journal of Marketing Research, Vol. 10,
No. 1, pp. 1–9.
7 Fournier, S. (1998) ‘Consumers and their brands: Developing
relationship theory in consumer research’, Journal of Consumer
Research March, Vol. 24, pp. 343–373.
8 Chaudhuri, A. and Holbrook, M. (2002) ‘Product class effects on
brand commitment and brand outcomes: The role of brand trust
and brand affect’, Journal of Brand Management, Vol. 10, No. 1,
pp. 33–58.
9 Jagdish, N., Sheth, C. and Whan, P. (1974) ‘A theory of
multidimensional brand loyalty’, Advances in Consumer Research,
Vol. 1, pp. 449–459.
10 Lu Ting Pong, J. and Tang Pui Yee, E. (2001) ‘An integrated
model of service loyalty’, Academy of Business & Administrative
Sciences 2001 International Conferences, Brussels, Belgium held
on 23rd–25th July, 2001.
11 Dick, A. S. and Basu, K. (1994) ‘Customer loyalty: Toward an
integrated conceptual framework’, Journal of Academy of Marketing
Science, Vol. 22, No. 2, pp. 99–113.
12 Cooper, W. H. and Withey, M. J. (1989) ‘Predicting exit, voice
loyalty, and neglect’, Administrative Science Quarterly, Vol. 34,
pp. 12–14.
13 Gremler, D. D. and Brown, S. W. (1996) ‘Service loyalty: Its nature,
importance and implications’, Advancing Service Quality — A
Global Perspective, International Service Quality Association Inc.,
pp. 171–175.
232
14 Andreassen, T. W. and Lindestad, B. (1998) ‘Customer loyalty and
complex services’, International Journal of Service Industry
Management, Vol. 9, No. 1, pp. 7–23.
15 Hallowell, R. (1996) ‘The relationships of customer satisfaction,
customer loyalty, and profitability: An empirical study’,
International Journal of Service Industry Management, Vol. 7, No. 4,
pp. 27–42.
16 Jacoby, J. and Chestnut, R. W (1978) ‘Brand Loyalty
Measurement and Management’, Wiley, New York, pp. 45–57.
17 Park, S. H. (1996) ‘Relationships between involvement and
attitudinal loyalty constructs in adult fitness programs’, Journal of
Leisure Research, Vol. 28, No. 4, pp. 233–250.
18 Iwasaki, Y. and Havitz, M. (1998) ‘A path analytical model
of the relationships between involvement, psychological
commitment and loyalty’, Journal of Leisure Research, Vol. 30,
pp. 256–280.
19 Chaudhuri, A. and Holbrook, M. B. (2001) ‘The chain of
effects from brand trust and brand affect to brand performance:
The role of brand loyalty’, Journal of Marketing, Vol. 65, No. 2,
pp. 81–93.
20 Ramesh, K. S. and Advani, J. Y. (2005) ‘Factors affecting brand
loyalty: A study in an emerging market in fast moving
consumer goods’, Journal of Customer Behaviour, Vol. 4, No. 2,
pp. 251–275.
21 Andaleeb, S. S. (1992) ‘The trust concept: Research issues for
channels of distribution’, Research in Marketing, Vol. 11, pp. 1–34.
22 Dodds, W. B., Monroe, K. B. and Grewal, D. (1991) ‘Effects
of price, brand, and store information on buyers’ product
evaluations’, Journal of Marketing Research, Vol. 28, No. 3,
pp. 307–319.
23 Bloemer, J. M. M. and Kasper, H. D. P. (1995) ‘The complex
relationship between consumer satisfaction and brand loyalty’,
Journal of Economic Psychology, Vol. 16, pp. 311–329.
24 Traylor, M. B. (1981) ‘Product involvement and brand
commitment: not necessarily the same’, Journal of Advertising
Research, Vol. 21, pp. 51–56.
25 Traylor, M. B. (1983) ‘Ego involvement and brand commitment:
not necessarily the same’, Journal of Consumer Marketing, Vol. 1,
pp. 75–79.
26 Leclerc, F. and John D.C, . Little (1997) ‘Can advertising copy
make FSI coupons more effective?’ Journal of marketing Research,
Vol. 34, No. 4, pp. 473–484.
27 Miller, D. W. and Marks, L. J. (1996) ‘The moderating effects of
enduring involvement on imagery-evoking advertisements’,
American Marketing Association, pp. 121–128.
28 Gordon, M. E., McKeage, K. and Fox, M. A. (1998)
‘Relationship marketing effectiveness: the role of involvement’,
Psychology and Marketing, Vol. 15, No. 5, pp. 443–459.
29 Kim, S. S., Scott, D. and Crompton, J. L. (1997) ‘An exploration
of the relationships among social psychological involvement,
behavioral involvement, commitment and future intentions in
the context of bird watching’, Journal of Leisure Research, Vol. 23,
pp. 320–341.
30 Zeithaml, V. A. (1988) ‘Consumer perceptions of price, quality
and value: A means-end model and synthesis of evidence’,
Journal of Marketing, Vol. 52(July), pp. 2–22.
31 Voss, G. B., Parasuraman, A. and Grewal, D. (1998) ‘The roles of
price, performance and expectations in determining satisfaction
in service exchanges’, Journal of Marketing, Vol. 62, No. 4,
pp. 46–61.
32 Parasuraman, A. and Grewal, D. (2000) ‘The impact of
technology on the quality-value-loyalty chain: A research
Journal of Targeting, Measurement and Analysis for Marketing Vol. 15, 4, 222–233 © 2007 Palgrave Macmillan Ltd 0967-3237 $30.00
An empirical model for brand loyalty measurement
33
34
35
36
37
38
39
agenda’, Journal of the Academy of Marketing Science, Vol. 28,
No. 1, pp. 168–174.
Reichheld, F. F. (1996) ‘Learning from customer defections’,
Harvard Business Review, Vol. 74, No. 2, pp. 56–67.
Garbarino, E. and Johnson, M. S. (1999) ‘The different roles of
satisfaction,trust and commitment in customer relationships’,
Journal of Marketing, Vol. 63(April), pp. 70–87.
Hess, J. S. (1995) ‘Construction and assessment of a scale to
measure consumer trust’, in Stern B., Zinkhan, G. (eds),
‘Proceedings of the American Marketing Association Educators’
Conference’, Vol. 6, American Marketing Association, Chicago,
pp. 20–26.
Westbrook, R. A. and Oliver, R. P. (1991) ‘The dimensionality of
consumption emotion patterns and consumer satisfaction’,
Journal of consumer Research, Vol. 18, No. 1, pp. 84–91.
Wang, S., Tang, T. -I. and Tang, J. T. E. (2001) ‘An instrument for
measuring customer satisfaction toward web sites that market
digital products and services’, Journal of Electronic Commerce
Research, Vol. 2, No. 3, pp. 89–102.
Bansal, H., Irving, G. and Taylor, S. (2004) ‘A three-component
model of customer commitment to service providers’,
Journal of the Academy of Marketing Science, Vol. 32, No. 3,
pp. 234–250.
Gordon, F. (2003) ‘When does commitment lead to loyalty?’
Journal of Service Research, Vol. 5, No. 4, pp. 333–344.
© 2007 Palgrave Macmillan Ltd 0967-3237 $30.00 Vol. 15, 4, 222–233
40 McAlexander, J. H., Schouten, J. W. and Koenig, H. F. (2002)
‘Building brand community’, Journal of Marketing, Vol. 66, No. 1,
pp. 38–51.
41 Susan, F. (1998) ‘Consumers and their brands: Developing
relationship theory in consumer research’, Journal of Consumer
Research, Vol. 24, pp. 343–348.
42 Cunningham, R. M. (1956) ‘Brand loyalty — What,
pp. 116–138.
43 Ehrenberg, A. S. C. (1988) ‘Repeat-Buying Facts, Theory and
Applications’, Charles Griffin, London, pp. 24–34.
44 Saaty, T. L. (1994) ‘Theory and methodology: Highlights and
critical points in the theory and application of AHP’, European
Journal of Operational Research, Vol. 74, pp. 426–447.
45 Straub, D. W. (1989) ‘Validating instruments in MIS research’,
MIS Quarterly, Vol. 13, No. 2, pp. 147–169.
46 Sweeney, J. C. and Soutar, G. N. (2001) ‘Consumer perceived
value: The development of multiple item scale’, Journal of
Retailing, Vol. 77, No. 2, pp. 203–220.
47 Delgado, B. E. (2003) ‘Development and validation of a brand
trust scale’, International Journal of Market Research, Vol. 45, No. 1,
pp. 35–54.
48 Pritchard, M. P., Havitz, M. E. and Howard, D. R. (1999
‘Analyzing the commitment–loyalty link in service contexts’,
Journal of the Academy of Marketing Science, Vol. 27, No. 3,
pp. 333–348.
Journal of Targeting, Measurement and Analysis for Marketing
233