Báo cáo Y học: An alternative model for photosystem II/light harvesting complex II in grana membranes based on cryo-electron microscopy studies pptx
Bạn đang xem bản rút gọn của tài liệu. Xem và tải ngay bản đầy đủ của tài liệu tại đây (674.33 KB, 11 trang )
An alternative model for photosystem II/light harvesting complex II
in grana membranes based on cryo-electron microscopy studies
Robert C. Ford
1
, Svetla S. Stoylova
2
and Andreas Holzenburg
3
1
Department of Biomolecular Sciences, UMIST, Manchester, UK;
2
The Burnham Institute, La Joua, CA, USA;
3
Department of Biology and Department of Biochemistry and Biophysics, Microscopy and Imaging Center,
Texas A & M University, College Station, TX, USA
The photosynthetic protein complexes in plants are located
in the chloroplast thylakoid membranes. These membranes
have an ultrastructure that consists of tightly s tacked ÔgranaÕ
regions interconnected by unstacked membrane regions. The
structure of isolated grana membranes has been studied here
by cryo-electron microscopy. The data reveals an unusual
arrangement of the photosynthetic protein complexes,
staggered over two tightly stacked planes. Chaotrope treat-
ment of the paired grana membranes has allowed the sepa-
ration and isolation of two biochemically distinct membrane
fractions. These data have led us to an alternative model of
the u ltrastructure o f the gran a where segregation exists
within the grana itself. This a rrangement would change t he
existing view of plant photosynthesis, and suggests potential
links between c yanobacterial and plant photosystem II light
harvesting systems.
Keywords: photosynthesis, structure, photosystem II, light-
harvesting, electron crystallography.
Photosynthesis, one o f the most important biochemical
processes, occurs in the thylakoid membranes of plants
that are located inside specialized cell compartments
(chloroplasts). The thylakoid membrane system is highly
organized, with characteristic stacks of membranes that are
termed grana, which a re interconnected by unstacked
regions of membrane (see Fig. 1A). In the classical view of
plant photosynthesis, one part of the photosynthetic
electron transfer chain (photosystem II) is segregated into
the grana, whilst other components of the system (photo-
system I an d the H
+
-ATPase) are located in the unstacked
thylakoid membranes [1±3]. The location o f t he fourth
component of the photosynthetic system, the cytochrome
b
6
/f complex, is not clear, and indeed it may exist in both
areas of the membrane. Light is trapped by chlorophyll
and carotenoid (pigments) bound in side thylakoid mem-
brane proteins. For photosystem II (PSII) in plants, light
energy is mainly trapped by the light harvesting complex II
(LHCII), which consists of several related proteins of mass
25 kDa [4]. One of the proteins, LHCIIb, is present in
high stoichiometry (8±12 molecules per PSII complex),
with the stoichiometry being in¯uenced by the illumination
conditions at any given time [4±6]. LHCII must transfer
light energy to the core light harvesting proteins of PSII,
which in turn, pass it to the r eaction centre chlorophylls of
PSII. The l atter c onvert t he light energy into chemical
potential energy via e lectron transfer [7]. This chemical
potential is eventually used to carry out the universally
recognized functions of photosyn thesis, i.e. to ®x atmo-
spheric carbon dioxide for biomass, liberate oxygen from
water, and in general drive the energy requiring processes
in the plant.
The complete PSII/LHCII complex is thought to consist
of more than 20 different polypeptides and several hundred
(250±350) pigment molecules [8,9]. The total mass of PSII/
LHCII has been estimated at around 1 MDa. With such
complexity, it is understandable t hat knowledge o f the
structure of PSII/LHCII proteins has largely come from
studies of isolated components of the system [10] o r
subcomplexes that have been removed from the membrane
by detergent extraction [11,12]. However two-dimensional
crystalline arrays of PSII/LHCII have sometimes been
observed to form in situ in the grana membranes, and these
can be studied using electron crystallography techniques
[13±21]. Such native c rystals are inevitably smaller than
crystals of isolated proteins [10] or puri®ed complexes of
proteins [11]. However it has been shown using experimental
data [22] and by simulations [23] that averaging of cryo-
electron microscopy data for several small crystalline areas
is practical and results in structural data equivalent i n
quality to that obtained from much larger single crystalline
arrays.
In this article, we describe cryo-electron microscopy
studies of grana membranes, and show a projection
structure for PSII/LHCII to 8 A
Ê
as well as a three-
dimensional structure to 30 A
Ê
resolution for the complete
complex in situ. This latter observation reveals an
unexpected arrangement of the protein domains. T his,
combined with new biochemical data has led us to an
alternative m odel of the ultrastructure of the t hylakoid
grana where segregation exists within the grana itself, with
LHCII and PSII core components segregated in alter-
nate membranes within the stack. This arrangement
would change t he existing view of plan t photosynthesis
in several areas, has implications for our understanding of
Correspondence to R. C. Ford, Department of Biomolecular Sciences,
UMIST, PO Box 88, Manchester M60 1QD, UK.
Fax: + 44 161 2360409, E-mail:
Abbreviations: Chl, chlorophyll; LHCII, light harvesting complex II;
PSII, photosystem II.
(Received 20 July 2001, revised 18 Au gust 2001, accepted 5 November
2001)
Eur. J. Biochem. 269, 326±336 (2002) Ó FEBS 2002
photosystem II structure/function and suggests potential
links between cyanobacterial and plant PSII light harvest-
ing systems.
EXPERIMENTAL PROCEDURES
Barley viridis zb63 grana membranes were prepared, and
electron microscopy was performed as described previously
[19,21]. Image processing was carried out with a group of
programs developed mainly at the Medical Research
Council Laboratory of Molecular Biology [26]. After
correction for lattice defects (lattice unbending) and for
the contrast transfer function (CTF), data was merged. The
program
PLOTALL
was used to calculate the phase errors for
the structure factors (kindly provided by W. Kuhlbrand,
MPI Biophysics, Frankfurt)
1
. Phase origins were determined
using the program
ORIGTILTD
with restriction to the lower
resolution (to 20 A
Ê
), high signal/noise (IQ3 or better)
re¯ections [26,46]. The IQ is a n integer value determined by
the peak-to-background ratio at a point in reciprocal space
determined by the reciprocal lattice, with a value of IQ1 for
a ÔgoodÕ ratio of 8 : 1 or more, with IQ values 2±8
identifying re¯ections with progre ssively worse peak to
background ratios. Finally IQ9 is assigned to re¯ections
with amplitudes below background. The phase origins were
then further re®ned using the lower resolution (to 20 A
Ê
)
averaged structure factors from the initial merging proce-
dure as the starting reference. Structure factors were
vectorially averaged using the program
AVGAMPHS
using
only re¯ections of signal/noise IQ7 or better. Projection
maps were calculated using an isotropic temperature factor
(500 A
Ê
2
) applied to all the averaged s tructure factors with
®gure of merit > 0.88 to compensate f or resolution-
dependent fading in image intensities. This resulted in the
enhancement of higher r esolution features in the map,
without the over-representation of these freq uencies that
can occur when very high temperature factors are applied.
The same temperature factor of 500 A
Ê
2
wasemployedinthe
study by Rhee & coworkers [11], suggesting that fading is
not signi®cantly steeper for the in situ PSII crystals we have
studied. The image processing approach employed here for
small crystalline areas was initially described by Perkins
et al. [22]. An assessment of the procedure using simulated
cryo-electron microscopy data was later carried out [23].
These articles demonstrated that it was possible to greatly
improve structural data obtained from cryo-electron mi-
croscopy of small crystals by averaging structure factors
over several crystalline areas. Each observed re¯ection i n a
Fourier transform consists of a noise component and a
signal component, with the noise affecting the accuracy of
both amplitude and phase components. Amplitudes are
generally noisier for cryo-electron microscopy, whilst phases
are usually more reliable when compared to X-ray crystal-
lography. The approach developed by Perkins et al.
depends on oversampling (redundancy) followed by aver-
aging by vector summation. A measure of the redundancy
for each structu re factor is therefore an important indication
of the reliability of its vector sum phase and amplitude
values, with high redundancy correlating with better
accuracy. Within a data set derived from 21 crystal areas,
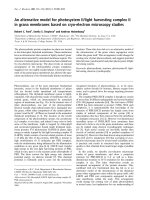
Fig. 1. Thylakoid membrane morphology.
(a) Transmission electron micrograph of an
ultrathin s ection of isolated barley chloroplast
membranes (thylakoids). Note the t ightly
stacked membranes (grana). Scale
bar 500 nm ( b) Zoomed re gio n of (a)
showing a single grana stack, sectioned s lightly
obliquely. (c) Explanation of the morphology
shownin(b)withunstackedregions(u)
and t ightly appressed membrane pairs forming
the stacked regions (s). A single membrane
pair (dotted line) is indicated. (d) Higher
magni®cation of two membrane pairs in a
stack in side view with the narrow partition
gap between the membranes highlighted
(white arrows). Scale bar 100 nm
(e) Micrograph of i solated membrane p airs in
face view, embedde d in negative s tain, and
displaying two-dimensional crystals of PSII/
LHCII. Scale bar 150 nm
Ó FEBS 2002 PSII/LHCII structure in situ (Eur. J. Biochem. 269) 327
a m ean redundancy of 5.6 shows that these data are
convoluted with noise but not completely buried in the
noise, w ith a probability of 0.28 of an individual high
resolution structure factor being recorded for a single small
crystal, with a raw peak-to-background ratio better than
1.6, i.e. equivalent to IQ7 or better. In comparison, control
areas (noncrystalline) give IQ7 or better observations (by
chance) with a p robability of o nly 0 .08 f or a g iven
(imaginary) high resolution reciprocal lattice point. For a
theoretical dataset of 21 separate control (noncrystalline)
areas, a redundancy of > 4 or > 5 would arise by chance
with a p robability (see below) of only 0.022 and 0.004,
respectively, for any given structure factor. Thus a redun-
dancy > 5 in an experimental data set is indicative that
signi®cant information is likely to be present for a given
structure factor.
Probability is given as: P(r)
n
C
r
p
r
(1 ) p)
n±r
where
n
C
r
n!/[r!(n ) r)!] a nd r is the number of observations of a
structure factor in a data set of n crystals, with p being the
individual (one-off) probability of observing data of IQ 7 o r
better by chan ce alone.
A redundancy of 5 .6 in this data set corresponds to
standard errors for t he mean (vector sum) phases of around
30° (see Tables 1±3)
2
. Standard error of the mean (vector
sum) phase appears to b e a more reasonable estimate for the
phase errors for this image processing procedure because
this measure i ncludes a weighting f or the number o f
observations, i.e. the redundancy of the data is taken into
account. In comparison, unweighted interimage phase
residuals do not take into account the redundancy of the
data and hence can g ive a misleading pessimistic impression
of the reliablility of oversampled data.
The three-dimensional data set was obtained using the
same approach as above and as described in Amos et al.
[26], but because of the very large body of data, we initially
restricted the analysis to the lower r esolution/higher ampli-
tude components. Table 1 lists the number of ®les employed
in the different tilt ranges, demonstrating that reciprocal
space is reasonably evenly sampled by the data. Neverthe-
less, the physical restriction imposed by the specimen holder
in the microscope means that there is a Ômissing coneÕ of data
corresponding to tilts beyond 60±70°. The effect th at this
missing data has on the three-dimensional reconstruction
has been discussed previously [26], with its main outcome
being some loss of resolution perpendicular to the crystal
plane.
A three-dimensional Coulomb d ensity map for the
cyanobacterial PSII core complex was calculated using the
SPIDER
image processing software package (Health
Research Inc. New York) and inputting the P rotein Data
Bank ®le 1fe1 [12]. This ®le lacks the extramembraneous
loops of the transmembrane protein subunits and one of the
extrinsic subunits of the c yanobacterial PSII core complex,
which remain to be identi®ed in the electron density map.
For a projection map, slices parallel to the predicted
membrane plane were selected from the three-dimensional
map and averaged together. The resolution was arti®cially
curtailed to 8A
Ê
resolution for the projection map, or
30 A
Ê
resolution for the three-dimensional volume using a
suitable Fourier ®lter.
Table 1. Crystallographic image processing statistics for the 8-A
Ê
pro-
jection map.
Scan step at the specimen level 2.6 A
Ê
Plane group p1
Lattice parameters a 155.6 1.5 A
Ê
b 230.6 2.4 A
Ê
aÄ 97.1° 1.7°
No. of crystalline areas 21
No. of observations (to IQ8) 9824
(to IQ7) 4810
No. of structure factors 846
No. with FOM
2
> 0.8 734
No. used for map with FOM > 0.88 557
Mean redundancy (250±8 A
Ê
, to IQ7) 5.6
Table 2 .
8
Crystallographic image processing statistics for the 8 A
Ê
projection map over d ierent resolution ranges.
Resolution Rmerge
a
Mean FOM
b
SE (°)
c
Redundancy
d
% Complete
e
250±50 A
Ê
0.28 0.99 9.0 13.9 91%
50±30 A
Ê
0.26 0.98 23.5 6.7 85%
30±15 A
Ê
0.26 0.95 29.1 5.6 56%
15±10 A
Ê
0.34 0.93 29.4 5.3 63%
10±8 A
Ê
0.38 0.93 28.6 4.7 60%
a
Average amplitude variation for structure factors in the given resolution range. For any individual structure factor Rmerge
|I
i
±I
mean
|/
I
i
where I
i
is each separate observation of the amplitude of the structure factor.
b
Average ®gure of merit for structure factors
in the resolution range. FOM is the weight for each structure factor that gives the smallest r.m.s. error in the Fourier synthesis [47].
c
Standard
error of the mean phase was calculated for each structure factor and then averaged over the given resolution range.
d
Average number
of observations of IQ7 or better, for structure factors within this resolution range.
e
Number of structure factors used (with FOM > 0.88)
for calculating the map vs. the number of structure factors actually expected in this resolution range.
Table 3. Crystallographic image processing statistics for the
9
30 A
Ê
three-
dimensional map.
Scan step at the specimen level 6.6 A
Ê
or 8.9 A
Ê
No. of crystalline areas 168
Maximum tilt angle 66°
No of ®les in tilt range 0±30° 69
30±40° 14
40±50° 28
50±60° 54
60±66° 2
No. of observations (to 30 A
Ê
) 5066
No. of structure factors used 470
Overall weighted phase residual to 30 A
Ê
24°
(where 90° is random)
328 R. C. Ford et al. (Eur. J. Biochem. 269) Ó FEBS 2002
The isolation of membrane fractions from grana mem-
branes was carried out by sucrose density gradient centrif-
ugation following disruption of the tightly stacked
membrane pairs by c haotropic agents. Treatment with
Tris-base (1.5
M
Tris/hydroxymethyl aminomethane,
pH 8.8) for 2 h in subdued light at 20 °C, was followed
by one freeze-thaw cycle overnight, and then the treated
membranes w ere w ashed and collected by centrifugation f or
2 h at 110 000 g in a Beckman SW41 rotor onto a sucrose
cushion composed of 2
M
sucrose in buffer A (20 m
M
Mes,
5m
M
MgCl
2
,15m
M
NaCl, pH 6.3). The sharp green band
at the 2-
M
sucrose interface was collected and then f rozen at
)20 °C and th awed once more before being loaded onto a
linear sucrose gradient composed of 0±2
M
sucrose i n 0.75
M
Tris-base, 3
M
urea, pH 8.8. After centrifugation for 2 h at
110 000 g in a Beckman SW41 rotor, green bands corre-
sponding to different membrane fractions were harvested.
Membranes were diluted 1 : 1 with distilled water and then
centrifuged at 110 000 g for2htoobtainpellets.After
resuspension in buffer A, the membranes w ere analysed by
absorbance spectroscopy, SDS/PAGE and electron micros-
copy. Absorbance spectra were recorded with a Kontron
spectrophotometer (model Uvikon 943) with 1-cm path-
length cuvettes. SDS/PAGE was carried o ut as described
previously [19,21].
RESULTS
PSII/LHCII structure
Figures 1a,b shows the morphology of the thylakoid
membranes we employed, with the characteristic stacked
membranes o f t he grana. Isolation of tightly stacked
membrane pairs (Fig. 1c,d) is readily achieved, and two-
dimensionally ordered arrays of PSII/LHCII present in
these membranes (Fig. 1e) can be observed [13±21]. C ryo-
electron microscopy of such two-dimensional arrays gener-
ated projection and three-dimensional structures of the
PSII/LHCII complex. Figure 2a shows the signal-to-noise
ratios of reciprocal lattice points after averaging 21 untilted
crystalline arrays. The data is relatively complete and the
phase errors are acceptably low (Table 1). A three-dimen-
sional data set was subsequently generated by tilting the
two-dimensional crystals. Lattice lines are displayed i n
Fig. 2b with a low resolution (h,k 0, 2) and a higher
resolution (1, )5) lattice line for comparison. The phases are
better clustered than the amplitudes for both lattice lines;
this is expected for e lectron microscopy-derived structure
factors. Oversampling a llows the i mprovement of the
estimates f or the interpolated values of the vector sum
phases along z* to 30 A
Ê
resolution. Table 3 gives a more
quantitative assessment of the quality of the structural data
as a function of resolution.
Figure 3A shows a projection map of the crystal plane
using contours to indicate protein density. For comparison
of general vs. ®ne features, data is included up to a spatial
resolution of 18 A
Ê
(right) a nd 8 A
Ê
(left). See Table 2 for an
indication of the reliability of the structural information a t
these two resolution limits. A high density region of a
roughly r ectangular outline (140 ´ 100 A
Ê
)isapparent,
bisected by a lower density channel. Approximately at the
centre of the 140 ´ 100 A
Ê
ÔcoreÕ domain in the 8-A
Ê
map is a
distinctive S-shaped region formed by several strong density
peaks. The S-shaped region could be the location of the
reaction centre of PSII, which, on the basis of its predicted
similarity to the bacterial reaction centre [24], has been
observed in three-dimensional density maps obtained for
PSII core complexes [11,12] (Fig. 4B). The overall dimen-
sions of the core domain (140 ´ 100 A
Ê
) match very closely
to the dimensions of one monomer of the cyanobacterial
PSII core complex (130 ´ 100 A
Ê
)determinedbyX-ray
crystallography [12], as shown in Fig. 3B. This supports the
conclusion that the higher plant PSII complex i s monomeric
in vivo, a s suggested previously [14,15,19±21,23]. Clearly,
caution must be exercised in a more detailed comparison of
the two projection maps especially regarding the identi®ca-
tion of transmembrane helices, because in the native PSII
structure, additional extrinsic proteins and loops will be
superimposed (compare to Figure 4), w hereas in the c urrent
deposition of the cyanobacterial structure, only the trans-
membrane regions and t wo of the extrinsic subunits are
de®ned [12]. Similarly, the 8-A
Ê
resolution projection map of
the PSII core complex derived by R hee & coworkers [25],
did not allow the unambiguous identi®cation of transmem-
brane helices nor the reaction centre; but this was resolved
when the 8 A
Ê
three-dimensional structure became available
[11], as con®rmed b y the 3.8-A
Ê
three-dimensional structure
[12].
A roughly twofold rotational symmetry can be discerned
in Fig. 3A for the core domain, with a twofold axis in the
middle of the S-shaped region as might be predicted for a
heterodimeric complex. Interestingly, the S-shape is echoed
in the surrounding high density domains which arch around
it in bands 30±40 A
Ê
wide and 130 A
Ê
long. These bands
terminate at two o'clock a nd eight o'clock positions on the
periphery of the core, leaving gaps which are discussed
below. The high density core domains do not directly
contact each other, but each is surrounded by wide lanes of
lower density, presumably corresponding to lipid. Several
small connecting d ensities appear to be responsible for
forming bridges between the core domains in the lattice
(arrow s).
In order to obtain further structural information, the
three-dimensional structure of PSII/LHCII in the g rana
membranes was also obtained, using established method-
ology [11,26,27]. Details regarding the image processing
statistics are given in Table 3. The three-dimensional
structure has been calculated to a resolution o f 30 A
Ê
.
This cu t-off is suitable for comparison with earlier studies of
negatively stained PSII/LHCII, which have a similar
resolution. Three-dimensional d ata beyond 30 A
Ê
have been
collected and processed, but further crystals need to be
included in the analysis to adequately oversample three-
dimensional reciprocal space to higher (8 A
Ê
) resolution.
Figure 4 s hows different views of t he PSII/LHCII complex,
with a surface generated at a suitable threshold for
discrimination of protein density. The main features of the
140 ´ 100 A
Ê
core domain c orrespond closely to those
described earlier for negatively stained spec imens [14,15].
The distinctive cavity on the lumenal side of the complex is
apparent, surrounded by four prominent lumenal domains,
some of which were previously assigned to extrinsic PSII
proteins that enhance oxygen e volution. Sequential removal
of these extrinsic proteins, followed by structural analysis
has identi®ed domains I, II and III as the approximate
locations of oxygen evolution enhancing (OEE)
3
proteins I,
Ó FEBS 2002 PSII/LHCII structure in situ (Eur. J. Biochem. 269) 329
Fig. 2.
5
Quality of the electron crystallography data. (a) Cryo-electron crystallography data after averaging over 21 separate untilted crystalline areas.
The size of the box and n umber indicate the standard error of the mean phase ( SE) for the structure facto r with 1 SE < 8°,2 SE 8±14°,
3 SE 14±20°,4 SE 20±30° and boxes without a number SE 30±40°. The rings correspond to 15, 10 and 8 A
Ê
resolution (inner to outer rings),
and the principal crystallographic axes are indicated. (b ) Lattice lines within the three-dimensional data set showing the sampling of rec iprocal space
along z* (perpen dicular to a*b*). Each data p oint represents a separate observation of the a mplitude and phase (in degrees) fo r a given re¯ection,
with th e z * valu e given by t he tilt angle and th e angle be tween the tilt axis a nd a*. The trend of the data for the c ontinuous transform along z* is
shown by the ®tted line. A lattice line for a relatively low resolution re¯ection, with well clustered phases (h,k 0,2), is compared w ith a lattice line
for a higher resolution re¯ection (h,k 1,5).
330 R. C. Ford et al. (Eur. J. Biochem. 269) Ó FEBS 2002
II and III, respectively, wh ilst domain IV was assigned to the
large lumenal loops of core polypeptide CP47 [15]. A further
domain (V) underlying and contributing to domains II and I
was assigned to the lumenal portion of CP43. In the X-ray
structure of the core complex of cyanobacteria ([12], F ig. 4,
lower panels), density for part of OEE I (Psb O) is present,
and occupies a lumenal position in the corner of the complex
which would correspond to the location of domain I in the
higher plant complex. Th e cyanobacterial system does not
have the OEE II polypeptide, but rather has an extrinsic
cytochrome c
550
subunit. This sits in another l umenal corner
of the cyanobacterial complex in a position equivalent to
domain II in t he higher plant three-dimensional structure.
The third (12 kDa) extrinsic polypeptide of the c yanobac-
terial complex was not resolved in the publishe d structure
[12], but is likely to appear in later density maps (P. Orth,
FU, Berlin, personal communication)
4
.Theoveralldimen-
sions and shape of the cyanobacterial PSII core complex and
the higher plant PSII core region are very similar at 30 A
Ê
resolution, again supporting the idea that the higher plant
PSII complex is monomeric in situ.
The location of the connecting densities that bridge
between the core domains was unexpected. It is clear from
Fig. 4 that the connecting domains lie in a separate p lane to
the main core region. All these small domains align almost
exactly along a single plane, which immediately suggests
that they are not due to random noise or poor sampling of
three-dimensional space. The most likely explanation for
this observation, given the double-layered nature of the
crystals, i s t hat the connecting domains occupy a membrane
that is separate to the one housing the core domain.
A n arrow but distinct gap between th e two planes of density
is 0.5±1 nm across, which would c orrespond closely t o the
width o f the partition region that can be identi®ed between
pairs of closely appressed g rana membranes in ultrathin
sections (Fig. 1d). The overall size (4 nm height ´ 3nm
Fig. 3.
6
Projection maps of the entire PSII/
LHCII complex. (A) Maps are calculated to
8A
Ê
(left) and 18 A
Ê
resolution (right). The
crystallographic a and b axes are indicated
(lower left). Solid contours begin at a density
level corresponding to 0.5 r above the mean
level, and extend up in even steps to 3.5 r
above the mean. The two do tted c ontours a re
drawn at t he mean density level and at 0.25 r
above the mean. The thick arrows ind icate
densities that appear to bridge the wide low
density channel running approximately par-
allel to the a axis. The repeat along a is
155.6 A
Ê
, along b, 230.6 A
Ê
. (B) Co mparison of
themaincoreregionofthe8A
Ê
map (left) and
a projection map calculated from the protein
data bank deposition 1f e1 for t he cyan obac-
terial PSII core complex (right), which is
composed mainly of the transmembrane
helices identi®ed so far in the structure. An
S-shaped reaction ce ntre domain consisting of
the transmembrane helices of polypeptides D1
and D2 is highlighted in the cyanobacterial
map (dashed ellipse). This region is tentatively
assigned in the higher plant map (ellipse), and
is centred on a rough twofold symmetry axis.
The transmembrane helices of the a ccessory
polypeptides CP47 and CP43 can not be
readily identi®ed in the higher plant map,
however, as < 5 0% of the ma ss of thes e
subunits is contained in the tran smembrane
helices, then t heir identi®cation in a projection
map is unlikely because of convolution with
overlying densities.
Ó FEBS 2002 PSII/LHCII structure in situ (Eur. J. Biochem. 269) 331
width ´ 4 nm length) and number (4±5) of the connecting
domains immediately suggested that they could be periph-
eral LHCII proteins [10], although the resolution was
insuf®cient for unambiguous id enti®cation, and one cannot
exclude the possibility that these densities may be due to
ordered peripheral proteins. If the assignment to LHCII is
correct, then the observation of only 4±5 densities rather
than 8±12 implies that only a subset of the LHCII
population is involved in the contacts between core
complexes.
Biochemical evidence for two grana membrane fractions
Biochemical evidence for the presence of two different
membrane types in grana thylako id membrane fractions is
scant. A s earch f or conditions that would allow t he
disruption of t he paired membranes w ithout membrane
solubilization was carried out. Se veral procedures employ-
ing chaotropes and/or proteases were found to give some
separation of the membrane pairs. A p rocedure employing
high concentrations of Tris-base combined with urea and
freeze-thaw cycles was found to be the most effective, as
judged by the separation of several different membrane
fractions by sucrose density gradient centrifugation
(Fig.5A).Incontrolexperiments,granamembranes
migrated in the d ensity gradient to a single l ocation at
around 1.1
M
sucrose. These m embranes had a n absorption
spectrum t hat w as typical for grana m embranes, w ith a high
content of chlorophyll (Chl) b as d emonstrated by the Chl b
absorption bands at a bout 650 and 480 nm (Fig. 5B). For
Fig. 4. Upper panels show the three-dimensional structure of PSII/LHCII at 30 A
Ê
resolution (green). Left panel shows a view from the lumenal side,
with th e c haracteristic four-lobed appearance (domains I±IV) a nd the central cavity. Note the small interconnecting domains are s till re solved at this
resolution. Right panel shows a side view, incorporating a slice through the closest PSII core complex revealing the extent of the central cavity. N ote
the interconnecting do mains a ll lie in a separate plane to the core domains. T he p utative boundarie s of two c losely app ressed lip id bilayers
7
40 A
Ê
thick are in dicate d by the white parallel lines. Lower p anel (blue) shows equivalent v iews generated from the prot ein data bank d eposition 1fe1 for
the cyanobacterial PSII core c omplex. The extrinsic subunits PsbO and cyt- c
550
in the cyanobacterial P SII complex are indicated. Note: p rotein
regions an d loo ps external to the me mbrane an d one extrinsic subunit are not includ ed in 1fe1, explaining the apparent truncation of the volume
when viewed along the mem brane plan e (right). The scale bar r elates to all pan els.
332 R. C. Ford et al. (Eur. J. Biochem. 269) Ó FEBS 2002
Tris/urea-treated membranes, this b and was also observed,
but it contained less material when c ompared to the control
(band b ). Two further distinct chlorophyll-containing bands
were observed for the Tris/urea-treated material: mem-
branes separating as a broad band located at 1.4
M
sucrose (band c) showed a radically changed absorption
spectrum, being depleted in the Chl b absorption bands at
650 and 480 nm, consistent with a lack of light-harvesting
Chl a/b proteins (LHCII). Membranes located slightly
above the main band at 1.0
M
sucrose (band a) had a
similar absorption spectrum to the main band, but with a
slightly increased Chl b absorption.
SDS/PAGE of the Tris-treated membranes is shown in
Fig. 5C. The fraction isolated from around 1.4
M
sucrose
(band c in panel A) was signi®cantly depleted in LHCII
polypeptides, but was enriched in the core polypeptides
D1,D2, CP43 and CP47 (right track). No bands due to
extrinsic polypeptides of PSII (33, 23, 17, 10 kDa) could be
observed, but these polypeptides will be removed by the
chaotrope treatment. The f raction isolated at 1.0
M
sucrose
(band a in panel A ) is signi®cantly depleted in the D1,D2,
CP43 and CP47 polypeptides (left track) whilst retaining
intensely staining LHCII polypeptides. These data therefore
suggest that separation of grana membranes into denser
PSII core-enriched membranes and l ess dense LHCII-
enriched membranes is possible after chaotrope treatment.
Electron microscopy of the two chaotrope-treated mem-
brane fragments revealed two different membrane morpho-
logies (Fig. 6). The core PS II-enriched density gradient
fraction consisted of larger ( 200 nm diameter) ¯at
Fig. 6. Electron microscopy of negatively
stained Tris/urea-treated membranes after
separation on a sucrose g radient. (a) Core
PSII-enriched membranes (band c from the
sucrose gradient) contain tightly packed
14 nm diameter particles (inset). (b) and (c)
LHCII-enriched membranes (band a from the
sucrose gradient) are tubular in mo rphology
with small particles. The scale b ar represents
500 nm.
Fig. 5. Characterization of grana membrane
fractions after Tris/urea-treatment and separa-
tion by sucrose density gradient centrifugation.
(A) Control membranes migrated as a single
band on the gradient whilst Tris/urea-treated
membranes migrat ed as t hree b ands, a ±c (left).
(B) The absorption spectra of the Tris/urea-
treated membranes, a-c are shown (a solid
line, b gray line, c d ash ed line). Th e
spectrum of the control membranes was not
signi®cantly dierent to that shown by band b
of the Tris/urea-treated material. (C) Poly-
peptide composition o f the sucro se density
gradient fractions from Tris/urea-treated
membranes as determined by SDS/PAGE and
Coomassie staining. The left lane shows band
a and the right lane band c. Molecular mass
markers are ind icated o n t he left of the panel.
Ó FEBS 2002 PSII/LHCII structure in situ (Eur. J. Biochem. 269) 333
membrane patches that contained large 14 nm diameter)
particles (Fig. 6a, insert) consistent with core PSII. The
packing of these complexes is very tight (2300 parti-
clesálm
)2
), considerably higher than that observed for
untreated grana membranes (1300±1500 particlesálm
)2
).
The LHCII-enriched density gradient fraction contained
rolled-up membrane ÔtubesÕ withsmallinternalfeatures.
(Fig. 6b,c).
DISCUSSION
Interpretation of the three-dimensional data
The data presented here provide i nformation for the
complete PSII/LHCII complex observed under co nditions
that preserve its native s tate [27]. In earlier structural studies,
negative stain was employed where d ehydration and
shrinkage are known t o be problems [14,21] as well as
differential staining of upper and lower surfaces of t he
specimen [28]. These combined factors may explain why
previous studies did not readily identify two planes of
density. Negatively stained PSII/LHCII c rystals in spinach
grana [14] do d isplay some small domains that lie in a lower
plane than the main core of the complex [14], but there was
no complete separation of these densities into two p lanes as
observed in this w ork.
The d ata shown in Fig. 5 suggest that the physical
separation of grana membranes into fractions differing in
density is possible. No detergent is involved in this
separation process, and the density gradient fractions can
be recovered (after d ilution) by centrifugation. This strongly
suggests that the fractions are membranes and not deter-
gent-solubilized PSII/LHCII complexes, as con ®rmed by
electron microscopy (Fig. 6). Isolation of discrete m em-
brane fractions enriched in either core PSII or LHCII has
not been previously described, despite the widespread use of
grana membranes reported in the literature. This may be
because harsh conditions (which will result in PSII inacti-
vation) are required to disengage the two tightly appressed
membranes, and therefore these conditions are unlikely to
have been widely explored previously. The use o f such
chaotropes is, however, undesirable, and a search for milder
dissociation conditions is underway. This should help to
exclude any possibility that the chaotropes have artefactu-
ally induced the s egregation we observe.
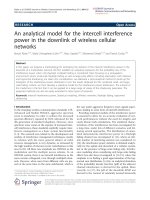
Diagrams to explain the structural models for PSII/
LHCII in situ are presented in Fig. 7, with the currently
accepted model shown in Fig. 7a and a n alternative model
shown in Fig. 7b. In the n ew model the arrays are composed
of large core PSII complexes that are connected to each
other via small bridging light harvesting complexes that are
located in a separate adjacent membrane. This ®ts the
structural and biochemical data, w here PSII core complexes
can be observed in one discrete plane and membrane
fraction, and LHCII complexes can be observed in another
membrane fraction. A survey of previous structural studies
of thylakoid membranes [13,16,17,21, 29±32] suggests that
they may be newly interpreted in terms of the alternative
model of thylakoid structure. A review of these studies is
beyond the scope of this paper and will be presented
elsewhere.
The alternative model, if correc t, has several implica-
tions for understanding PSII function ranging from light
harvesting control [33±38] to the optimization of diffusion
of PSII and of components around PSII [39±44]. A
discussion of these implications is again beyond the scope
of this paper, and will be addressed in a separate review.
However we note that migration of light energy to the PSII
core in a direction perpendicular to the membrane plane
would not be unique to plants. The more ancient
cyanobacterial PSII does not have LHCII proteins, but
rather it depends on water-soluble light harvesting proteins
that are attached as a ÔphycobilisomeÕ to the stromal
surface of the PSII core [36]. Other photosynthetic
bacteria, such as the green sulphur bacteria, also move
light excitation energy from chlorosomes to the membrane
in which the reaction centre is found [37].
Testing the model
This paper h ighlights a discord between the structural data
and the existing model of PSII/LHCII and grana archi-
tecture, and this should now open a debate on the merits
of the alternative models. We note that Ômacro-domainsÕ of
LHCII in plants have already been proposed to explain
data derived from several biophysical techniques [45], and
that intercalatio n o f LHCII and PSII core domains in
paired grana membranes has recently been discussed [48].
Thus some movement towards a revised view of grana
ultrastructure has already been made. Ho wever, it is impor-
tant to stress that many questions remain unanswered for
Fig. 7. Models for grana ultrastucture. (a) Existing, widely accepted
model of thylakoid ultrastructure. PSII core (red) and LHCII (green)
coexist in the same, t ightly packed lipid bilayer (blue), with light energy
transferred laterally from LHCII to PSII core. The repeat distance in
the stack is 16 nm, and some interdigitation is required in order to
accommodate the l arge lumenal domains of PSII in this model. (b)
Alternative m odel of the ultrastructure of grana with LHCII and PSII
located in separate lipid bilayers in the stack. The boxed area repre-
sents a crystalline array viewed edge-on, i.e. two tightly appressed
membranes with lattice contacts along th e crystal plane formed by
LHCII.
334 R. C. Ford et al. (Eur. J. Biochem. 269) Ó FEBS 2002
the model that we have presented, and that several reports
based on detergent solubilized complexes obtained from
higher plant grana have proposed alternative arrangements
for the interaction of LHCII with the PSII core [49±51].
The ÔsupercoreÕ and ÔmegacoreÕ complexes identi®ed by
Boekema & coworkers by single particle image processing
are interpreted as showing LHCII and PSII core in close
side-by-side association. The number of LHCII molecules
that are assigned in these large tetrameric complexes is,
however, much less than the 8±12 required per PSII core,
hence the two alternative interpretations of LHCII±PSII
structural data might be compatible if a small subset
of LHCII polypeptides associate more in timately with
PSII core whilst the remaining occupy a separate
membrane.
Progress is slowly being made towards processing a
higher resolution three-dimensional data set for the PSII/
LHCII crystals. When this is complete, the data should
reveal much more concerning the nature of the contacts in
the crystals and offer further insight into the interplay
between PSII s tructure and function in the thylakoid
membrane.
ACKNOWLEDGEMENTS
We would like to thank Dr M. F. Rosenberg for his assistance with
software and Dr S. Prince, Dr S. V. Rue and Prof. G. Garab for
useful suggestions and debate. T. D. Flint is thanked f or plant g rowth
and specimen p reparation as well as L. Child and P. McPhie for expert
technical assistance. The data collection phase of this work was
supported by the UK Biotec hnology and Biological Science s Research
Council.
REFERENCES
1. Andersson, B. & Anderson, J.M. (1980) Lateral heterogeneity in
the distribution of chlorophyll±protein complex es of the thylakoid
membranes of spinach chloroplasts. Biochim. Biophys. Acta 593,
427±440.
2. Anderson, J.M. & Andersson, B. (1982) The architecture of the
photosynthetic membrane: lateral and transverse organisation.
Trends Biochem. Sci. 7, 288±292.
3. Barber, J. (1980) An explanation for the relationship between salt-
induced t hylakoid stack ing and the chloro phyll ¯u orescenc e
changes associated in spillover of energy from photosystem II to
photosystem I. FEBS Lett. 118, 1±10.
4. Green, B.R. & Dunford, D.G. (1996) The chlorophyll-carotenoid
proteins of oxygenic photosynthesis. Ann. Revw. Plant Physiol. 47,
685±714.
5. Kyle, D.J., Staehelin, L.A. & Arntzen, C.J. (1983) Lateral mobility
of the light harvesting complex in chloroplast membranes controls
excitation energy distribution in higher plants. Arch. Biochem.
Biophys. 222, 527±541.
6. Pfannschmidt, T., Nilsson, A. & Allen, J.F. (1999) Photosynthetic
control of chloroplast gene expre ssion. Natu re 397, 625±628.
7. Rutherfo rd, A.W. (1989) Photosystem II, the water-splitting
enzyme. Trends Biochem. Sci. 14, 227±232.
8. Vermaas, W. (1993) Molecular biological approaches to analyze
photosystem II structure and function. Ann. Rev. Plant. Physiol.
Molec. Biol. 44, 4 57±481.
9. Rue, S.V. & Sayre, R.T. (199 8) Functional ana lysis of
photosystem II. In The Molecular Biology of Chloroplasts and
Mitochondria in Chlamydomonas. (Rochaix, J.D., Goldschmidt-
Clermont, M & Merchant, S, eds) pp. 287±322. Kluwer Academic
Publications, the Netherlands.
10. Kuhlbrandt, W., Wang, D N. & Fujiyoshi, Y. (1994) Atomic
model of plant light harvesting complex by electron crystallogra-
phy. Nature 367, 614±621.
11. Rhee, K.H., Morris, E.P., Barber, J. & Kuhlbrandt, W. (1998)
Three-dimensional structure of the plant photosyste m II reaction
centre at 8 A
Ê
resolution. Na ture 396, 283±286.
12. Zouni,A.,Witt,H.T.,Kern,J.,Fromme,P.,Krauss,N.,Saenger,
W. & Orth, P. (2001) Crystal structure of photosystem II from
Synechococcus elongatus at 3.8 A
Ê
Resolution. Nature 409 , 739±
743.
13. Staehelin, L.A. (1975) Chloroplast membrane structure. Biochim.
Biophys. Acta 408, 1±11.
14. Holze nburg, A., Bewley, M.C., Wilson, F.H., Nicholson, W.V. &
Ford, R.C. (1993) Three-dimensional s tructure of photosystem II.
Nature 363, 470±472.
15.Ford,R.C.,Rosenberg,M.F.,Shepherd,F.H.,McPhie,P.&
Holzenburg, A. (1995) Photosystem II 3D structure and the role of
the extrinsic subunits in photosynthetic oxygen evolution. Micron
26, 133±140.
16. Tsvetkova, N.M., Apostolova, E.L., Brain, A.P.R., Williams,
W.P. & Quinn, P.J. ( 1995) Facto rs in¯uencing PSII p article array
formation in Arabidopsis thaliana chloroplasts and the relationship
of such arrays to the thermostability o f PSII. Biochim. Biophys.
Acta 1228, 201±210.
17. Semenova, G. (1995) Particle regularity on thylakoid fracture
faces is in¯uence d by sto rage cond itions. Can. J. Bot. 73, 1676±
1682.
18. Marr, K.M., M cFeeters, R.L. & Lyon, M.K. (1996) Isolation and
structural analysis of two-dimensional crystals of photosystem II
from Hordeum vulgare viridis zb63. J. Struct. Biol. 117, 86±98.
19. Stoylova, S., Flint, T.D., Ford, R.C. & Holzenburg, A. (1997)
Projection structure of photosystem II in vivo studied by cryo-
electron microscopy. Micron 28, 439±446.
20. Stoylova, S., Flint, T.D., Ford, R.C. & Holzenburg, A. (1998)
Comparison of photosystem II 3D structure as determined by
electron crystallography of frozen-h ydrated and n egatively stained
specimens. Micron 29, 341±348.
21. Stoylova, S., Flint, T.D., Ford, R.C. & Holzenburg, A. (2000)
Structural analysis of ph otosystem II in far-red light adapted
thylakoid membranes: new crystal forms provide evidence for a
dynamic reorganization of light harvesting antennae subunits.
Eur. J. Biochem. 267, 207±215.
22. Perkins, G.A., Downing, K.H. & Glaeser, R.M. (1995) Crystal-
lographic extraction and averaging of data from small image
areas. Ultramicroscopy 60, 283±294.
23. Stoylova, S., F ord, R.C. & Holzenburg, A. (1999) Cryo-electron
crystallography of small and mosaic 2-D crystals: an assessment of
a procedure for high resolu tion data retrieval . Ultramicroscopy 77,
113±128.
24. Deisenhofer, J., Epp, O., M iki, K., Huber, R . & Michel, H. (1985)
Structure of t he protein subunits in the photosynthetic reaction
centre of Rhodopseudomonas viridis at 3 A
Ê
resolution. Nature 318 ,
618±624.
25. Rhe e, K.H., Morris, E.P., Zheleva, D., Hankamer, B.,
Kuhlbrandt, W. & Barber, J. (1997) Two-dimensional structure of
plant photosystem II at 8 A
Ê
resolution. Na ture 389, 522±526.
26. Amos, L., H enderson, R. & Unwin, P.N.T. (1982) Three-dimen-
sional structure determination by electron microscopy of two-
dimensional crystals. Prog. Biophys. Mol. Biol. 39, 183±231.
27. Dub ochet, J., Adrian, M., Chang, J.I., Homo, J.C., L apault, J.,
McDowall, A.W. & Schulz, P. (1988) Cryo-electron microscopy of
vitri®ed specimens. Q. Rev. Biophys. 21, 129±228.
28. Harris, J.R. & Horne, R.W. (1993) Negative staining: a brief
assessment of current technical bene®ts, limitations and future
bene®ts. Micron 25, 5±13.
29. Simpson, D.J. (1979) Freeze fracture studies on barley plastid
membranes III. Carlsberg Res. Commun. 44 , 305±336.
Ó FEBS 2002 PSII/LHCII structure in situ (Eur. J. Biochem. 269) 335
30. Simpson, D.J., Vallon, O. & Von Wettstein, D. (1989) Freeze
fracture studies on barley plastid membranes VIII. Biochim. Bio-
phys. Acta 975, 164±174.
31. Olive, J., Recouvrer, M., Girard-Bascou, J. & Wollman, F.A.
(1992) Further identi®cation of the exoplasmic face p articles on
the freeze-fractured thylako id membranes. Eur. J. Cell Biol. 59,
176±186.
32. Rosenb erg, M.F., Holzenburg, A., Shepherd, F.H., Nicholson,
W.V., Flint, D. & Ford, R.C. (1997) Rebinding of the extrinsic
proteins of photosystem II studied by e lectro n m icroscopy and
single particle alignment. Biochim. Biophys. Acta 1319, 119±132.
33. Allen, J.F. (1992) Protein phosphorylation in the regulation of
photosynthesis. Biochim. Biophys. Acta 1098, 275±335.
34. Horton, P. (1999) Are grana necessary for regulation of light
harvesting? Aus. J. Plant. Physiol. 26, 6 59±669.
35. Campbell, D.A. & Hayden, D.B. (1992) Cross-linking of photo-
system-II light-harvesting complexes between appressed maize
thylakoids Plant Physiol. Biochem. 30, 723±732.
36. Delorimer, R.M., Smith, R.L. & Stevens, S.E. (1992) R egulation
of phycobilisome structure and gene expression by light int ensity.
Plant. Physiol. 98, 1003±1010.
37. Olson, J.M. (1998) Chlorophyll organization and function in green
photosynthetic bacteria. Photoche m. Pho tob iol. 67 , 61±75.
38. Kyle, D.J., Haworth, P. & Arntzen, C.J. (1982) Thylakoid mem-
brane phosphorylation leads to a decrease in connectivity between
photosystem II reaction centres. Biochim. Biophys. A cta 680,336±
342.
39. Millner, P.A. & Barber, J. (1984) Plastoquinone as a mobile
redox carrier in the photosynthetic membrane. FEBS Lett. 16 9,
1±6.
40. Kirch ho, H., Horstmann, S. & Weiss, E. (2000) Control of the
photosynthetic electron transport by PQ diusion microdomains
in thylakoids of highe r p lants. Biochim. Biophys. Acta 1459,148±
168.
41. McDermott, G., Prince, S.M., Freer, A.A., Hawthornthwaite-
Lawless, A.M., Papiz, M., Cogdell, R.J. & Isaacs, N.W. (1995)
Crystal structure of an integtral light-harvesting complex from
photosynthetic bacteria. Nature 374, 517±521.
42. Karrasch, S., Bullough, P.A. & Ghosh, R. (1995) The 8.5-Ang-
strom p rojection map of the light-harvesting complex-I from
Rhodospirillum-rubrum reveals a ring composed of 16 subunits.
EMBO J. 14, 631±638.
43. Barz, W.P., Vermeglio, A., Francia, F., Venturoli, G., Melandri,
B.A. & Oesterhalt, D. (1995) Role of the pufX protein in photo-
synthetic grow th of rhodobacter-sphaeroides.2. Puf X is required
for e cient ubiquinone u biquinol exchange be tween the reaction -
center Q (b) site and the cytochrome bc (1) complex. Biochemistry
34, 15248±15258.
44. Barbato, R., Bergo, E., Szabo, I., Dalla Vecchia, F. & Giacometti,
G.M. (2000) Ultraviolet B exposure of whole leaves of barley
aects structure and functional organization of p hotosyste m II.
J. Biol. Chem. 275, 10976±10982.
45. Simidjiev, I., Stoylova, S., Amenitsch, H., Javor®, T., Mustardy,
L., Laggner, P., Holzenburg, A. & Garab, G. (2000) Self-assembly
of large, ordered lamellae from non-bilayer lipids and integral
membrane proteins in vitro. Proc. Nat l Aca d. S ci. U SA 97, 1473±
1476.
46. Glaeser, R.M. & Downing, K.H. (1992) Assessment of resolution
in biological electron crystallography. Ultramicroscopy 47,256±
265.
47. Brillinger, D.R., Downing, K.H. & Glaeser, R.M. (1990) Some
statistical aspects of low-dose electron imagin g of crystals. J. Stat.
Plan. Inf. 25, 535.
48. Boekema, E.J., van Breemen, J.F.L., van Roon, H. & Dekker, J.P.
(2000) Arrangement of photosystem II supercomplexes in crys-
talline macrodomains within the thylakoid membrane of green
plant chloroplasts. J. Mol. Biol. 301 , 1123±1133.
49. Boekema, E.J., Hankamer, B., Bald, D., Kruip, J., Nield, J.,
Boonstra, A.F., Barber, J. & Roegner, M. (1995) Supramolecular
structure of the phot osystem II complex from green plan ts and
cyanobacteria. Proc. Natl. Acad. Sci. USA 92, 175±179.
50. Hankamer, B., Nield, J., Zheleva, D., Boekema, E.J., Jansson, S.
& Barber, J. (1997) Isolation and biochemical characterisation of
monomeric a nd dimeric photosystem II complexes from spinach
and their relevance to the organisation of photosystem II in vivo.
Eur. J. Biochem. 243, 422±429.
51. Boekema,E.J.,vanRoon,H.,Calkoen,F.,Bassi,R.&Dekker,
J.P. (1999 ) Multiple types of association of photosystem II and its
light-harvesting antenna in partially solubilized photosystem II
membranes. Biochemistry 38, 2233±2239.
336 R. C. Ford et al. (Eur. J. Biochem. 269) Ó FEBS 2002