Optimization of Gas Assisted Gravity Drainage (GAGD) Process in a Heterogeneous Sandstone Reservoir Field-Scale Study
Bạn đang xem bản rút gọn của tài liệu. Xem và tải ngay bản đầy đủ của tài liệu tại đây (3.96 MB, 20 trang )
SPE-174579-MS
Optimization of Gas Assisted Gravity Drainage (GAGD) Process in a
Heterogeneous Sandstone Reservoir: Field-Scale Study
Watheq J. Al-Mudhafar, and Dandina N. Rao, Louisiana State University
Copyright 2015, Society of Petroleum Engineers
This paper was prepared for presentation at the SPE Enhanced Oil Recovery Conference held in Kuala Lumpur, Malaysia, 11–13 August 2015.
This paper was selected for presentation by an SPE program committee following review of information contained in an abstract submitted by the author(s).
Contents of the paper have not been reviewed by the Society of Petroleum Engineers and are subject to correction by the author(s). The material does not
necessarily reflect any position of the Society of Petroleum Engineers, its officers, or members. Electronic reproduction, distribution, or storage of any part of this
paper without the written consent of the Society of Petroleum Engineers is prohibited. Permission to reproduce in print is restricted to an abstract of not more than
300 words; illustrations may not be copied. The abstract must contain conspicuous acknowledgment of SPE copyright.
Abstract
Gas injection has been widely used for IOR/EOR processes in oil reservoirs. Unlike the conventional
modes of continuous gas injection (CGI) and water –alternative gas (WAG), the Gas Assisted Gravity
Drainage (GAGD) process takes advantage of the natural segregation of reservoir fluids to provide
gravity stable oil displacement. It has been proved that GAGD Process results in better sweep efficiency
and higher microscopic displacement to recover the bypassed oil from un-swept reservoir regions.
Therefore, CO2 was considered in this research for immiscible injection in the main pay/upper sandstone
formation in South Rumaila oil field located in Iraq through the GAGD process application. This field,
with a 60-year production history, has 40 production wells and is surrounded by an infiniteacting edge
water aquifer from the east and the west flanks. Since the east flank is much less effective than the west
one, 20 injection wells have been drilled at the east flank over the last 35 years to maintain the reservoir
pressure. The formation depth is 10350 ft. sub-sea with a maximum vertical oil column of 350 ft.
The GAGD process was adopted here using compositional reservoir simulation and PVT modeling to
increase oil recovery. The GAGD process consists of placing a horizontal producer near the bottom of the
payzone and injecting gas through existing vertical wells that have been used in prior waterfloods. As the
injected gas rises to the top to form a gas zone, oil and water drain down to the horizontal producer. The
location of horizontal wells is slightly above the oil-water contact.
In the reservoir modeling, different reservoir and fluid properties have been investigated their effect on
the flow response to implement sensitivity analysis, history matching through Design of Experiments.
The operational design parameters of production/injection wells were considered to determine the
optimal future reservoir performance through the GAGD process. Among many prediction scenarios, the
GAGD process led to significant recovery incremental, especially in early future production years in
comparison with the base case of no injection and 10,000 barrels of water injection per well in the same
injection wells.
Introduction
Natural drive mechanisms are solution gas drive, water drive, gas cap drive, and gravity segregation. The
ending of the primary recovery stage is done by reaching very low reservoir pressure or high gas oil ratio
(GOR). The water flooding is the most usual secondary recovery mechanism. After that, the oil left
behind
2
SPE-174579-MS
is being produced through injection of external parameters to increase the oil recovery such as gas,
thermal, and chemical injection. These processes are called EOR.
EOR is using external materials such as water, steam, nitrogen, carbon dioxide, and polymer for
injection into the oil reservoirs in order to extract certain volumes of remaining oil after the primary and
secondary recovery stage by rock-fluid interactions through different mechanisms to increase the oil
mobility towards the producers (Tarek Ahmed, 2006). The main influential roles of EOR methods is
either reducing the oil mobility ratio or increase the capillary number (Farouq Ali and Thomas, 1996).
The gas injection processes lead to reduced interfacial tension (IFT) and decrease the oil viscosity
resulting in high oil mobility towards the wellbore areas and incremental recovery of about (5–15)% of
OIP (Lake et al., 1992). The selection criterion of gas injection type depends on whether it is miscible or
immiscible, depth, pressure, and temperature of formation, and oil compositions. Also, the selection
process considers the availability of specific gas for injection. CO2 is more favorable for injection than
other gases because of its lower minimum miscibility pressure and lower compression cost. The CO2 and
hydrocarbon gases have been used in approximately 90% of EOR projects. Selection the CO2 according
to whether it is miscible or immiscible depends on depth of the formation, oil compositions, and rock
wettability (Kuo and Elliot, 2001). Because of its higher viscosity, lower mobility ratio, closer density to
the light oil in its miscible condition, CO2 has lower injection problems than other gas types. In addition,
CO2 has higher gravity segregation in the high water saturation zones of the reservoir and this leads to
efficient oil displacement. Carbon dioxide or any other gas that is being injected for EOR operations in
three distinct modes: Continuous Gas Injection (CGI), Water Alternating Gas (WAG), and finally
through the Gas Assisted Gravity Drainage (GAGD). The conventional continuous gas injection has been
considered in the 1920’s for secondary and tertiary recovery modes to inject 100% carbon dioxide (no
water) to lower the interfacial tension between the injected gas and the reservoir oil leading to increased
displacement efficiency and achieve higher oil recovery (Kulkrani, 2003; Hinderaker et al., 1996).
Over most of the previous CGI projects, the incremental recovery was around 5% of Initial Oil in
Place (IOIP) (Kulkarni and Rao, 2004) The CGI is preferred in water-wet reservoirs within immiscible
mode (Rogers and Grigg, 2000). The Water Alternating Gas injection (WAG) process was first proposed
in 1958 to improve sweep efficiency by injecting water slugs after CO2; however, the incremental oil
recovery from 59 WAG projects was 5–10 % of the IOIP (Christensen et al., 1998). The Miscible WAG
projects have led to an average incremental recovery of 9.7% of IOIP; while 6.4% incremental recovery
was for immiscible WAG Projects (Caudle and Dyes, 1958; Christensen et al., 1998). Compared to CGI,
WAG provides better mobility control and higher CO2 exploitation efficiency (Mahmoud and Rao,
2007). According to the WAG process, WAG does not consider the gravity-stable mode and the water
saturation increases in the reservoir leading to diminished gas injectivity and increase the fluid
competition towards the wellbore. Consequently, and in order to overcome all other limitations for both
WAG and CGI, a new process of Gas Assisted Gravity Drainage (GAGD) has been recently introduced
as a potential alternative to WAG in order to take advantage of natural segregation, due to the distinct
fluid densities, of the injected gas from crude oil in the reservoir (Kulkarni and Rao, 2004; Rao et al.,
2006; Mahmoud and Rao, 2007).
Background
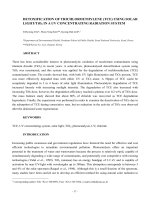
The Gas Assisted Gravity Drainage (GAGD) process has been suggested for improved oil recovery in
secondary and tertiary modes for both immiscible and miscible processes. The GAGD consists of placing
a horizontal producer at the bottom of the payzone above the oil-water contact and injecting the gas,
either immiscible or miscible, in a gravity-stable mode through the vertical wells from the top of the
formation (Rao et al., 2004). Due to the gravity segregation resulting from the different fluid densities at
the reservoir conditions, the injected gas accumulates at the top of the reservoir providing gravity stable
oil displace- ment that drains towards the horizontal producer at the bottom of the payzone (Mahmoud
and Rao, 2007). The schematic Drawing of GAGD process has been shown in Figure 1.
Figure 1—Schematic Drawing of GAGD process (Rao, 2012)
In the GAGD process, the fluids gravity segregation and the oil drainage towards the bottom of
payzone lead to better sweep efficiency and higher oil recovery. The CO 2 gas is preferred for injection
because it attains high volumetric sweep efficiency with high microscopic displacement efficiency
especially in miscible injection mode. Additionally, the high volumetric sweep efficiency assures
delaying in CO2 breakthrough to the producer (Rao et al., 2006). Delaying or eliminating the gas
breakthrough results in diminished concurrent gas-liquid flow further leading to increased gas injectivity
to maintain reservoir pressure. Since the GAGD process includes vertical gas injection with vertical oil
drain towards the horizontal producers, many factors might be affecting its performance, especially the
geological structure in addition to the petrophysical properties and rock facies.
This study examines the application of the GAGD process on the main pay of the upper sandstone
member of South Rumaila oil field, located in Iraq in order to improve oil recovery and decrease the
water cut levels which have reached 90% in many wells (Al-Mudhafer, 2010). CO2 can be obtained from
natural resources such as from the associated gas production from oil fields. Also, it can be captured from
the large stations such as the refineries and thermal power plants. As it is known, large quantities of
natural gas are being flared from South Rumaila oil field currently. However, re-injecting the produced
flue gas for EOR will also lead to reduce CO2 emissions in the atmosphere.
Field Study Description
Basrah Petroleum Company has discovered the giant South Rumaila oil field in October 1953. The
Rumaila oil field is located in the south of Iraq about 50 km west of Basrah city and about 30 km to the
west of the Zubair field (Al-Ansari, 1993). Rumaila field is about 100 km long, ranges between 12 to 14
km in width and its depth extends 3 km below sea level. Dip angles on the flanks do not exceed 3,
whereas in the crest’s parts they are about 1. The initial oil in place in Rumaila field/Main Pay is 19.5
Billion STB (Al-Mudhafer, 2010).
Geological Description
The South Rumaila oil field is composed of many oil-producing reservoirs. Zubair is one of the oil
reservoirs that are represented by Late Berriasian-Albian cycle and its sediments, which belong to Lower
Cretaceous age, rich in organic deposition and accumulation of sedimentary matter (Al-Obaidi, 2010).
The Zubair formation thickness ranges between 280 – 400 m. it’s thickness increases towards the northeast and decreases towards the south-west (Al-Obaidi, 2009). Zubair formation encompasses five
members based on sand to shale ratio and these have been named from top to bottom: Upper shale
member, Upper sandstone member (main pay) where the GAGD process will be applied, Middle shale
member, Lower sand member, and Lower shale member (Al-Ansari, 1993).
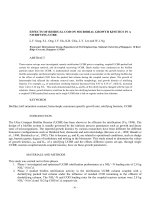
The upper sandstone member of the Zubair formation is the main pay zone of South Rumaila Oil Field
(Mohammed et al., 2010). The main pay comprises five dominated sandstone units, separated by two
shale units. The shale units act as good barriers impeding vertical migration of the reservoir fluids except
in certain areas where they disappear. The five unit zones have been denoted from top to bottom as AB,
DJ1, DJ2, LN1, and LN2 and there are two shale layers C & K between AB and DJ1 & DJ2 and LN1
(Mohammed et. al., 2010). More details are shown in Figure 2.
Figure 2—Geological Column of the Main Pay/ South Rumaila Oil Field (Mohammed et al.,
2010)
Sector Study Description
The South Rumaila Field is divided into four production sectors. From the north to the south, the sectors
are Qurainat, Shamiya, Rumaila, and Janubia. The choice of this sector was made mainly because it has
the least lack of data and it is the largest sector in which the production and injection operations are
carried out. The sector area is more than a third of the entire field. The reservoir has five layers with
about 80 m total thickness.
Production and Injection Schedules
The primary production started in this field in 1954 and the water injection was started in 1980s. During
this period, 40 production wells were opened to flow in the simulated domain. There is an infinite acting
edge-aquifer located at the boundary of the reservoir. For more than two decades, the natural depletion
and water drive have been the only production mechanisms (Al-Mudhafer, 2013). Twenty injection wells
have been drilled only at the east flank in order to maintain the huge aquifer support from the west flank,
which
reaches to 20 times the influx from the east flank (Kabir, 2004). The production of some layers was
ceased because of the higher water cuts of above 85% (Al-Mudhafer et. al, 2010).
The 20 injection wells are primarily arranged in two parallel downdip rows. The inner row of injectors
is completed only in the LN interval, while the most downdip row of injectors is completed only in the
AB/DJ interval. The cumulative water injection through 2004 was approximately 1.1 billion barrels.
Injection rates have varied widely with a maximum of nearly 426,000 BPD for two months in 1988.
Artificial lift has been installed in the main pay wells recently, which has been suggested to handle the
wells being incapable of flowing to surface after water cuts reach approximately 80%. The estimated
original oil in place (OOIP) for the main pay is 19.5 billion barrels. The approximate current recovery
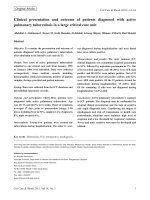
factor from primary deletion and waterflood (AL-Mudhafer, 2013) is 50%. The peak oil production rate
of 600,000 BPD occurred in May 1979 for the sector under study. However, the peak oil production for
the entire field was approximately 1.25 MMBPD during the same period. Figure 3 shows the production
history for the field sector.
Figure 3—Field Production History
Boundary conditions treatment
There are two types of boundary conditions that are encountered in the reservoir under study, a no-flow
boundary and an aquifer. The northern and southern boundaries are assumed to be of no-flow. This
assumption may be considered realistic since balanced production and injection rates are adopted for the
reservoir and the isobaric lines crossing the northern streamlines are perpendicular to these boundaries.
Thus, the direction of flow will be parallel to northern and southern boundaries. The flow boundaries at
the east and west are natural water drive boundaries (Al-Mudhafer et al., 2010).
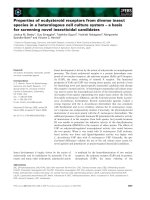
Compositional Reservoir Modelling
An EOS-compositional reservoir model was developed to evaluate the reservoir through GAGD process
implementation and predict its future performance. The constructed grid in the current study includes the
reservoir and parts of aquifer along the eastern and western flanks. The grid dimensions for this study are
3300 grids: 30 grids in I-direction, 22 grids in J-direction, and 5 grids in K-direction as illustrated in
Figure
4. The dimensions of grid are constant: 500 m × 433 m. The gridding system includes the reservoir and
the infinite-acting aquifer (edge-water drive).
Figure 4 —Well Locations and Grid System of Reservoir Model
For field-scale reservoir modeling, there are some factors affecting the grid size selection such as Cost
and time available to conduct the study and the processing speed of the CPU. Since the field has 60 years
of production history with 40 producers and 20 injectors, it requires much time for running the model.
The time step sizes normally used are in the range of 1– 6 months; therefore, 1-month time step has been
considered because of the monthly production and injection rates. A preliminary evaluation of GAGD
process in the South Rumaila oil field was conducted by running the compositional reservoir model for
12 years of future production after installing a series of 10 horizontal producers at the crest of the
reservoir. The same future prediction period was considered for the base case of no-injection and 10,000
barrels water per day per each of the existing vertical injection wells (Al-Mudhafar and Al-Khazraji,
2014). GAGD process has led to significant incremental oil recovery (1.4 Billions STB and 1.1 Billions
STB, respectively in comparison to primary production and water injection cases as shown in Figure 5.
Figure 5—Comparison of GAGD Process with primary depletion & Water Injection Scenarios
Design of Experiments
The Design of Experiments (DoE) is a statistical tool that is being used for the purpose of identifying the
most sensitive factors that affect the response through sensitivity analysis procedure. Furthermore, DoE
helps to obtain the most likely scenario that achieves optimal response to a given recovery process.
Meanwhile, the DoE approach has the possibility to evaluate the interaction terms between the selected
factors to find out their extent of influence on the process performance (Lazic, 2006).
To create a population of observations, either binary or decimal sampling techniques should be
considered.. Usually, full factorial design requires many reservoir simulation runs for identifying the
most significant modeling parameters impacting the response especially when there are more than five
factors to test (Box, et al., 2005). Furthermore, it is hard to adopt the conventional design of experiments
approaches to handle more than three levels for each factor as it leads to very large number of
experiments (Montgomery, 1997; Montgomery, et al., 2003). Consequently and in order to capture many
levels of variation for each factors, Latin Hypercube Sampling approach (LHS) has been suggested to
provide more uniform and low discrepancy space-filling design. Latin hypercube sampling attempts to
keep the sampling data distribution uniform over the space with less random distribution especially in
high dimension numerical simulation as shown in Figure 6. LHS is a modern sampling technique that can
handle any number of parameters with mixing levels (Kalla and White, 2007). LHS was considered in
this study for GAGD Sensitivity Analysis, History Matching, and Recovery Optimization.
Figure 6 —Latin Hypercube Sampling of the Reservoir Simulation Runs
Sensitivity Analysis
The prior step for conducting history matching and recovery optimization is Sensitivity Analysis (SA).
The main purpose of SA is to identify the most influential factors affecting the flow response in order to
reduce the running time by reducing the total of number of computer experiments required to attain
history matching. The response that was considered for Sensitivity Analysis, History Matching, and
Recovery Optimization is the cumulative oil production. Meanwhile, 13 geological uncertain factors that
were tested for SA: permeability and porosity of the five reservoir layers, vertical to horizontal
permeability ratio (Kv/Kh), the rock compressibility, and the aquifer size. Moreover, the controllable
operational factors regarding CO2 injection and oil production constraints were also considered. All these
factors were combined through multilevel selection of Latin Hypercube Sampling. The cumulative oil
production was obtained from the compositional reservoir model given all the generated simulation runs
of LHS as depicted in Figure 7. Figure 8 represents the basic diagnostic plots of the linear model fitting
of the generated runs and their oil production outcomes. Normal q-q, and residual analysis have indicated
good model fitting to be considered as an accurate modeling to represent the process validation and
precisely conclude the most influential factors affecting the GAGD process. After building and validating
the statistical linear model of the these factors given the obtained data, the SA results showed that
porosity and horizontal permeability in addition to the operational design factors are the most influential
factors affecting the flow response through the GAGD process application as illustrated in Figure 9. It is
not surprised that Kv/Kh ratio did not come out to be important because the reservoir model was not
incorporated with the lithology modelling, especially the reservoir has discontinuous shale distribution
between the first and second & third and fourth layers (AL-Ansari, 1993). Figure 10 shows the effect of
Kv/Kh on the field cumulative oil production and field oil production rate for the entire prediction period.
The figure supports the outcome of limited effect of Kv/Kh ratio on the field flow response.
Figure 7—Sensitivity Analysis of the Reservoir Flow Response
Figure 8 —Basic Diagnostic Plots of the Reduced Linear Model
Figure 9 —Most Influential Factors Affecting the Flow Response in GAGD Process
Figure 10 —The effect of Kv/Kh ratio on the Flow Response in GAGD Process
History Matching
History matching can be considered as inverse problem to minimize the error between the measured and
calculated response such as the oil production rate and cumulative oil production. Design of Experiments
has been used recently as an effective way to find out the prominent factors affecting the reservoir
performance (Al-Mudhafar and Zein Al-Abideen, 2014). DoE has been used to facilitate assigning the
most sensitive reservoir parameters for history matching. In order to test and determine the impact of the
reservoir properties on the response variable, Latin Hypercube Sampling (LHS), a statistical tool, has
been used here to create sample of plausible collections of parameters for big levels and factors. (Box
et.al, 2005; Montgomery, 1997). Latin Hypercube Sampling Design (LHS) was adopted to handle the
sensi- tivity of 13 factors that might affect the cumulative oil production in the field. It provides a
sampling way that ensures treatments of three different blocking variables (cube) at each level of the
factors (Lazic, 2006).
These factors are the porosity and permeability for five layers, vertical to horizontal permeability ratio
(Kv/Kh), rock compressibility, and aquifer radius (Al-Mudhafar and Zein Al-Abideen, 2014). Carrying
out the LHS design requires running the thermodynamic reservoir model to provide 128 experiments that
represent high discrepancy among the factors’ levels that should be updated. Statistical linear regression
modeling has been conducted to study the effect of the assigned factor on the response. T-test and
ANOVA have been adopted to validate the model and get the reduced linear models after elimination of
the non-influential factors (Montgomery, 2003).
Figure 11 & 12 show the results of each experiment on the cumulative oil production and field
production rate, respectively. Need a statement here for what these figures indicate. Figure 13 shows the
optimal scenario that has led to minimum error between the measured and calculated cumulative oil
production and flow rate that reflects the best history matching.
Figure 11—Designed Experiments Matching Of Cumulative Oil Production
Figure 12—Designed Experiments Matching Of Field Oil Production Rate
Figure 13—Best Designed Experiment Matching Field Oil Production
GAGD Process Optimization
The Latin Hypercube Sampling approach (LHS) was also considered to determine the optimal future
reservoir performance through the GAGD process. LHS has generated 256 computer runs in multi levels
of the design variables to capture more uniform and low discrepancy sampling of the solution space. The
decision variables that were considered for the process optimization are bottom hole gas injection rate &
bottom hole injection pressure in the injection wells and minimum bottom hole pressure, maximum
surface oil production rate, and skin factor in the production wells.
The objective functions in the optimization process were maximum field cumulative oil production
and field oil production rate during 12 years of future production as depicted in Figure 14. The multiple
simulation runs of GAGD process optimization procedure in addition to the optimal scenario were shown
in Figure 15.
Figure 14 —Optimal Global Flow Response through GAGD Process Using LHS
Figure 15—Cumulative Oil Production & Field Oil Rate through GAGD Process LHS Optimization
Figure 16 shows the most frequent parameters levels that were included in the optimization procedure
given the different simulation runs. Figure 17 shows the optimal GAGD scenario with respect to
cumulative oil production, field oil production rate in comparison with the base GAGD process case.
Figure 16 —Frequency Diagram of the Optimization Constraints
Figure 17—Base Case and Optimal GAGD Process Performance Comparison
Summary and Conclusions
The compositional reservoir model for a heterogeneous field was considered for GAGD process implementation to determine preliminary results of the reservoir performance with respect to sensitivity
analysis and optimization:
1. The Gas Assisted Gravity Drainage (GAGD) process has resulted in significant increase in the oil
production rate of 1.5 Million STB/DAY (Peak in the first five years of the prediction period) and
the cumulative oil production is 5.6 Billions STB over the future period.
2. A comparison has been made between GAGD process, optimized GAGD, water injection, and no
injection in the prediction period of production.
3. The Latin Hypercube Sampling technique has been considered for the optimization process to get
low discrepancy space-filling design of the population search environment for the optimization.
4. In 12 years prediction, the increment in cumulative oil recovery by Water Injection, GAGD Base
Case, and Optimized GAGD scenarios over the No-Injection case are 0.3E+09, 1.4E+09, and
2.1E+09 STB, respectively.
5. In the sensitivity analysis, the reservoir permeability and porosity in addition to the maximum oil
production and minimum bottom hole pressure constraints are the most influential factors
affecting the GAGD process effectiveness in the simplified model.
6. The anisotropy ratio (Kv/Kh) has limited effect on the reservoir flow response because the
simplified model does not consider a detailed Lithofacies modeling as it neglected the shale
layers.
7. Among the operational design parameters, the minimum bottom hole pressure in the producers
and maximum bottom hole pressure in the injector, maximum bottom hole gas injection rate,
maxi- mum stock tank oil barrel, and maximum skin factor values are the most influential and
most frequent factors that affect the GAGD process performance and led to attain the optimal
solution.
8. The experimental design-based optimization approach has led to find out a significant higher oil
recovery through GAGD process than all the other cases.
Acknowledgment
The authors thank the Computer Modeling Group, Ltd for providing help with simulation software,
Fulbright-Institute of International Education (IIE) for 3-years PhD scholarship, and financial support
through research grants from US-DOE, Chevron Innovative Research Fund, and LSU-LIFT fund.
References
Ahmed, T. H. Reservoir Engineering Handbook. Gulf Professional Publishing (2006).
Farouq Ali, S. M., and Thomas, S. The promise and problems of enhanced oil recovery methods.
Journal of Canadian Petroleum Technology. 35(1996) (7): 5763.
Lake L W., Schmidt R. L., and Venuto P. B. A Niche for Enhanced Oil Recovery in the 1990s,
Petroleum Engineer International: (1992) 5561.
Kuo, J. C., Eliot, D. Starts up for Cantarell reservoir pressure maintenance. Oil Gas J. 99(2001) (11).
Kulkarni, M. M., Immiscible and Miscible Gas-Oil Displacements in Porous Media, M.S. Thesis, The
Craft & Hawkins Department of Petroleum Engineering, Louisiana State University and A & M
College, Baton Rouge, LA (2003).
Hinderaker, L., R. H. Utseth, O. S. Hustad, B. A. Kvanvik, and J. E. Paulsen. RUTH A
comprehensive Norwegian R&D program on IOR, SPE 36844, Presented at the SPE European
Petroleum Conference, Milan, Italy (22–24 October 1996).
Kulkarni, M. M., and D. N. Rao. Is Gravity Drainage an Effective Alternative to WAG?, AIChE 2004
Annual Meeting, Austin, TX (7–12 November 2004).
John D. Rogers and R. B. Grigg, A Literature Analysis of the WAG Injectivity Abnormalities in the
CO2 Process SPE paper 59329 presented at the 2000 SPE/DOE Improved Oil Recovery Symposium, Tulsa, Oklahoma (3–5 April 2000).
Christensen, J. R., E. H. Stenby, and A. Skauge. Review of the WAG field experience, SPE 71203,
revised paper 39883, presented at the 1998 SPE International petroleum conference and
exhibition of Mexico, Villhermosa (3–5 March 1998).
Caudle, B.H. and A. B. Dyes. Improving Miscible Displacement by Gas-Water Injection,
Transactions of the American Institute of Mining, Metallurgical, and Petroleum Engineering, 213
(1958), pp. 281–284.
Rao, D. N., et al. Development and Optimization of Gas Assisted Gravity Drainage (GAGD) process
for improved light oil recovery. United States Department of Energy Research Proposal, Report
Number 15323R15, Final Technical Report, prepared for National Energy Technology
Laboratory, United States Department of Energy, 2006.
Kulkarni, M. M. and D. N. Rao. Experimental Investigation of Miscible and Immiscible WaterAlternating-Gas (WAG) Process Performance, Journal of Petroleum Science and Engineering, 48
(2005): 1–20.
Kulkarni, M. M. and D. N. Rao. Characterization of Operative Mechanisms in Gravity Drainage Field
Projects Through Dimensional Analysis. SPE 103230, presented at the SPE Annual Technical
Conference and Exhibition, San Antonio, Texas, USA (24 –27 September 2006).
Mahmoud, T. N. and D. N. Rao. Range of Operability of Gas-Assisted Gravity Drainage Process.
Paper SPE 113474, presented at the SPE Symposium on Improved Oil Recovery, Tulsa, Oklahoma, USA (20 –23 April 2008).
Rao, D. N. Gas-Assisted Gravity Drainage Process for Improved Oil Recovery. United States patent
8,215,392 B2, July 2012.
Al-Mudhafer, W. J., M. S. Al Jawad, and D. A. Al-Shamaa: “Using Optimization Techniques for
Determining Optimal Locations of Additional Oil Wells in South Rumaila Oil Field,” paper SPE
130054 presented at the CPS/SPE International Oil & Gas Conference and Exhibition, Beijing,
China (8 –10 June 2010).
Al-Ansari, R., The petroleum Geology of the Upper sandstone Member of the Zubair Formation in
the Rumaila South. Geological Study, Ministry of Oil, Baghdad, Iraq (Jan. 1993).
Kabir, C. S. et al., Lessons Learned From Energy Models: Iraq’s South Rumaila Case Study. Paper
SPE 105131, presented at the SPE Middle East Oil and Gas Show & Conference, Manama,
Bahrain (11–14 March 2007).
Al-Mudhafer, W. J. A Comparative Thermal IOR Simulation Study with Experimental Design for
Optimal Future Performance of a Heterogeneous Light Oil Reservoir. Paper SPE 165345
presented at the SPE Western Regional & AAPG Pacific Section Meeting, Joint Technical
Conference, Monterey, California, USA (19 –25 April 2013).
Al-Obaidi, R. Y. Identification of Palynozones and Age Evaluation of Zubair Formation, Southern
Iraq. Journal of Al-Nahrain University 12.3(2009): 16 –22.
Al-Mudhafer, W. J. A Practical Economic Optimization Approach with Reservoir Flow Simulation
for Infill Drilling in A Mature Oil Field. Paper SPE 164612, presented at the North Africa
Technical Conference & Exhibition held in Cairo, Egypt (15–17 April 2013).
Al-Mudhafar, W. J. M. and M. J. Zein Al-Abideen. Experimental Design for Sensitivity Analysis of
Reservoir Performance: A Case Study. Extended Abstract presented at the 6th Saint Petersburg
International Conference & Exhibition, Saint Petersburg, Russia (7–10 April 2014).
White, C. D., B. J. Willis, K. Narayanan, and S. P. Dutton. Identifying and Estimating Significant
Geologic Parameters with Experimental Design. SPEJ (September 2001) 311–324.
Al-Mudhafar, W. J. M., D. N. Rao, and A. A. A1 Isawi. Efficient Experimental Design for Optimal
Oil Recovery through Field Scale - Gas Assisted Gravity Drainage (GAGD) Process. Extended
Abstract presented at the 77th EAGE Conference and Exhibition, Madrid, Spain (1– 4 June 2015).
Chen MH, L. Huang, J. G. Ibrahim, and S. Kim. Bayesian variable selection and computation for
generalized linear models with conjugate priors. Bayesian Anal 3: (2008) 58514.
Al-Mudhafer, W. J., & A. J. Al-Khazraji. Efficient Reservoir Modeling-Statistical Approach for
Evaluation and Development of Future Waterdrive Undersaturated Oil Reservoir Performance,”
IPTC 18102 presented at the International Petroleum Technology Conference, Kuala Lumpur,
Malaysia (10 –12 December 2014).