Economic evaluation within the scope of the field development and application of the gas assisted gravity drainage (GAGD) process in an actual northern louisiana field
Bạn đang xem bản rút gọn của tài liệu. Xem và tải ngay bản đầy đủ của tài liệu tại đây (1.04 MB, 16 trang )
SPE
SPE 129723
Economic Evaluation within the Scope of the Field Development and
Application of the Gas-Assisted Gravity Drainage (GAGD) Process in an
Actual Northern Louisiana Field
Paidin, W.R., Mwangi, P., and Rao, D.N., Louisiana State University
Copyright 2010, Society of Petroleum Engineers
This paper was prepared for presentation at the SPE Hydrocarbon Economics and Evaluation Symposium held in Dallas, Texas, USA, 8–9 March 2010.
This paper was selected for presentation by an SPE program committee following review of information contained in an abstract submitted by the author(s). Contents of the paper have not
been reviewed by the Society of Petroleum Engineers and are subject to correction by the author(s). The material does not necessarily reflect any position of the Society of Petroleum
Engineers, its officers, or members. Electronic reproduction, distribution, or storage of any part of this paper without the written consent of the Society of Petroleum Engineers is prohibited.
Permission to reproduce in print is restricted to an abstract of not more than 300 words; illustrations may not be copied. The abstract must contain conspicuous acknowledgment of SPE
copyright.
Abstract
The GAGD process was developed as an enhanced oil recovery (EOR) method that takes advantage of the naturally occurring
gravity segregation of injected gas from crude oil, common in such processes as WAG. GAGD consists of placing horizontal
producer wells near the bottom of the reservoir and injecting gas using (existing) vertical wells. It is proposed that the injected
gas will rise to the top to form a gas cap while oil and water drain down to the horizontal producers. The work so far
completed as part of the development of GAGD has encompassed a thorough literature review on the underlying mechanisms,
selected scaled visual physical model experiments to confirm those mechanisms, and numerical simulations using commercial
software to optimize the production configuration.
Quá trình GAGD đã được phát triển như là một phương pháp hồi dầu tăng cường (EOR) mà lợi dụng của lực hấp dẫn tự nhiên
phân biệt các khí tiêm từ dầu thô, phổ biến trong các quá trình như WAG. GAGD gồm đặt giếng sản xuất ngang gần đáy của
hồ chứa và bơm khí sử dụng giếng khoan thẳng đứng (hiện có). Đó là đề xuất rằng khí tiêm sẽ tăng lên trên cùng để tạo thành
một nắp xăng trong khi giá dầu và nước cống xuống để các nhà sản xuất ngang. Công việc cho đến nay đã hoàn thành như là
một phần của sự phát triển của GAGD đã bao phủ một tài liệu nghiên cứu kỹ lưỡng về cơ chế cơ bản, lựa chọn các thí nghiệm
mô hình vật lý hình ảnh thu nhỏ để xác nhận những cơ chế, mô phỏng số bằng cách sử dụng các phần mềm thương mại để tối
ưu hóa cấu hình sản xuất.
The final stage in the development of the GAGD process is the implementation in an actual field. To this end a
detailed cash flow analysis will be performed in which selected economic indicators, such as the net present value, payout
time, profit to investment ratio and rate of return, will be calculated for a specific Northern Louisiana field and given operating
conditions. The operating conditions and resulting production profile have been optimized using numerical simulation and
were used in the cash flow analysis. For the other input parameters, such as oil prices, capital and operational expenditures,
and tax rate, the average values for Northern Louisiana will be used. The uncertainty in these parameters will be captured in a
sensitivity study where their effect on the economic performance will be investigated.
Giai đoạn cuối cùng trong sự phát triển của quá trình GAGD là việc thực hiện ở một lĩnh vực thực tế. Để kết thúc này
phân tích dòng tiền chi tiết sẽ được thực hiện trong đó lựa chọn các chỉ số kinh tế, chẳng hạn như giá trị ròng hiện tại, thời gian
thanh toán, lợi nhuận với tỷ lệ đầu tư và tỉ suất lợi nhuận sẽ được tính cho một trường Bắc Louisiana cụ thể và điều kiện vận
hành nhất định. Các hoạt động điều kiện và kết quả hồ sơ cá nhân sản xuất đã được tối ưu hóa bằng cách sử dụng mô phỏng số
và đã được sử dụng trong phân tích dòng tiền. Đối với các thông số đầu vào khác như giá dầu, vốn và chi phí hoạt động, và
mức thuế suất thuế giá trị trung bình cho Bắc Louisiana sẽ được sử dụng. Sự không chắc chắn trong các thông số này sẽ được
bắt trong một nghiên cứu nhạy cảm mà ảnh hưởng của họ trên các hoạt động kinh tế sẽ được điều tra.
Introduction
It has been stated in a 2006 DOE basin analysis report that the Onshore Gulf Coast oil producing region is a mature petroleum
province and that production is in decline. The Onshore Gulf Coast region includes Alabama, Florida, Louisiana and
Mississippi, a region that at one time was one of the largest onshore petroleum producing regions. According to the same
report the region had an original hydrocarbon endowment of over 44 billion barrels of which nearly 38% will be recovered
using conventional oil recovery practices. That means that nearly 28 billion barrels of oil will be left behind in the ground or
stranded, thus forming a sizable target for the application of enhanced oil recovery (EOR) methods. The report has further
identified about 1.8 to 4.1 billion barrels that could technically be recovered from a total of 159 reservoirs, or about 60% of the
total number of reservoirs in the Onshore Gulf Coast region, through the application of a CO 2-based EOR method. The size
and distribution of the Onshore Gulf Coast region’s oil reservoirs covered in the report and the oil resources that might be
technically recoverable using CO 2-EOR are tabulated in Table 1 and 2 (from the 2006 DOE basin analysis report). The
reservoirs were screened based on five important criteria, namely reservoir depth, oil gravity, reservoir pressure, reservoir
temperature, and oil composition. These parameters were used to estimate the minimum miscibility pressure in order for the
1
reservoir to be considered for a miscible CO 2-EOR process while those that did not meet the minimum miscibility pressure
standard were considered for an immiscible CO2-EOR application.
2
SPE
Nó đã được nêu trong một lưu vực DOE phân tích báo cáo năm 2006 rằng các khu vực sản xuất dầu trên đất liền bờ vịnh là
một tỉnh dầu mỏ trưởng thành và sản xuất mà đang suy giảm. Các khu vực đất liền bờ biển vùng Vịnh bao gồm Alabama,
Florida, Louisiana và Mississippi, một khu vực mà có một lúc là một trong những vùng sản xuất dầu khí trên đất liền lớn nhất.
Theo báo cáo cùng một khu vực có vốn cung cấp hydrocarbon ban đầu dài hơn 44 tỷ thùng trong đó gần 38% sẽ được phục hồi
bằng cách sử dụng lệ thu hồi dầu thông thường. Điều đó có nghĩa là gần 28 tỷ thùng dầu sẽ bị bỏ lại đằng sau trong đất hoặc bị
mắc kẹt, do đó tạo thành một mục tiêu khá lớn cho việc áp dụng hồi dầu tăng cường (EOR) phương pháp. Bản báo cáo đã xác
định thêm về 1,8-4100000000 thùng mà kỹ thuật có thể được phục hồi từ tổng số 159 hồ chứa nước, chiếm khoảng 60% tổng
số các hồ chứa trong khu vực trên đất liền Gulf Coast, thông qua việc áp dụng một phương pháp EOR CO2 dựa trên . Và sự
phân bố của các hồ chứa dầu của khu vực đất liền bờ biển vùng Vịnh bao gồm trong báo cáo và các nguồn tài nguyên dầu mà
có thể là kỹ thuật thu hồi sử dụng CO2-EOR được trình bày trong Bảng 1 và 2 (từ báo cáo phân tích lưu vực DOE 2006). Các
hồ chứa đã được sàng lọc dựa trên năm tiêu chí quan trọng, cụ thể là hồ sâu, trọng lực dầu, áp suất vỉa, nhiệt độ hồ chứa, và
thành phần dầu. Những thông số được sử dụng để ước tính áp lực trộn lẫn tối thiểu để cho các hồ chứa để được xem xét cho
một quá trình CO2-EOR thể trộn trong khi những người không đáp ứng các tiêu chuẩn áp lực trộn lẫn tối thiểu đã được xem
xét một ứng dụng CO2-EOR immiscible.
In the current study, an economic analysis will be executed concerning the application of a selected CO 2-EOR
method in an actual Northern Louisiana field, which will be identified in the remainder of the report as the BH field. The CO 2EOR process in question is the Gas-Assisted Gravity Drainage (GAGD) process which was developed at and patented by the
Louisiana State University (LSU). Recently, the process was picked up by a small independent oil company out of Alabama
for application in one of their assets located in Northeastern Louisiana. They had decided early on in the project’s feasibility
study to only implement the GAGD process in one part, or pod, of the reservoir which had been waterflooded prior to
abandonment. Currently, the project is in the latter stages of facilities development and will hopefully prove the success of
GAGD/CO2-EOR application. For the development of the cost model various vendors, CO 2-suppliers and independent
operators were contacted to come up with an as close to complete economic cost picture that would be applicable to a small
EOR project in Northern Louisiana. The economic analysis was done as a sensitivity study using Crystal Ball by assigning a
probabilistic model to those variables that were thought to have a great deal of uncertainty inherent in them and influence on
the profitability of the project, such as the oil price, the royalty rate, the production scheme, the expensed capital investments
and the cost of acquiring CO2.
Trong nghiên cứu, phân tích kinh tế sẽ được thực hiện liên quan đến việc áp dụng một phương pháp CO2-EOR chọn
trong một lĩnh vực Bắc Louisiana thực tế, mà sẽ được xác định trong phần còn lại của báo cáo là lĩnh vực BH. Quá trình CO2
EOR trong câu hỏi là Gas-Assisted Trọng lực thoát nước (GAGD) quá trình đó được phát triển tại và cấp bằng sáng chế của
Đại học bang Louisiana (LSU). Gần đây, quá trình này đã được chọn của một công ty dầu nhỏ độc lập ra khỏi Alabama để áp
dụng vào một trong những tài sản của họ nằm ở Đông Bắc Louisiana. Họ đã quyết định sớm trong nghiên cứu tính khả thi của
dự án chỉ thực hiện quá trình GAGD trong một phần, hoặc pod, các hồ chứa đã được waterflooded trước khi bị bỏ rơi. Hiện
nay, dự án đang trong giai đoạn sau của sự phát triển cơ sở vật chất và hy vọng sẽ chứng minh sự thành công của ứng dụng
GAGD / CO2-EOR. Đối với sự phát triển của các mô hình chi phí nhà cung cấp khác nhau, CO2-nhà cung cấp và các nhà khai
thác độc lập được liên hệ để đến với một càng gần hoàn thành bức tranh chi phí kinh tế mà có thể áp dụng cho một dự án EOR
nhỏ ở phía Bắc Louisiana. Phân tích kinh tế đã được thực hiện như một nghiên cứu nhạy cảm sử dụng Crystal Ball bằng cách
gán một mô hình xác suất để các biến được cho là có rất nhiều sự không chắc chắn vốn có trong họ và ảnh hưởng đến lợi
nhuận của các dự án, chẳng hạn như giá dầu, tiền bản quyền tỷ lệ, phương án sản xuất, các khoản đầu tư vốn vào chi phí và chi
phí mua CO2.
The Gas-Assisted Gravity Drainage (GAGD) Process
The development of the GAGD process at LSU (Rao et al., 2004) resulted in a patent application on the process and a field
implementation by an independent oil company. The design of the GAGD process was meant to overcome the shortcomings of
the traditionally implemented Water Alternating Gas (WAG) process. In the WAG process a water slug is injected to improve
the sweep efficiency of gas injection by using water to control the mobility of the injected gas and thus the displacement, and
to stabilize the front as stated by Christensen et al. (2001). In their 2001 review of 59 field applications of the WAG process
they have identified an average incremental increase of 5-10% with 14 of the fields reported having problems with gravity
overriding. This is caused by the difference in density between the injected and reservoir fluids causing the gas to
preferentially rise to the top and the water to sink towards the bottom of the payzone as is illustrated in Figure 2, instead of the
ideally envisioned stabilized piston-like displacement (Figure 1). The GAGD process uses the natural tendency of the gas to
rise to the top and the descent of the injected water to the bottom by injecting gas into the reservoir using (existing) vertical
wells and producing fluids from horizontal wells placed near the bottom of the payzone near and above the oil-water contact
(Figure 3). As the gas rises it forms a gas cap at the top of the reservoir thus displacing and draining oil and water to the
horizontal producers at the bottom. The use of horizontal producers increases the areal exposure to the reservoir thus leading to
an increased well productivity.
Sự phát triển của quá trình GAGD tại LSU (Rao et al., 2004) dẫn đến một ứng dụng bằng sáng chế về quy trình và thực hiện
một lĩnh vực của một công ty dầu độc lập. Các thiết kế của quá trình GAGD đã có nghĩa là để khắc phục những thiếu sót trong
thực hiện truyền thống nước Xen kẽ Gas (WAG) quá trình. Trong quá trình WAG sên nước được bơm để nâng cao hiệu quả
quét của phun khí bằng cách sử dụng nước để kiểm soát sự di chuyển của khí tiêm và do đó việc di dời, và để ổn định trước
như đã nói bởi Christensen et al. (2001). Năm 2001 đánh giá của họ về 59 ứng dụng thực tế quy trình WAG họ đã xác định
một sự gia tăng gia tăng trung bình 5-10% với 14 của các trường báo cáo có vấn đề với trọng lực trọng. Điều này là do sự khác
biệt về mật độ giữa các tiêm và các chất lỏng chứa gây ra khí để ưu tiên tăng lên trên cùng và các nước chìm phía dưới cùng
của payzone như được minh họa trong hình 2, thay vì các lý tưởng hình dung ổn định piston giống chuyển (Hình 1). Quá trình
GAGD sử dụng các xu hướng tự nhiên của khí tăng lên đến đỉnh và các hậu duệ của nước bơm vào phía dưới bằng cách tiêm
gas vào bồn chứa dùng nước giếng thẳng đứng (hiện có) và sản xuất chất lỏng từ giếng ngang đặt gần dưới cùng của payzone
gần và trên các tiếp xúc dầu-nước (Hình 3). Khi khí mọc, nó tạo thành một nắp xăng ở đầu hồ chứa do đó thay và xả dầu và
nước cho người sản xuất ngang ở phía dưới. Việc sử dụng của nhà sản xuất ngang làm tăng tiếp xúc với dày đặc các hồ chứa
do đó dẫn SPE
đến năng suất cũng tăng lên.
The Field Application of GAGD
The process of implementing the GAGD process in the field commenced in the second half of 2005 with a screening of two
possible field options. Out of this screening the BH field emerged as the most likely candidate for GAGD application. It is a
previously waterflooded reservoir that had been shut in since 1972. The BH field is located in the Northeastern part of
Louisiana and is a compartmentalized sandstone reservoir. It consists of four main units, or pods, of which one was selected
for initial implementation of GAGD based on favorable geological criteria. After the end of waterflooding it was estimated
that the remaining reserves totaled about 4.7 million stocktank barrels. The optimization process was divided in the following
parts:
Quá trình thực hiện quá trình GAGD trong lĩnh vực này bắt đầu trong nửa thứ hai của năm 2005 với một buổi chiếu hai lựa
chọn lĩnh vực có thể. Trong số này sàng lọc các lĩnh vực BH nổi lên là ứng cử viên sáng giá nhất cho ứng dụng GAGD. Nó là
một hồ chứa waterflooded trước đó đã phải đóng cửa trong từ năm 1972. Các lĩnh vực BH nằm ở phía Đông Bắc của
Louisiana và là một sa thạch chứa compartmentalized. Nó bao gồm bốn đơn vị chính, hoặc vỏ quả, trong đó một đã được chọn
để thực hiện ban đầu của GAGD dựa trên các tiêu chí địa chất thuận lợi. Sau khi kết thúc waterflooding ước tính có trữ lượng
còn lại đạt khoảng 4,7 triệu thùng stocktank. Quá trình tối ưu hóa được chia thành các phần sau đây:
•
Reservoir characterization – the reservoir characterization phase consisted of building a reservoir model based on the
available geological data, such as well logs and reservoir maps. The appropriate fluid behavior model was also based on as
much actual reservoir data as was available at the time. This data consisted of actual reservoir fluids, oil and brine, and historical
production data that was used for history matching purposes after which a forecast of the surface oil production rate was
achieved using different CO2 injection rates and well configurations.( • Hồ chứa đặc tính - giai đoạn đặc tính hồ chứa gồm việc
xây dựng một mô hình hồ chứa dựa trên các dữ liệu địa chất có sẵn, chẳng hạn như các bản ghi tốt và bản đồ chứa. Mô hình
hành vi chất lỏng thích hợp cũng được dựa trên dữ liệu chứa càng nhiều thực tế là đã có sẵn tại thời điểm đó. Những thông tin
này bao gồm các chất lỏng thực tế hồ chứa, dầu và nước muối, và các dữ liệu sản xuất lịch sử đã được sử dụng cho mục đích
lịch sử phù hợp sau đó một dự báo về tốc độ sản xuất dầu bề mặt đã đạt được bằng cách sử dụng tỷ lệ tiêm CO2 và cấu hình
cũng khác nhau.)
• Optimization of production design – in the optimization stage of the production design various operational parameters
were changed to assess their effect on the ultimate recovery. Among those parameters were the number of
injector/producer well pairs, the location of the well pairs, the location of the horizontal producers above the oil-water
contact, the CO2 injection rates, the production rates and the lag time in between the start of injection and production.( •
Tối ưu hóa thiết kế sản xuất - trong giai đoạn tối ưu hóa sản xuất thiết kế các thông số hoạt động khác nhau
đã được thay đổi để đánh giá hiệu quả của họ vào sự hồi phục cuối cùng. Trong số những người tham số là số cặp cũng
tiêm / sản xuất, vị trí của các cặp tốt, vị trí của các nhà sản xuất ngang phía trên tiếp xúc dầu-nước, tỷ lệ tiêm CO2, tỷ lệ
sản xuất và thời gian trễ giữa đầu tiêm và sản xuất.)
As a result of the production design optimization it was decided that two injector/producer well pairs would be used
in the selected locations as is illustrated in Figure 4. Both injection wells, G and G1, had a total vertical depth of 8700 ft, while
the horizontal wells’ vertical section also reached a depth of 8700 ft. The horizontal sections of the production wells, H and
H1, each had a length of about 1200 ft. The optimal combination of CO 2 injection rate and surface production rate can be
deduced from Table 3 and Figure 5 which show an overview of the effect of varying both parameters on the incremental oil
recovery over the waterflood recovery baseline, expressed as %OOIP (percentage of original oil in place) and %ROIP
(percentage of residual oil in place, i.e. left behind in the reservoir after waterflood). In the field application of GAGD there
are many possible sources for acquiring the required CO 2. In this study it was chosen to source the CO 2 from Denbury
Resources Inc. (DBI) by tying into the existing North-South running NEJD CO 2 pipeline originating at their CO2 source field
Jackson Dome, located near Jackson, Mississippi (see Figure 6).
Như một kết quả của việc tối ưu hóa thiết kế sản xuất đã quyết định rằng hai tiêm / cặp cũng sản xuất sẽ được sử dụng trong
các địa điểm được lựa chọn như được minh họa trong hình 4. Cả hai giếng phun, G và G1, có tổng chiều sâu thẳng đứng của
8700 ft, trong khi phần dọc giếng ngang 'cũng đạt độ sâu 8700 ft. Các phần ngang của các giếng khai thác, H và H1, mỗi người
đều có một chiều dài khoảng 1200 ft. Sự kết hợp tối ưu của tỷ lệ tiêm CO2 và tỷ lệ sản xuất bề mặt có thể được suy ra từ Bảng
3 và Hình 5 trong đó thể hiện một cái nhìn tổng quan về hiệu quả của việc thay đổi cả thông số về việc thu hồi dầu tăng trên
đường cơ sở phục hồi waterflood, được thể hiện% OOIP (tỷ lệ phần trăm của dầu gốc tại chỗ) và% ROIP (tỷ lệ dầu còn lại tại
chỗ, tức là bỏ lại phía sau trong hồ sau khi waterflood). Trong các lĩnh vực ứng dụng của GAGD có rất nhiều nguồn có thể cho
thu thập các CO2 cần thiết. Trong nghiên cứu này đã được lựa chọn để nguồn CO2 từ Denbury Resources Inc (DBI) bằng cách
buộc vào hiện tại Bắc-Nam chạy NEJD đường ống CO2 có nguồn gốc ở lĩnh vực nguồn CO2 của họ Jackson Dome, nằm gần
Jackson, Mississippi (xem Hình 6).
The optimization phase was followed by a confidential economic analysis done in-house by the oil company shortly
after which field preparations commenced. The aim of this paper is to conduct our own economic analysis regarding the
GAGD application in the BH field utilizing as much current data and the appropriate fiscal terms that are applicable in
Northeastern Louisiana.
Các giai đoạn tối ưu hóa đã được theo sau bởi một phân tích kinh tế bí mật thực hiện trong nhà của các công ty dầu khí ngay sau
đó chuẩn bị trường bắt đầu. Mục đích của bài viết này là để tiến hành phân tích kinh tế của chúng ta về việc áp dụng GAGD trong
lĩnh vực BH sử dụng nhiều dữ liệu hiện hành và các điều khoản tài chính thích hợp được áp dụng trong Đông Bắc Louisiana.
3
1.
2.
3.
4
SPE
Methodology
Putting Together the Appropriate Cost Model
For this study a GAGD cost model was constructed that was as detailed and up to date as possible. To this end, various
professionals in the field of petroleum field development were consulted to gather the most applicable cost elements to be
included in the cost model. The cost model was part of the overall cash flow analysis that was implemented in order to
evaluate the economic performance of the field implementation of GAGD. The cash flow analysis is a reflection of the
petroleum fiscal regime or system (PFS) that applies to Northern Louisiana. In essence it is a concessionary fiscal system,
otherwise known as a royalty/tax system, a reference to the two most obvious elements of the PFS. Under this PFS private
ownership of the resources is allowed through the transfer of rights to the contractor (the contractor bears all the risks and most
of the rewards) and the payment of bonuses, royalties and taxes to the state and/or federal government. The most important
payment-related components in a royalty/tax system are:
Trong nghiên cứu này là một mô hình chi phí GAGD được xây dựng mà là càng chi tiết và cập nhật nhất có thể. Để kết thúc
này, các chuyên gia khác nhau trong các lĩnh vực phát triển mỏ dầu khí đã được tham vấn để thu thập các yếu tố chi phí áp
dụng nhiều nhất để được bao gồm trong các mô hình chi phí. Các mô hình chi phí là một phần của phân tích dòng tiền tổng thể
đã được thực hiện nhằm đánh giá hiệu quả kinh tế của việc thực hiện lĩnh vực GAGD. Các phân tích dòng tiền mặt là một sự
phản ánh của các chế độ tài chính dầu khí hoặc hệ thống (PFS) áp dụng cho Bắc Louisiana. Về bản chất nó là một hệ thống tài
chính ưu đãi, nếu không được biết đến như một hệ thống tiền bản quyền / thuế, một tham chiếu đến hai yếu tố rõ ràng nhất của
PFS. Dưới đây PFS sở hữu tư nhân của các nguồn tài nguyên được phép thông qua việc chuyển nhượng quyền cho nhà thầu
(các nhà thầu phải chịu mọi rủi ro và hầu hết các phần thưởng) và thanh toán tiền thưởng, tiền bản quyền và các loại thuế cho
chính phủ tiểu bang và / hoặc liên bang. Các thành phần thanh toán liên quan đến quan trọng nhất trong một hệ thống tiền bản
quyền / thuế là:
Royalty – usually a percentage of the gross revenue.
Additional deductions – these are taken out of the net revenue after royalty and are comprised of the operating costs (OPEX) and
the capital expenditures (CAPEX), including depreciation, depletion and amortization allowances and tangible and intangible
drilling costs.
Taxation – deducted from the net revenue after royalty and fiscal deductions, encompassing state and/or local taxes and federal
income tax.
1. Nhuận bút - thường là một tỷ lệ phần trăm của tổng doanh thu.
2. khấu trừ bổ sung - đây là những thực hiện của doanh thu thuần sau thuế tài nguyên và được bao gồm các chi phí vận hành
(OPEX) và các chi phí vốn (CAPEX), bao gồm khấu hao, cạn kiệt và các khoản phụ cấp khấu hao và chi phí khoan hữu hình
và vô hình.
3. Thuế - trích từ doanh thu thuần sau thuế tài nguyên và các khoản khấu trừ tài chính, nhà nước bao gồm và / hoặc thuế địa
phương và thuế thu nhập liên bang.
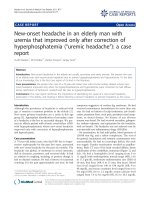
The various components are illustrated in the flow chart depicting the PFS in Northern Louisiana (Figure 7). A cash
flow analysis involves the calculation of the net cash flow, i.e. “the summation of all revenues, expenses, taxes and
investments on a year-by-year basis” (Iledare, 2001) according to the following formula:
Các thành phần khác nhau được minh họa trong biểu đồ dòng miêu tả PFS ở Bắc Louisiana (Hình 7). Một phân tích
dòng tiền liên quan đến việc tính toán dòng tiền ròng, tức là "tổng của tất cả các khoản thu, chi phí, thuế và các khoản đầu tư
trên cơ sở năm-by-năm" (Iledare, 2001) theo công thức sau đây:
NCFt = GRt − ROYt − CAPEXt − OPEXt − BONUSt −TAXt − OTHERt…………………………………………………… (1)
, where:
•
NCFt
= After-tax net cash flow in year t;
•
GRt
= Gross revenues in year t;
•
ROYt
= Total royalties paid in year t;
•
OPEXt
= Total operating expenditures in year t;
•
BONUSt
= Bonus paid in year t;
•
CAPEXt
= Total capital expenditures in year t;
•
TAXt
= Total taxes paid in year t;
•
OTHERt
= Other costs paid in year t.
In order to account for the time value of money the calculated cash flows were discounted using the appropriate
discount factor that is reflective of the corporate cost of capital. The summation of the net cash flow is referred to as the net
present value and for a specific field, F, and given the specific fiscal regime, f, can be calculated as:
( )
PVk F, ƒ =
∑
N¢Ft
……………………….……………………………………………………………………………. (2)
t=1
(1+D)
t—1
, where:
• D = Discount factor.
1.
Cost Model
This section outlines how the capital and operating expenditures were determined and applied to the cost model.
Capital Expenditure (CAPEX):
Capital Expenditure, CAPEX, is a one-off cost usually incurred at the beginning of a project (also referred to as a front-end
cost prior to production). During implementation of the GAGD process CAPEX would be generated from the drilling of two
vertical and two horizontal wells as well as the installation of the facilities required to run the process and a 20 mile pipeline.
The costs of well drilling and completions are based on a study of Louisiana Wellbore Completions Schematics and Formation
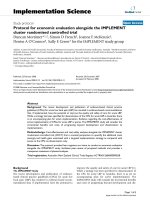
tops by Dr. Don Goddard (Goddard, 2006). Using the chart of average drilling cost per foot in Figure 8 the intangible cost of
drilling a vertical well can be inferred. In addition, the Authorization for Expenditure (AFE) costs tables (Figure 9) of a 5000’
and a 10000’ well contained in the report (Goddard, 2006), were used to extrapolate the tangible cost of drilling an 8700’ well.
Therefore, two 8770’ vertical injection wells should cost about $5 million, and two 8650’ horizontal producing wells should
cost about $8 million including completions, hence a total of $12 million in drilling cost.
Chi phí vốn, CAPEX, là một chi phí một-off thường phát sinh vào đầu của một dự án (còn gọi là chi phí đầu cuối trước khi sản
xuất). Trong thời gian thực hiện quy trình CAPEX GAGD sẽ được tạo ra từ sự khoan hai chiều dọc và hai giếng ngang cũng
như việc cài đặt các phương tiện cần thiết để chạy quá trình và một đường ống 20 dặm. Các chi phí của giếng khoan và hoàn
tất được dựa trên một nghiên cứu của Louisiana Wellbore hoàn Schematics và ngọn hình thành bởi Tiến sĩ Don Goddard
(Goddard, 2006). Sử dụng biểu đồ chi phí khoan trung bình mỗi chân trong hình 8 chi phí vô hình của khoan một cái giếng
thẳng đứng có thể được suy ra. Ngoài ra, các Uỷ quyền cho Chi (AFE) chi phí bảng (Hình 9) của một 5000 'và 10000' cũng
chứa đựng trong các báo cáo (Goddard, 2006), được sử dụng để ngoại suy các chi phí hữu hình của khoan một 8700 'tốt. Vì
vậy, hai 8770 'giếng dọc tiêm nên có giá khoảng $ 5 triệu, và hai 8650' giếng sản xuất ngang nên chi phí khoảng $ 8.000.000
trong đó có hoàn tất, do đó tổng cộng $ 12 triệu trong chi phí khoan.
After the wells are drilled and completed, the facilities needed to carry out the process must be installed or built. This
operation would be considered of a small size compared to the large 10 to 30-well gas flooding operations, therefore the
facilities costs would be a fraction of a large-sized operation. The equipment needed is: two compressors, an engine, heat
exchangers, separator, pulsation dampeners, and a concrete structure to house them. To find their cost we contacted DresserRand Inc. in Baton Rouge, LA, and one of their salesmen, Mr. Fisher, quoted us $1.5 million for the compression equipment.
Mr. Dan Nelson of Compressor System Inc gave us a cost estimate of $5 million dollars to build a facility with all the above
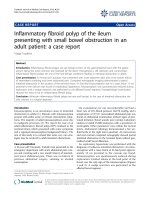
equipments. Therefore, the facilities added $5 million to the aggregate CAPEX cost. Lastly, to estimate the cost of
constructing a pipeline from the source of CO 2 to the BH field we used the chart in Figure 10 which is taken from a natural gas
transmission pipeline cost analysis study (Parker, 2004). The distance from the delivery point of CO 2 is 10 miles plus a safety
factor of two to account for the meandering involved in laying a pipeline (e.g. avoiding large structures or sensitive areas),
hence the envisioned 20 miles of pipeline. Using these natural gas transmission pipeline costs (Parker, 2000) an estimate cost
of laying a 4 inch diameter, 20 mile pipeline can be estimated to be about $4.1million. The aggregate CAPEX cost used in the
cost model is ultimately estimated to be $21.2 million.
Sau khi giếng được khoan và hoàn thành, các phương tiện cần thiết để thực hiện quá trình này phải được cài đặt hoặc
xây dựng. Hoạt động này sẽ được xem xét trong một kích thước nhỏ so với lượng lớn 10-30-cũng hoạt động khí ngập lụt, do
đó chi phí cơ sở sẽ là một phần nhỏ của một hoạt động có quy mô lớn. Các thiết bị cần thiết là: hai máy nén khí, động cơ, bộ
trao đổi nhiệt, phân cách, dampeners pulsation, và một cấu trúc cụ thể để nhà họ. Để tìm chi phí của họ, chúng tôi đã liên lạc
với Dresser- Rand Inc tại Baton Rouge, LA, và một trong những nhân viên bán hàng của họ, ông Fisher, trích dẫn cho chúng
tôi $ 1,5 triệu USD cho các thiết bị nén. Ông Dan Nelson Compressor System Inc đã cho chúng tôi một ước tính chi phí $ 5
triệu đô la để xây dựng một cơ sở với tất cả các thiết bị trên. Do đó, các cơ sở thêm $ 5 triệu cho chi phí CAPEX tổng hợp.
Cuối cùng, để ước tính chi phí xây dựng một đường ống dẫn từ các nguồn CO2 vào lĩnh vực BH chúng tôi sử dụng các biểu đồ
trong Hình 10 được lấy từ một truyền khí tự nhiên phân tích chi phí đường ống dẫn nghiên cứu (Parker, 2004). Khoảng cách từ
điểm giao hàng của CO2 là 10 dặm cộng với một hệ số an toàn của hai tài khoản cho các vòng vo tham gia trong việc đặt một
đường ống dẫn (ví dụ như tránh các cấu trúc lớn hoặc các khu vực nhạy cảm), vì thế mà hình dung 20 dặm của đường ống. Sử
dụng những chi phí đường ống dẫn khí tự nhiên (Parker, 2000) là một chi phí ước tính của đặt một đường kính 4 inch, 20 dặm
đường ống dẫn có thể được ước tính là khoảng $ 4.1million. Các chi phí CAPEX tổng hợp được sử dụng trong các mô hình chi
phí cuối cùng được ước tính là 21.200.000 $.
(
)
(
CAPEX = Drilling cost 2 horizontal + 2 rertical wells + Facilities Comgressor + Diesel Engine +
Concrete
ƒloor
structure+Heat
exchangers+Segerators+Pulsation
Damgener)+20
miles
pipeline………………..……………………………………………………………………………………………….(3)
o†
(
)
⁄
CAPEX = 2 × $4 million × 2 × $2.5 million + $5 million + (20 miles × $159,566 mile) = $21.2 million
2.
Operating Expenditure (OPEX):
OPEX was garnered from the CO 2 cost, and the overhead and maintenance costs. The closest CO 2 source to the BH site is the
Jackson Dome in Mississippi owned and operated by Denbury Resources Inc. According to DBI’s investor’s report, their
⁄
⁄
current price of CO2 is $0.15 Mcƒ to $0.30 Mcƒ, and since the daily injection volume varies from 0.5 MMscf to 2 MMscf, the
daily CO2 cost ranges from $150/day to $1200/day. The overhead costs in this model account for the wages of one operator and
one mechanic which was estimated to be about $8,000/month. Lastly, $50,000 will be allocated each year in anticipated
maintenance cost. If this sum is not fully used it will be added to the next years maintenance allocation. Therefore, the
aggregate OPEX cost is estimated to be:
OPEX đã thu hút được từ chi phí CO2, và các chi phí trên không và bảo trì. Các nguồn CO2 gần gũi nhất với các trang web
BH là Jackson Dome ở Mississippi thuộc sở hữu và điều hành bởi Denbury Resources Inc. Theo báo cáo của chủ đầu tư của
DBI, giá hiện tại của họ CO2 là $ 0.15/Mcƒ đến $ 0.30/Mcƒ, và kể từ khi khối lượng tiêm hàng ngày thay đổi từ 0,5 MMscf
đến 2 MMscf, phạm vi chi phí CO2 hàng ngày từ $ 150 / ngày để $ 1200 / ngày. Các chi phí trên không trong tài khoản này
mô hình cho tiền lương của một nhà điều hành và một thợ cơ khí đã được ước tính là khoảng $ 8.000 / tháng. Cuối cùng, $
50,000 sẽ được phân bổ hàng năm trong chi phí bảo trì dự kiến. Nếu số tiền này không được sử dụng đầy đủ nó sẽ được bổ
sung vào các năm phân bổ bảo dưỡng tiếp theo. Do đó, chi phí OPEX tổng hợp được tính toán là:
(
)
OPEX = CO2cost + OrerMead 1 ogerator + 1 mechanic + Maintainance …… … … … … … … … … … … … … … … . (4)
OPEX = (
3.
$150
$1200
$4000
/day to
/day) + (2 ×
/month)+ (
$50,000
/year)
Royalty and Taxes:
According to Veazey & Associates, a local reservoir engineering consulting firm, landowner royalty rates vary and are
negotiable. Royalties can range from one-eighth (12.5%) to one-third (33.3%), but usually are one-fifth (20%). Louisiana
Taxes are generally classified into Severance Taxes and Ad Valorum Taxes. For oil, the severance taxes are fixed at 12.5% of
the gross value (after royalty and fiscal deductions). Lastly, in our analysis we applied a federal income tax of 20% to 40% on
the taxable income.
Theo Veazey & Associates, một công ty tư vấn kỹ thuật hồ địa phương, tỷ lệ tiền bản quyền sở hữu đất khác nhau và có thể
thương lượng. Thuế tài nguyên có thể từ một phần tám (12,5%) đến một phần ba (33,3%), nhưng thường là một phần năm
(20%). Thuế Louisiana thường được phân loại thành Thuế Severance và Ad Valorum Thuế. Đối với dầu, các loại thuế thôi
được cố định ở 12,5% tổng giá trị (sau khi trả tiền bản quyền và các khoản trích tài chính). Cuối cùng, trong phân tích của
chúng tôi, chúng tôi áp dụng một loại thuế thu nhập liên bang từ 20% đến 40% trên thu nhập chịu thuế.
Discussion
To assess the feasibility of the proposed GAGD filed application economic performance indicators were calculated and used to
evaluate this project. These were the Net Present Value (NPV), Internal Rate of Return (IRR), Performance Index (PI) and
Growth Rate of Return (GRR). These economic performance indicators were calculated using the following formulas:
Để đánh giá tính khả thi của đề xuất GAGD nộp đơn chỉ số hoạt động kinh tế được tính toán và sử dụng để đánh giá
các dự án này. Đây là những giá trị hiện tại ròng (NPV), nội bộ Tỷ lệ Return (IRR), Performance Index (PI) và tốc độ
tăng trưởng của
Return (GRR). Các chỉ số hoạt động kinh tế được tính toán bằng cách sử dụng công thức sau đây:
∑
•
=
NPV
•
PI =
n
N¢F
t
t=0 (1+r)t
……………………..………………………………………………………………………………… (2)
NPV
Tota1 Inrestment
……………………………………………………………………………………………………... (5)
•
•
GRR = [PI1/t × (1 + Discount Rate)]— 1……………………………………….……………………………………. (6)
IRR – is the value of the discount rate given the specific field, f, and the reigning fiscal regime, F, at which the NPV equals zero:
IRR (f, F) = {D | PV ( f ,F) = 0}…………………….……………………………………………….……… (7)
The aforementioned equations were coded in an Excel spreadsheet that was used in conjunction with Crystal Ball
software to evaluate this project and perform a thorough sensitivity analysis on the effect of selected input variables on the
previously mentioned economic performance indicators. The selected input variables and their assumed probability
distributions are:
Các phương trình nói trên đã được mã hóa trong một bảng tính Excel được sử dụng kết hợp với phần mềm Crystal
Ball để đánh giá dự án này và thực hiện phân tích độ nhạy kỹ lưỡng về tác động của các biến đầu vào được lựa chọn trên các
chỉ số hoạt động kinh tế đã đề cập trước đó. Các biến đầu vào được lựa chọn và phân bố xác suất giả định của họ là:
1.
CAPEXexpensed: Triangular distribution – Minimum = 20%, likeliest = 30% & maximum = 40%.
2.
CO2 Price: Uniform distribution – Minimum = $0.15/Mcf & maximum = $0.30/Mcf.
3.
4.
Discount Rate: Triangular distribution – Minimum = 5%, likeliest = 10%, & maximum = 20%.
Oil Price: Lognormal distribution – With a location = $22.74/bbl, mean = $66.30/bbl, & standard deviation = $26.14/bbl. The
probability distribution of the oil price was based on the historical oil prices of the past 5 years (as downloaded from
the Energy Information Administration website). The probability function fitting tool in Crystal Ball was then used to fit
the best possible probability distribution function.
7.
5.
Production Scheme: Discrete Uniform distribution – Minimum = 1 & maximum = 12. In the design optimization stage the
application of GAGD was simulated using CMG’s compositional simulator GEM to predict the production profile. A total
of 3 different CO2 injection rates and 4 different surface oil production rates were used, thus resulting in 12 different
production schemes. Each scheme was assigned a number from 1 to 12 and coded in such a way that Crystal Ball could
access each production profile by sampling from the assigned probability distribution.
6.
Royalty: Triangular distribution – Minimum = 12.5%, likeliest = 20% & maximum = 33.3%.
Federal Income Tax (FIT): Triangular distribution – Minimum = 20%, likeliest = 30% & maximum = 40%.
1. CAPEXexpensed: phân phối tam giác - tối thiểu = 20%, khả năng nhất = 30% & tối đa = 40%.
2. CO2 Giá: phân phối Uniform - tối thiểu = $ 0.15 / MCF & tối đa = $ 0,30 / MCF.
3. Giảm giá: phân phối tam giác - tối thiểu = 5%, nhiều khả năng = 10%, và tối đa = 20%.
4. Dầu Giá: phân phối lognormal - Với một vị trí = 22,74 $ / thùng, có nghĩa là = 66,30 $ / thùng, và độ lệch chuẩn = 26,14
$ / thùng. Các phân phối xác suất của giá dầu đã được tính dựa vào giá dầu lịch sử của 5 năm qua (như tải xuống từ
các trang web thông tin năng lượng). Các công cụ phù hợp chức năng xác suất trong Crystal Ball sau đó đã được sử dụng để
phù hợp với chức năng phân phối xác suất tốt nhất có thể.
5. Sản xuất Đề án: phân phối Uniform rời rạc - tối thiểu = 1 & tối đa = 12. Trong giai đoạn thiết kế tối ưu các ứng dụng của
GAGD đã được mô phỏng bằng cách sử dụng thành phần mô phỏng GEM của CMG dự đoán hồ sơ cá nhân sản xuất. Tổng
cộng có 3 mức CO2 khác nhau và 4 mức sản xuất dầu bề mặt khác nhau được sử dụng, do đó kết quả 12 đề án sản xuất khác
nhau. Mỗi chương trình được gán một con số từ 1 đến 12 và được mã hóa trong một cách mà Crystal Ball có thể truy cập
vào từng hồ sơ sản xuất bằng cách lấy mẫu từ phân phối xác suất được giao.
6. Royalty: phân phối tam giác - tối thiểu = 12,5%, khả năng nhất = 20% & tối đa = 33,3%.
7. Thuế thu nhập liên bang (FIT): phân phối tam giác - tối thiểu = 20%, khả năng nhất = 30% & tối đa = 40%.
By using the least and most favorable values for each of the input variables above the range of the economic
performance indicators can be attained as tabulated in Table 4. However, these numbers only show two possibilities of the
economic performance of the projects. Crystal Ball affords the possibility to run a Monte Carlo simulation in which each of the
probability distributions of the input variables is randomly sampled at which instance the sampled values are used to calculate
the performance indicators of that trial. The population of trials resulted in a probability distribution of the economic indicators
themselves therefore allowing incorporation of the uncertainty inherent in the parameters in the evaluation of the project. The
fitted distributions and the characteristic parameters are given in Table 5. Based on the summary table, the mean IRR is very
favorable (126%) and is substantially higher than the traditionally accepted corporate discount rate of 10%. Compared to the
other three parameters, the GRR has the least variability as reflected by its coefficient of variability, whereas the other three
vary similarly compared amongst one another. A thorough sensitivity analysis was also performed using Crystal Ball, and as
shown in the sensitivity charts (tornado charts) in Figure 11, the oil price contributed the most to the variability in the data. In
addition, the NPV is also sensitive to the discount rate, with the other three parameters showing more sensitivity to
CAPEXexpensed than the discount rate, with the exception of IRR.
Bằng cách sử dụng các giá trị ít nhất và thuận lợi nhất cho mỗi biến đầu vào ở trên phạm vi của các chỉ số hoạt động
kinh tế có thể đạt được như trình bày trong Bảng 4. Tuy nhiên, những con số này chỉ hiển thị hai khả năng của các hoạt động
kinh tế của các dự án. Crystal Ball dành khả năng để chạy một mô phỏng Monte Carlo trong đó mỗi phân bố xác suất của các
biến đầu vào được lấy mẫu ngẫu nhiên ở các trường hợp đó, giá trị lấy mẫu được sử dụng để tính toán các chỉ số thực hiện của
phiên tòa. Dân số của các thử nghiệm kết quả trong một phân bố xác suất của các chỉ số kinh tế do đó tự cho phép kết hợp của
sự không chắc chắn vốn có trong các thông số trong đánh giá dự án. Các bản phân phối được trang bị và các thông số đặc
trưng được đưa ra trong Bảng 5. Căn cứ vào bảng tóm tắt, IRR trung bình là rất thuận lợi (126%) và cao hơn đáng kể so với tỷ
lệ chiết khấu của công ty truyền thống chấp nhận là 10%. So với ba thông số khác, GRR có sự thay đổi ít nhất là phản ánh hệ
số của nó biến đổi, trong khi ba người kia thay đổi tương tự như so sánh giữa một khác. Một phân tích độ nhạy kỹ lưỡng cũng
được thực hiện bằng cách sử dụng Crystal Ball, và như thể hiện trong các bảng xếp hạng độ nhạy (bảng xếp hạng tornado)
trong hình 11, giá dầu đã đóng góp nhiều nhất cho sự thay đổi trong dữ liệu. Ngoài ra, các NPV cũng là nhạy cảm với lãi suất
chiết khấu, với ba thông số khác cho thấy sự nhạy cảm hơn để CAPEXexpensed hơn lãi suất chiết khấu, với ngoại lệ của IRR.
Conclusions
In this study an economic evaluation of the application of GAGD in the BH field was conducted. A cash flow model was
designed which contained all the elements of Louisiana’s concessionary PFS and the most current cost data as provided to us
by industry professionals. After coding all the pertinent cash flow equations in Excel a Monte Carlo simulation was performed
using Crystal Ball to assess the effect of each of the selected input variables, such as the production scheme, the expensed
CAPEX, the price of oil and CO 2, the discount, royalty and tax rate, on the economic performance indicators. The simulation
study showed that the implementation of GAGD has a high probability of being economic given the current economic
conditions based on the selected economic performance indicators IRR, NPV, GRR and PI.
Trong nghiên cứu này đánh giá kinh tế của các ứng dụng của GAGD trong lĩnh vực BH đã được tiến hành. Một mô hình dòng
tiền được thiết kế trong đó có tất cả các yếu tố của ưu đãi PFS Louisiana và các dữ liệu chi phí hiện tại hầu hết là cung cấp cho
chúng tôi bởi các chuyên gia ngành công nghiệp. Sau khi mã hóa tất cả các phương trình dòng chảy tiền mặt cần thiết trong
Excel một mô phỏng Monte Carlo được thực hiện bằng cách sử dụng Crystal Ball để đánh giá hiệu quả của mỗi biến đầu vào
được lựa chọn, chẳng hạn như các chương trình sản xuất, các CAPEX vào chi phí, giá dầu và khí CO2, giảm giá , thuế tài
nguyên và thuế suất, về các chỉ số hoạt động kinh tế. Các nghiên cứu mô phỏng cho thấy rằng việc thực hiện GAGD có một
xác suất cao là kinh tế được đưa ra các điều kiện kinh tế hiện nay dựa trên các chỉ số hoạt động kinh tế được lựa chọn IRR,
NPV, GRR và PI.
1.
2.
3.
5.
6.
10.
11.
12.
References
“Basin Oriented Strategies for CO2 Enhanced Oil Recovery: Onshore Gulf Coast,” report prepared by Advanced Resources
International
for
the
Department
of
Energy,
February
2006,
downloaded
on
5/10/2009
from
/>Chidsey, T.C., Jr., Eby, D.E., “Major Oil Plays in Utah and Vicinity,” quarterly technical report to the DOE under Contract No.
DE-FC26-02NT15133, Tulsa, OK, 2008.
Christensen, J.R., Stenby, E.H., and Skauge, A., “Review of WAG Field Experience,” SPEREE, vol. 4, no. 2, pp. 97-106, 2001.
4. Compressor Systems Inc., Dan Nelson 432-563-1170.
D.A. Goddard, “Louisiana Wellbore Schematics and Formation Tops,” Center for Energy Studies, Louisiana State University,
Baton Rouge, LA, 2006.
Denbury Resources Inc., “May 7th 2009 Corporate Investor’s Presentation,” downloaded on May 9, 2009 from:
/>7. Dresser-Rand Company, Baton Rouge Sales Representative Mr. Fisher, 225-273-7313.
8. Iledare, O.O., “Analyzing the Impact of Petroleum Fiscal Arrangements and Contract Terms on Petroleum E&P
Economics,” SPE 88969, presented at Nigeria Annual International Conference and Exhibition, 2‐4 August 2004,
Abuja, Nigeria.
9. Kinder Morgan Inc, CO2 Marketing manager Doug McMurrey, 713-369-9159.
Kulkarni, M. M., Rao, D.N., “Is Gravity Drainage an Effective Alternative to WAG?,” presented at the AIChE Annual Meeting,
Austin, TX, November 7-12, 2004.
Parker, N. C., “Using Natural Gas Transmission Pipeline Costs to Estimate Hydrogen Pipeline Costs,” Institute of Transportation
Studies, University of California, Davis, CA, 2004.
Rao, D.N., Ayirala, S.C., Kulkarni, M.M., and Sharma, A.P., “Development of Gas Assisted Gravity Drainage (GAGD) Process
for Improved Light Oil Recovery,” SPE 89357 presented at SPE/DOE Symposium on Improved Oil Recovery, 17-21 April 2004,
Tulsa, Oklahoma.
13. Veazey and Associates, Louisiana Oil and Gas consultants Mike Veazey & Jim Veazey, 225-7651914.
Table 1: Overview of the Majority of the Onshore Gulf Coast Region’s Oil Reservoirs (2006 DOE report)
No. of Reservoirs
OOIP (Billions Bbls)
Cumulative
Recovery/Reserves
(Billion Bbls)
178
34
20
7
239
n/a
20.4
3.0
1.1
1.3
25.8
44.4
7.9
1.0
0.4
0.6
9.9
16.9
Major Oil Reservoirs
Louisiana
Mississippi
Alabama
Florida
Database Total
Regional Total
ROIP (Billion Bbls)
12.5
2.0
0.7
0.7
15.9
27.6
Table 2: Portion of the Onshore Gulf Coast Region’s Oil Reservoirs Suitable for CO2-EOR (2006 DOE report)
Region
Louisiana
Mississippi
Alabama
Florida
Total
No. of Reservoirs
128
20
5
5
158
Cumulative
Recovery/Reserves
(Billion Bbls)
6.7
0.7
0.3
0.5
8.2
OOIP (Billions Bbls)
16.1
1.9
0.8
1.3
20.1
ROIP (Billion Bbls)
9.4
1.2
0.5
0.8
11.9
Table 3: Overview of the Simulation Study
Gas
injection
rate
STO
Production
Rate
(BPD/well)
500
750
1000
1250
0.5 MMSCFD/well
1 MMSCFD/well
2 MMSCFD/well
Incremental
Recovery
(%OOIP)
Incremental
Recovery
(%ROIP)
Incremental
Recovery
(%OOIP)
Incremental
Recovery
(%ROIP)
Incremental
Recovery
(%OOIP)
Incremental
Recovery
(%ROIP)
36.46
36.75
36.82
36.80
49.17
49.55
49.65
49.62
37.76
37.82
37.83
37.87
50.92
51.01
51.02
51.07
39.77
39.38
39.15
39.18
53.63
53.10
52.79
52.83
Table 4: Range of the Economic Indicators
Economic
Indicators
NPV
Least Favorable
Most Favorable
‐$1,117,719
$29,232,663
IRR
12%
181%
PI
0.7
7.9
GRR
16%
39%
Table 5: Fitted Distributions using Crystal Ball
Statistics
Trials
Fitted
Distribution
Mean
Median
Standard
Deviation
Variance
Skewness
Kurtosis
Coeff. of
Variability
Minimum
Maximum
Range
Width
Mean Std.
Error
Forecast:
GRR
Forecast:
IRR
Forecast:
NPV
Forecast:
PI
1,000
1,000
1,000
1,000
Gamma
Gamma
Lognormal
Lognormal
35.5%
35.0%
126%
112%
33,330,991
28,280,163
6.4
5.5
7.2%
65%
20,929,539
3.6
0.5%
0.5212
3.45
43%
1.73
8.51
4.38E+14
2.46
13.91
12.7
2.51
14.38
0.2030
0.5165
0.6279
0.5572
18.1%
66.9%
30%
573%
3,802,088
191,450,613
1.6
35.8
48.8%
543%
187,648,526
34.2
0.2%
2%
661,850
0.1
Figure 1: Schematic Drawing of the Idealized Water Alternating Gas (WAG) Process (Chidsey et al., 2008)
Gravity Overriding
Figure 2: Gravity Overriding Problems during the WAG Process (extracted from web document downloaded on May 7, 2009
from:
/>
Figure 3: Schematic Drawing of the Gas-Assisted Gravity Drainage (GAGD) Process (Kulkarni and Rao, 2004)
Grid Top (ft) 1962-04-01
K layer: 1
2,367,000 2,368,000 2,369,000 2,370,000 2,371,000 2,372,000 2,373,000 2,374,000 2,375,000 2,376,000 2,377,000 2,378,000
File: 0.5m m scf_1000bpd_
User: wpaidi1 Date: 5/7/2009
Scale: 1:22771
Y/X: 1.00:1
Axis Units: ft
8,710
H
8,701
G
8,692
8,683
8,674
8,665
8,656
G1
8,647
8,638
H1
0.00
0.25
0.50
8,629
0.00
8,620
0.75
0.25
0.50
0.75
1.00 k
2,367,000 2,368,000 2,369,000 2,370,000 2,371,000 2,372,000 2,373,000 2,374,000 2,375,000 2,376,000 2,377,000 2,378,000
49
00
495
00
494
00
493
00
49
00
49
00
490
00
489
00
488
00
48
00
486
00
488
00
489
00
49
00
49
00
492
00
493
00
494
00
00 49
0 00
496
00
1.00
m ile
m
Figure 4: Areal (Top) and Three-Dimensional (Bottom) View of the Selected BH Pod (From confidential internal report)
SPE
Figure 5: Graph of the Effect of Varying Gas Injection and Surface Oil Rate on Incremental Recovery
General location of BH field
Figure 6: Location, Source and Origin of CO2 to be used (from online presentation downloaded on May 9, 2009 from:
/>
1
PROJECT
Net Revenue (After Royalty)
CONTRACTOR
SHARE
Gross Revenue ($/STB x STB)
Royalty (% of Gross)
Gross Revenue (After Royalty)
Net Revenue (After Royalty)
Deductions CAPEX, OPEX
Deductions CAPEX, OPEX
GOVERNME
NT
Taxable Income
LA Severance Tax
LA Severance Tax
Federal Income Tax
Federal Income Tax
Federal Income Tax
Contractor Net Cash Flow
Royalty
Government Net
Cash Flow
Taxable Income After Severance Tax
Figure 7: Flow Chart of Northern Louisiana PFS Components
LA Severance Tax
SPE
1
Figure 8: Graph of Average North Louisiana Drilling Cost per Foot (After Goddard, 2006)
Figure 9: Example AFE for a 5000’ Well (After Goddard, 2006)
C
o
s
t
p
e
r
Pipeline total cost per mile
2,000,000
1,800,000
1,600,000
1,400,000
1,200,000
1,000,000
800,000
600,000
400,000
200,000
0
0
2
4
6
8
10
12
14
16
18
Pipeline length (miles)
4" Pipeline
4" diameter pipe
y = ‐2E+05ln(x) + 758707
R² = 0.3126
Figure 10: Plot of the Total Cost of Pipeline Construction per Mile – 4” Diameter (After Parker, 2004)
Figure 11: Compilation of Sensitivity Charts