(SPE 156394) A Numerical Model for Predicting the Rate of Sand Production in Injector Wells
Bạn đang xem bản rút gọn của tài liệu. Xem và tải ngay bản đầy đủ của tài liệu tại đây (780.68 KB, 8 trang )
SPE 156394
A Numerical Model for Predicting the Rate of Sand Production in Injector
Wells
Azadbakht, S., Jafarpour, M., Rahmati, H., Nouri, A.; University of Alberta; Vaziri, H., BP America Inc.; Chan D.,
University of Alberta
Copyright 2012, Society of Petroleum Engineers
This paper was prepared for presentation at the SPE Deepwater Drilling and Completions Conference held in Galveston, Texas, USA, 20–21 June 2012.
This paper was selected for presentation by an SPE program committee following review of information contained in an abstract submitted by the author(s). Contents
of the paper have not been reviewed by the Society of Petroleum Engineers and are subject to correction by the author(s). The material does not necessar ily reflect
any position of the Society of Petroleum Engineers, its officers, or members. Electronic reproduction, distribution, or storage of any part of this paper without the
written consent of the Society of Petroleum Engineers is prohibited. Permission to reproduce in print is restricted to an abstract of not more than 300 words;
illustrations may not be copied. The abstract must contain conspicuous acknowledgment of SPE copyright.
Abstract
In this paper, a numerical model for volumetric prediction
of sand production in injector wells is presented. Sanding
in injector wells is mainly associated with the back-flow
and cross-flow generated during shut-in in addition to the
waterhammer pressure pulsing in the wellbore due to fast
flow rate changes. Emphasis is given to the
geomechanical aspects of sanding such as rock fatigue
due to cyclic pressure changes and the concomitant
degradation of bonding between the sand grains. This
model is robust in capturing the key parameters in the
sandstone behavior such as stress-dependent elasticity,
hardening, softening and dilatancy. Rock degradation is
considered to be the necessary condition for sand
production which is assumed to obey the erosion
mechanics. The model is calibrated and validated using
physical model tests carried out under various stresses and
fluid flow conditions. The numerical model has been
utilized to analyze sanding potential in a cased and
perforated injector which will be presented to demonstrate
the field application of the proposed concepts.
Introduction
Sand production is a common problem in production and
injection wells. Extensive research has been carried out in
the past couple of decades to identify the key parameters
affecting initiation and severity of this phenomenon.
Detection and management of sand production is more
obscure when it comes to injection wells as there is no
fluid production and hence no indication of sand initiation
and severity.
Practical problems associated with sand production
include erosion of pipelines and surface facilities,
reduction in productivity, intervention costs and
complexities and other environmental effects. These
problems cost the oil industry billions of dollars annually
(Nouri, 2004). On the other hand, a controllable amount
of sand production may omit the need for installing more
complex active sand controls involving use of gravel
packs which have been used extensively to reduce and
avoid sand production from unconsolidated formations
(Saucier, 1974). Therefore, understanding the sand
production mechanisms and the ability to predict and
manage the rate of sand production are beneficial.
A linked finite difference-finite element (FE-FD) code is
used for the sanding assessment of an injection well. This
model can simulate the impact of injection pressure and
shut-in cycles, including the effects of inflow differential
pressure (DP) (due to cross-flow or back-flow) and
waterhammer (WH) pulses on sanding. It also accounts
for the in situ strength and its gradual degradation due to
stress and pressure changes. By simulating the shut-in
cycles, the main effects of well operation over the
wellbore life can be accounted for. The model
incorporates the essential physics in water injection
operations and accounts for the critical factors with
respect to the rock behavior and sanding mechanisms,
including the influence of flow rate on sand production.
Brief Physics of Sand production
When a fluid is injected into a reservoir, the following
occur depending on the formation consistency:
Increase in pressure leads to reduction in
effective stress and hence reduction in particleto-particle frictional resistance which particularly
impacts the sanding response in unconsolidated
or disaggregated materials. Under high injection
pressure and/or waterhammer pressure pulsing,
particularly if exceeding the overburden stress,
2
sand may reach a fluidized state. This condition
may exacerbate sanding right after shut-in
depending on the injection magnitude and shutin rate.
In weakly consolidated formations, injection and
shut-in cycles particularly if combined with
waterhammer pulses may result in the
destruction of cementation and turn the material
into an unconsolidated sand mass with
consequences as discussed above.
In competent and cemented formations, high
injection may result in development of fractures
but no major sanding is expected as a result of
this phenomenon.
Every cycle of shut-in and start-up will promote sand face
fatigue (gradual weakening of cementation due to strain
cycles) and this may eventually breakdown all
cementation. The extent and acceleration of degradation
depend on the magnitude of injection, shut-in rate
(impacting magnitude of cross-and back-flow and
waterhammer intensity) and strength properties of the
formation.
In water injectors, the injection pressure and water are
likely to destroy the multi-grain structure and hence create
a high potential and volume of sanding.
Numerical Model Description
A numerical tool that links a finite difference (FD) code
with a finite element (FE) code is used for this study. The
distinguishing features of this model that are of critical
importance to the proposed study include:
The drilling phase is simulated in a fully coupled
manner to capture the critical processes that
happen during drilling more accurately.
The injection/shut-in cycles are performed using
sequential coupling. In that, the FD code
performs the mechanical calculations and the FE
code does the fluid flow calculations. This is
done to take advantage of fast fluid flow
calculation of the FE code.
The model allows for rock strength degradation
with changes in stress and strain associated with
the injection cycles and the waterhammer
pressure pulses.
The model is capable of computing sand
production.
The model accounts for the very rapid inflows
following shut-ins and hence can capture the
effects of the shut-in rate.
It can track changes in hydro-mechanical
properties (e.g., stiffness, permeability) as a
result of sanding and changes in effective stress
with injection.
Two main components of this numerical model are the
constitutive model and sanding criterion which are briefly
described below.
SPE 156394
Constitutive model. The importance of precise and
descriptive modeling of constitutive behavior of rocks can
not be overemphasized. This part plays a vital role in any
sand production simulation.
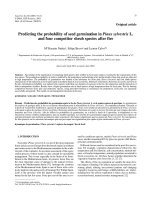
As shown schematically in Fig. 1, results of laboratory
experiments indicate that granular materials usually
demonstrate strain softening at Low Effective Confining
Stress (LECS) and strain hardening at the state of High
Effective Confining Stress (HECS) (Vermeer & de Borst,
1984; Sulem et al., 1999). These facts are taken into
account in formulation of the yield surface which expands
(strain hardening) or contracts (strain softening) as a
function of the hardening parameter which will be
introduced later.
Fig. 1: Different stress-strain regimes at various confining
stresses (Vaziri et al., 2007)
Elasto-palstic constitutive models have shown to model
sandstone behavior with adequate accuracy. In this paper
the same approach as Sulem et al. (1999) and Nouri et al.
(2009) is undertaken in which a bilinear Mohr-Coulomb
(MC) model is calibrated using laboratory tests.
This model involves the calibration of elastic properties,
initial and peak yield surfaces, friction hardening,
cohesion softening and mobilized dilation angle. The last
three parameters are expressed as a function of the
hardening parameter that is itself a function of principal
plastic strains. For the sake of brevity, the details of the
constitutive modeling are not presented here but the
interested reader can refer to the above references.
Sanding criterion. The sanding criterion used in this
study is based on erosion mechanics (Detournay, 2006).
In this logic, it is assumed that sanding will start when
both of the following conditions are met:
a) All cohesion (which represents cementation) is
lost; that is, real cohesion degrades to zero, and
b) The totally disaggregated or cohesionless sand
particles are broken away from sand mass and
carried into the perforation/wellbore by the
action of hydrodynamic forces (erosion process).
This process causes the porosity of the elements
to increase (as a result of sand removal) until it
reaches the critical porosity, i.e., the porosity at
SPE 156394
which the rock matrix collapses (Rahmati et al,
2011).
There are almost no field cases involving injectors where
the sanding events have been recorded as they occurred.
This makes validation or even calibration of any modeling
effort difficult.
Having said that, the following measures are undertaken
into considerations to deal with the general uncertainties:
• Maximize value from laboratory tests performed
on formation rock samples. The rigor involved
in back-analyzing properties that capture the
rock behavior is shown later along with
validation.
• Use rigorous numerical analyses. In this case,
we have used a complex numerical model along
with a fine mesh and complex procedures to
capture very short duration events, such as
pressure waves, relatively short events such as
shut-in and injection build up and longer term
operations during steady injection.
Numerical Model Calibration
Calibration of the numerical model involves calibration of
both constitutive model and the sanding criterion.
Constitutive Model Calibration
The bilinear MC with combined hardening/softening
model was calibrated using a series of uniaxial and
triaxial tests. Fig. 2 shows this model schematically.
3
Fig. 2-a shows the hardening behavior wherein line (0)
stands for the initial yield surface. Once a stress state
reaches line (0), plastic deformation begins. Further
loading increases the friction coefficient or the slope of
the line up to the peak yield surface (line 1). This is
shown by the upward arrows from line (0) to line (1). Up
to this point, the tension cut-off is approximately constant
both for the low and high effective confining stresses
(
and
). Additional deformation after the
peak results in the softening of the material and shrinkage
of the yield surface. This is demonstrated in Fig. 2-b by
the downward arrows from line (1) to line (2). During
softening, tension cut-off shrinks to the residual value
( ), and it is equal to zero for fully degraded sandstone,
as depicted in Fig. 2-b. However, the friction coefficient
remains constant. That is, the line is lowered to the
residual state with the same slope as that of the peak. Line
(2) is the new yield surface during softening when the
residual tension cut-off gradually decreases to zero
leading to the development of shear bands (Jafarpour et
al., 2012).
Tension cut-off can be related to the mobilized cohesion,
C, by the following relationship:
q C / tan
where
(1)
is the friction angle of the rock.
In this work, the hardening parameter is Equivalent
Plastic Strain (EPS), which is defined by the following
(Vermeer and de Borst, 1984):
1
2
2
2 ö2
æ1
1
1
EPS = ç ( De1ps - Demps ) + ( Demps ) + ( De3ps - Demps ) ÷
è2
ø
2
2
.
where
emps
(2)
1
e1ps e3ps
3
(3)
e jps , j 1,3 are the principal plastic shear strain
increments.
The MC envelope as shown in Fig. 2 varies as a function
of (EPS) and hence can simulate the strength degradation.
Fig. 3 shows the elastic properties of a pay sandstone
layer with UCS of 1,250 psi as a function of the confining
stresses. Shear and bulk moduli increase with increase in
confining stress which is due to the closing of pre-existing
micro-cracks. As plastic deformations start, friction and
dilation are mobilized as a function of EPS until they
reach the peak values after which they remain constant.
Fig. 4 shows the mobilized friction and dilation angles for
the same sandstone.
Fig. 2: a) Hardening and b) softening of the bilinear MohrCoulomb model (Sulem et al., 1999)
4
SPE 156394
Fig. 3: Bulk and shear moduli as a function of confining
stresses
Fig. 6: Comparison of numerical and experimental stressstrain response for a triaxial test
Sanding Model Calibration
The main parameters in the sanding model are critical
porosity, critical flow rate and erosion rate coefficient.
These parameters are calibrated using laboratory data
obtained by testing perforated rock samples.
The rate of the produced sand mass is proportional to the
specific flow rate (Detournay et al., 2006):
Fig. 4: Mobilized friction and dilation angles as a function of
EPS
After reaching the peak stress state, the rock enters the
softening stage, which is demonstrated through cohesion
degradation as shown in Fig. 5
(
Fig. 6 shows the comparison between the triaxial test
measurements and the numerical results for the sandstone
at a certain confining pressure. As seen, the constitutive
model predicts the rock behavior with reasonable
accuracy.
)
(4)
where
is the specific mass flux,
is the specific
discharge normal to the boundary,
is the critical value
of specific discharge, λ is the erosion rate coefficient, is
the rock porosity and is the grain density.
Papamichos et al. (2001) showed that using a constant
erosion coefficient may result in physically unrealistic
behavior. To improve prediction of sanding rate, they
suggested an erosion coefficient λ as a function of EPS as
follows:
{
Fig. 5: Mobilized cohesion during hardening and softening
)(
(
)
(5)
where EPSres stands for residual equivalent plastic strain
and is calculated at residual strength state.
Using the Law of Conservation of Mass, the rate of the
change of porosity is related to the rate of generated sand
mass by the equation (Detournay et al., 2006):
(6)
where is the boundary surface area of the element and
is the volume of the element.
Sand is produced at a rate given by Eq. 4 until the
porosity of the element reaches a critical value.
As the porosity increases the material becomes less
competent. This phenomenon is represented in the model
SPE 156394
5
by degrading the bulk and shear modulus with the
increasing porosity as follows:
(7)
(8)
pressure and time axes in Fig. 8 and Fig. 9 are not to
scale.
In case of a PSD, the shut-in rate is in such a way that
minimizes the resulting waterhammer pressure pulses
whereas during a UPSD the shut down periods are rapid
enough to create considerable WH pulses. Some fieldscale transient analysis data were used to estimate the WH
pressure pulses for the well under study.
After the element reaches the critical porosity, it is kept in
the mesh at residual stiffness properties to represent infill
materials.
Further details about sanding model calibration can be
found in Rahmati et al. (2011).
Finite difference mesh and boundary conditions
Fig. 7 shows a close-up of the FE mesh near the wellbore.
Two types of injection shut-downs are expected: planned
shut-down (PSD) and unplanned (or emergency) shutdown (UPSD). Fig. 8 shows the schematics of an
injection cycle with planned shut down.
Fig. 9: Schematic of UPSD with cross-flow
Depending on reservoir heterogeneity, fluid injection can
create different pressure gradients in different layers due
to differences in permeability, porosity, compressibility,
etc. Upon injection shut down, fluid may flow from high
pressure layers with low permeability to layers having a
lower pressure and usually higher permeability; a process
which is known as interlayer cross-flow. Another type of
cross-flow is the flow of fluid from the high-pressure
layer to the low-pressure layer through the wellbore. This
is called intra-well cross-flow.
Fig. 10 shows schematically a possible scenario for intrawell cross-flow. Upper layer has lower permeability and
will retain the injection pressure, which upon shutdown
will become the driving force to squeeze the injection
fluid into the lower layer with higher permeability.
Fig. 7: Close up of the FD mesh
Fig. 10: Schematic of intra-well cross-flow
Fig. 8: Schematic of PSD with cross-flow
Fig. 9 shows a schematic of a cycle with unplanned shut
down. The time intervals for various sections of the
injection/shut down cycles are selected in a way to assure
establishment of steady state flow conditions. The
Depending on differential pressures and magnitude of
fluid flow, cross-flow can have a serious impact on
sanding behavior of a well. Cross-flow is incorporated in
the injection/shut down cycles by applying a drawdown
(DD) after the shut-down period. Also, cases are
examined without the cross-flow effect, i.e., zero DD after
the shut down.
6
Basic Simulation Steps
First, in-situ stresses are initiated and the model is solved
for equilibrium. Then, reservoir pressure is reduced to
simulate the production induced depletion in the reservoir.
After depletion, multiple injection and shut-in cycles are
applied to the perforation cavity.
The model computes changes in stress, strain and any
associated degradation in strength, which along with
seepage forces may result in sand failure and production.
SPE 156394
very early and picks up quickly in this case. Although
water weakening effect might seem inevitable in injector
wells; proper measures can be taken to ensure the
compatibility of the injected water and the formation rock
to minimize the impact of this factor.
Water weakening effect
Experimental observations indicate that water contact can
have a high impact on rock strength and hence on sanding
potential of a well (Santarelli et al., 2000; Han and
Dusseault, 2002). Data from literature are used to
correlate the UCS of samples with non-native water
saturation to the UCS of dry samples. This correlation is
then used to reduce rock strength parameters accordingly
to account for water weakening effect in the numerical
simulations.
Results
The numerical model has been used to perform some
sensitivity analysis to assess the effect of various
parameters on sanding. Figures 11-13 show the results of
sensitivity analysis for one of the rocks in this study. In all
the cases, only one parameter has been changed at a time
and everything else is kept the same. In all these plots, the
horizontal axis shows the time after the start of injection
operations.
Fig. 11 shows the effect of perforation size on sanding
response. In case of a larger perforation size, sanding
starts earlier and has a considerably higher magnitude.
This points out the importance of proper perforation size
selection. Generally, the smaller the perforation size, the
less the risk and severity of sanding but care should be
taken not to compromise the well productivity in this
process. A more in-depth description of the effect of this
factor on sanding is yet to be investigated.
Fig. 12: Effect of water induced weakening on sanding
Fig. 13 demonstrates the effect of cross-flow on sanding.
Cross-flow appears to have the same effect as perforation
size in terms of pattern and magnitude. This exemplifies
the impact cross-flow can have on sanding response of
wellbores.
Fig. 13: Effect of cross-flow on sanding
The effect of rock strength on sanding behavior is shown
in Fig. 14. Three different rock types were used in this
part having different UCS values and the result are plotted
for the first, second and third year after the start of
injection operations. Such a parametric study can help the
production engineers in selecting a rock strength cut-off
below which the formation shouldn’t be perforated.
Fig. 11: Effect of perforation size on sanding
Fig. 12 shows the effect of water induced weakening on
sanding. This parameter appears to have the highest
impact on sanding response of the rock. Sanding starts
SPE 156394
7
Assuring the compatibility of the injected water
with formation rock to reduce the water
weakening effect.
Optimizing the perforation size as far as it
doesn’t compromise well productivity.
Avoiding perforation of weak layers or using
sand control devices in such layers.
Acknowledgment
We thank BP for the permission to publish this paper. The
financial support provided by NSERC is also
acknowledged.
Fig. 14: Sanding response as a function of rock UCS
Discussion and Conclusions
To provide an insight into sanding behavior of injector
wells and the effect of different parameters that contribute
to sanding, a comprehensive numerical model is
proposed. Using geomechanics principles and basic
physics of sand production, a set of criteria were
incorporated into this model for describing conditions
required for sanding initiation and propagation.
This numerical model can take into account the effects of
the following parameters on sanding behavior of
injectors:
Rock strength. Different rock types were used in this
work having different UCS values. The outcome can help
the production engineers in selecting a rock strength cutoff below which the formation shouldn’t be perforated.
Water-weakening effect. In water injectors, formation
rock may lose some of its strength due to chemical and/or
mechanical effects of water contact. This study shows that
this factor had a significant impact on sanding severity.
Cross-flow Effect. In heterogeneous reservoirs, crossflow is a very likely phenomenon after the injection shutdown. Results of this work show that this factor can have
a considerable impact on sanding behavior of wellbores.
One should note that in this work, only one parameter is
changed at a time to study the corresponding effect on
sanding. The fact is that in a real case scenario, all this
factors are present and the overall sanding response of the
formation is determined by taking into account the effect
of all the individual parameters.
Results of this study shows that considering the following
factors can be helpful in reducing the risk and severity of
sanding in injector wells:
Reducing the number of unplanned shut-ins in
order to reduce the waterhammer events.
In case of inevitable unplanned shut-ins, it is
ideal to make the shut-in time (time required to
shut down the pumps and/or close the
wellhead) as long as possible to reduce the
severity of waterhammer pulses.
Nomenclature
C&P = Cased and Perforated
DD= Drawdown
DP= Differential pressure
EPS = Equivalent Plastic Strain
EVS = Effective Vertical Stress
HECS = High Effective Confining Stress
LECS = Low Effective Confining Stress
MC = Mohr-Coulomb
PSD = Planned Shut-down
P = mean stress
q = tension cut-off
= initial yield tension cut-off
= peak tension cut-off
= residual tension cut-off
= tension cut-off at HECS
= tension cut-off at LECS
T= square root of the second invariant of the
deviatoric stress
UCS = Unconfined Compressive Strength
USD = Unplanned Shut-down
WH = Waterhammer
e jps , j 1,3 = Principal plastic shear strain increments.
= friction coefficient
H = friction coefficient at HECS
L = friction coefficient at LECS
= Friction angle
= grain density
References
Detournay, C., Tan, C., Wu, B. 2006. Modeling the
mechanism and rate of sand production using FLAC. 4th
international FLAC symposium on numerical modeling in
geomechanics, paper: 08-10.
8
Han, G. and Dusseault, M.B. 2002. A Quantitative Analysis
of Mechanisms for Water-Related Sand Production, paper SPE
73737 presented at the 2002 SPE Int. Symposium and
Exhibition on Formation Damage Control Held in Lafayette,
LA, Feb. 20-21.
Jafarpour, M., Rahmati, H., Azadbakht, S., Nouri, A, Chan,
D., Vaziri, H. (in press) Determination of Mobilized Properties
of Degrading Sandstone. Journal of Soils and Foundations.
Nouri, A. 2004. A Comprehensive Approach to Modeling
and Eliminating Sanding Problems During Oil Production. Ph.D.
dissertation, Dalhousie University, Halifax, Nova Scotia.
Nouri, A., Kuru, E., Vaziri, H. 2009. Elastoplastic modeling
of sand production using fracture energy regularization method.
Journal of Canadian Petroleum Technology, Vol. 48, No.4, pp.
64-71.
Papamichos, E., Vardoulakis, I., Tronvoll, J., Skjaerstein, A.
2001. Volumetric sand production model and experiment.
International journal for numerical and analytical methods in
geomechanics, Vol. 25, No. 8, pp. 789-808.
Rahmati, H., Nouri, A., Vaziri, H., Chan, D. (in press)
Validation of predicted cumulative sand and sand rate against
physical model test, JCPT.
Santarelli, F.J., Skomedal, E., Markestad, P., Berge, H.I. and
Nasvig, H. 2000. Sand Production on Water Injectors: How Bad
Can It Get? SPE Drill. & Completion, 15, no.2, 132.
Saucier, R.J., 1974. Considerations in Gravel Pack Design,
Journal of Petroleum Technology, Vol. 26, No.2, pp. 205-212
Vaziri, H., Nouri, A., Hovem, K., Wang, X. 2008.
Computation of Sand Production in Water Injectors. SPE
Production & Operations. Vol. 23, No. 4, pp. 518-524
Vermeer, P.A., De Borst, R., 1984: Non-Associated
Plasticity for Soils, Concrete and Rock, Heron 29, pp. 1–62.
SPE 156394