AQA PHA6B6X QP JUN14
Bạn đang xem bản rút gọn của tài liệu. Xem và tải ngay bản đầy đủ của tài liệu tại đây (847.49 KB, 12 trang )
Centre
Number
Candidate
Number
Surname
Other
Names
For Examiner’s Use
Notice to Candidate. The work you submit for assessment must be your own. If you copy from someone
else or allow another candidate to copy from you, or if you cheat in any other way, you may be disqualified.
Candidate Declaration. I have read and understood the Notice to Candidate and can confirm that
I have produced the attached work without assistance other than that which is acceptable under the scheme
of assessment.
Candidate
Signature
Date
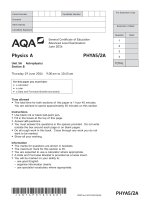
General Certificate of Education
Advanced Level Examination
June 2014
Physics
(Specifications A and B)
PHA6/B6/X
Unit 6
Investigative and Practical Skills in A2 Physics
Route X Externally Marked Practical Assignment (EMPA)
Section B
Written Test
Examiner’s Initials
Section
Mark
Section A
Task 1 Q1
Section A
Task 1 Q2
Section A
Task 2 Q1
Section B
Q1
Section B
Q2
Section B
Q3
TOTAL
For this paper you must have:
l your completed Section A Task 2 question paper /
answer booklet.
l a ruler
l a pencil
l a calculator.
Instructions
l Use black ink or black ball-point pen.
l Fill in the boxes at the top of this page.
l Answer all questions.
l You must answer the questions in the space provided. Do not
write outside the box around each page or on blank pages.
l Show all your working.
l Do all rough work in this book. Cross through any work you do
not want to be marked.
Time allowed
l 1 hour 15 minutes
Information
l The marks for questions are shown in brackets.
l The maximum mark for this paper is 25.
Details of additional assistance (if any). Did the candidate receive any help or information in the production of this
work? If you answer yes, give the details below or on a separate page.
Yes
No
Practical Skills Verification
Teacher Declaration: I confirm that the candidate has met the
requirement of the practical skills verification (PSV) in accordance
with the instructions and criteria in section 3.8 of the specification.
Yes
Signature of teacher ................................................................................................................... Date ..........................................
As part of AQA’s commitment to assist students, AQA may make your coursework available on a strictly anonymous basis to teachers,
examining staff and students in paper form or electronically, through the Internet or other means, for the purpose of indicating a typical mark
or for other educational purposes. In the unlikely event that your coursework is made available for the purposes stated above, you may
object to this at any time and we will remove the work on reasonable notice. If you have any concerns please contact AQA.
To see how AQA complies with the Data Protection Act 1988 please see our Privacy Statement at aqa.org.uk.
WMP/Jun14/PHA6/B6/X/E5
PHA6/B6/X
Do not write
outside the
box
2
Section B
Answer all the questions in the spaces provided.
Time allowed 1 hour 15 minutes.
You will need to refer to the work you did in Section A Task 2 when answering these questions.
1 (a) (i)
1
T
Determine the gradient, G, of your graph (Figure 6) of (√(l + x) – √l ) against – .
[2 marks]
..........................................................................................................................................
..........................................................................................................................................
G = ..................................................................
G
x
1 (a) (ii) Evaluate –– .
[2 marks]
..........................................................................................................................................
..........................................................................................................................................
G = ..................................................................
––
x
1 (b)
Figure 7 on page 3 shows a side view and a front view of the apparatus you used in
Section A Task 2.
Add suitable annotation to either or both of these views to indicate:
1 (b) (i)
where you positioned the fiducial mark in order to measure T
1 (b) (ii) the position from which you viewed the oscillations of the pendulum.
[2 marks]
WMP/Jun14/PHA6/B6/X
Do not write
outside the
box
3
Figure 7
side view
front view
Turn over
WMP/Jun14/PHA6/B6/X
ᮣ
4
1 (c)
Do not write
outside the
box
Students A and B make systematic errors when carrying out the experiment.
Student A makes accurate measurements to determine l and T but records a value for
x that is too large.
Student B makes accurate measurements to determine l and x but (when measuring
T ) consistently thinks that 20 oscillations are being counted but the time recorded is for
only 19 oscillations.
Explain what effect these systematic errors have:
1 (c) (i)
on the graph that student A plots
[2 marks]
...........................................................................................................................................
...........................................................................................................................................
...........................................................................................................................................
...........................................................................................................................................
...........................................................................................................................................
...........................................................................................................................................
1 (c) (ii) on the graph that student B plots.
[2 marks]
...........................................................................................................................................
...........................................................................................................................................
...........................................................................................................................................
...........................................................................................................................................
...........................................................................................................................................
...........................................................................................................................................
1
T
1 (c) (iii) The students are told that (√(l + x) – √l ) is directly proportional to –.
Suggest why the systematic error made by student A is easier to discover than that
made by student B.
[1 mark]
...........................................................................................................................................
...........................................................................................................................................
...........................................................................................................................................
WMP/Jun14/PHA6/B6/X
11
Do not write
outside the
box
5
2
By modifying the circuit you used in Question 2 of Section A Task 1 a student designs
a capacitance meter. The circuit used by the student is shown in Figure 8.
Figure 8
switch S
L
input sockets
switch P
R
V
digital
voltmeter
C=
1000 μF
A capacitor of unknown capacitance is connected to the input sockets.
Switch S is moved to position L and switch P is briefly pressed, then the voltmeter
reading, V0 , is recorded. When switch S is moved to position R the voltmeter reading
falls to a new value, V.
C×V
The capacitance of the unknown capacitor, is given by CU = ––––––– where
V0 – V
C = 1000 μF for the circuit in Figure 8.
2 (a)
Suggest why a digital voltmeter (rather than an analogue voltmeter) should be used.
[1 mark]
..........................................................................................................................................
..........................................................................................................................................
2 (b)
The 1000 μF capacitor may differ by up to 20% from its stated value.
For a certain unknown capacitance, CU, V0 is 6.0 V ± 0.1V and V is 2.3 V ± 0.1V.
Determine the largest possible capacitance, CU.
[2 marks]
largest possible capacitance, CU = ..................................................................
Turn over
WMP/Jun14/PHA6/B6/X
ᮣ
6
2 (c)
Do not write
outside the
box
Figure 9 shows a circuit that can be used to determine the capacitance of an
unknown capacitor.
Figure 9
resistor of
resistance R
electronic
oscillator
input sockets
When a capacitor of capacitance C is connected to the input sockets, the LED flashes
at a steady frequency, f, which depends on C and R.
If R is known and f is measured, C can be found using the chart in Figure 11:
instructions on the use of this chart are given at the bottom of page 7.
The student makes three measurements of the time for 5 flashes of the LED
when R = 5.0 kΩ.
Figure 10
LED on
LED off
time
time for 5 complete flashes
time for 5 flashes of the LED/s
47.6
46.4
46.7
Use the student’s measurements to determine C, showing clearly on Figure 11 how
you arrived at your result.
..........................................................................................................................................
..........................................................................................................................................
C = ..................................................................
[3 marks]
WMP/Jun14/PHA6/B6/X
6
Do not write
outside the
box
7
Figure 11
C
frequency
R
0.01 Hz
1000 μF
10 kΩ
0.1 Hz
1 Hz
1 kΩ
100 μF
10 Hz
The dotted line joining the three scales in Figure 11 shows the capacitance that can
be found when the values of R and f are known, eg when R is 10 kΩ and f is 1.0 Hz,
the capacitance is just less than 50 μF.
Turn over
WMP/Jun14/PHA6/B6/X
ᮣ
8
3
Do not write
outside the
box
An experiment is carried out to determine the specific heat capacity of water using the
apparatus shown in Figure 12.
Figure 12
Connections to
external circuit
Electrical heater
Connection to
data logger
Temperature sensor
Water
Vacuum flask
Energy is supplied to the water using an electrical heater.
Heat loss to the surroundings is minimised by placing the water in a
vacuum flask.
The temperature of the water is determined using a temperature sensor connected to
a data logger.
The procedure is as follows.
l The mass of the water is determined using a balance.
l The heater is connected to a circuit that allows measurements to be made so that
the mean power supplied to the heater can be calculated.
l Data logging starts as the heater is switched on.
l The heater is switched off after 500 s.
l Data logging ends after 800 s.
3 (a)
If the sample rate of the data logger = 0.05 Hz, how many samples are recorded while
data are being sent to the data logger?
[1 mark]
..........................................................................................................................................
..........................................................................................................................................
number of samples = ..................................................................
WMP/Jun14/PHA6/B6/X
Do not write
outside the
box
9
3 (b) (i)
Complete the diagram in Figure 13 to show the circuit that should be connected to
the heater.
[1 mark]
Figure 13
heater
3 (b) (ii) During the experiment it is noticed that the measurements being made to determine
power are not steady.
Explain how the mean power transformed in the heater should be determined.
[1 mark]
..........................................................................................................................................
..........................................................................................................................................
..........................................................................................................................................
..........................................................................................................................................
..........................................................................................................................................
..........................................................................................................................................
Turn over
WMP/Jun14/PHA6/B6/X
ᮣ
10
3 (c)
The data collected in the experiment are displayed on the graph of temperature, θ,
against time, t, shown in Figure 14.
Figure 14
34
32
30
28
θ / °C
26
24
22
20
0
3 (c) (i)
100 200 300 400 500 600 700 800
t/s
Why does the temperature indicated by the temperature sensor continue to increase
after the heater is switched off at t = 500s?
[1 mark]
..........................................................................................................................................
..........................................................................................................................................
..........................................................................................................................................
WMP/Jun14/PHA6/B6/X
Do not write
outside the
box
Do not write
outside the
box
11
3 (c) (ii) In the experiment represented in Figure 14
the mass of water in the flask
= 119 g
the mean power supplied to the heater = 15.2 W.
Use this information together with Figure 14 to determine the specific heat capacity of
the water.
You may wish to use the equation Q = mcΔθ.
Note that the graph in Figure 14 is linear between t = 180 s and t = 400 s.
[3 marks]
specific heat capacity = .................................................................. J kg–1 K–1
3 (c) (iii) Comment on any discrepancy between your result for the specific heat capacity of
water and the accepted value of 4180 J kg–1 K–1 .
[1 mark]
..........................................................................................................................................
..........................................................................................................................................
..........................................................................................................................................
END OF QUESTIONS
8
WMP/Jun14/PHA6/B6/X
12
There are no questions printed on this page
DO NOT WRITE ON THIS PAGE
ANSWER IN THE SPACES PROVIDED
Copyright © 2014 AQA and its licensors. All rights reserved.
WMP/Jun14/PHA6/B6/X