2016 gmac application trends web release v2
Bạn đang xem bản rút gọn của tài liệu. Xem và tải ngay bản đầy đủ của tài liệu tại đây (711.56 KB, 68 trang )
The premier provider of market intelligence
2016
Application Trends
Survey Report
ABOUT THIS STUDY
The Application Trends Survey is a product of the Graduate Management Admission Council® (GMAC®),
a nonprofit organization of 216 leading graduate business schools from around the world actively
committed to advancing the art and science of admissions. The Council provides the solutions
necessary for business schools and candidates to discover and evaluate one another to ensure that
talent never goes undiscovered. GMAC owns and administers the Graduate Management Admission
Test® (GMAT®), used by more than 6,100 graduate programs worldwide, as well as the NMAT by GMAC™
exam, used for entrance into graduate management programs in India. The Council is based in Reston,
Va., with offices in London, New Delhi, and Hong Kong.
EXPLORE DATA WITH INTERACTIVE AND BENCHMARK REPORTS
An Interactive Data Report and an online Benchmark Report tool accompany the 2016 Application
Trends Survey Report, available exclusively to schools that participated in the survey. The Interactive
Data Report is an online tool that lets users customize data searches by multiple survey response
variables such as application volume trends, applicant pool composition, candidate citizenship, and
more. The Benchmark Report tool allows schools to benchmark their program’s responses against
aggregated response from their peers.
RESEARCH INSIGHTS
For additional coverage and analysis of findings from the 2016 Application Trends Survey, visit GMAC’s
Research Insights, a new online platform created by GMAC’s Research Services Department to provide
schools and industry professionals with greater access to timely, relevant, and data-driven insights on
trends affecting graduate management education. Research Insights resides on the GMAC website at
gmac.com/researchinsights. Topics cover every step of the student lifecycle—from candidates’ first
consideration of business school to alumni’s career progression.
BE A PARTNER IN OUR SURVEY RESEARCH
Graduate business schools that participate in GMAC’s survey research receive:
•
Early-Release Survey Reports that summarize key findings and their implications for the industry,
with year-on-year trends;
•
Interactive Data Reports that offer survey participants multiple ways to create customized views
of detailed demographic data most relevant to your program; and
•
Benchmark Reports—a free online tool that lets schools generate instant reports comparing your
survey results against those of your peer schools.
VISIT GMAC.COM/SURVEYSIGNUP TO PARTICIPATE
Note: The Interactive Data Report is best viewed in Internet Explorer 10+, Google Chrome, Safari, or iOS browsers.
This summary report and a list of participating institutions are publicly available at gmac.com/applicationtrends.
©2016 Graduate Management Admission Council® (GMAC®). All rights reserved.
2016 Application Trends Survey Report
Contents
EXECUTIVE SUMMARY ................................................................................. 2
Trends for Graduate Management Programs ................................ 2
Historical View of Application Volume ............................................ 3
Key Findings .................................................................................................4
Overview of the Survey Report ...........................................................6
TRENDS FOR MBA PROGRAMS ................................................................ 7
Full-Time Two-Year MBA........................................................................ 7
Full-Time One-Year MBA ...................................................................... 13
Part-Time MBA .......................................................................................... 19
Flexible MBA ............................................................................................. 23
Online MBA ................................................................................................ 29
Executive MBA ......................................................................................... 33
TRENDS FOR NON-MBA MASTER’S PROGRAMS .......................... 39
Master in Management.......................................................................... 39
Master of Accounting ............................................................................ 45
Master of Finance ..................................................................................... 51
Master in Data Analytics ...................................................................... 57
ABOUT THE SURVEY ................................................................................... 61
Methodology .............................................................................................. 61
Participant Profile ................................................................................... 62
Regional Location of Survey Respondents ................................. 63
Interactive Tools for Schools ............................................................. 63
Research Insights .................................................................................... 63
CONTACT INFORMATION ........................................................................ 64
Contributors............................................................................................... 64
Acknowledgements................................................................................ 64
©2016 Graduate Management Admission Council® (GMAC®). All rights reserved.
1
2
2016 Application Trends Survey Report
Executive Summary
Trends for Graduate Management Programs
Graduate degrees in business and management continue to be the most common master’s-level
degrees awarded in the United States, 1 and presumably around the world, even as application volumes
for these degree programs have stabilized in recent years. According to business schools that
responded to GMAC’s 2016 Application Trends Survey, more programs report growing application
volumes for the 2016–2017 class year compared with those reporting declining volumes. Still, global
application volume growth in 2016 is limited to less than half of the reporting programs, though most
programs received enough qualified applicants to fill their classrooms.
Recent trends for graduate business programs have been atypical compared with past economic cycles.
During the recession of the early 2000s, application volumes increased and then declined, hitting
bottom in 2004. Application volumes grew once again, reaching a new peak in the midst of the ‘Great
Recession’ in 2008. It appeared that application volumes would follow past recessionary periods;
however, the expected post-recessionary decline in volumes was neither as rapid nor as deep as before.
Application volumes have been mixed in recent years, with smaller programs tending to receive fewer
applications and larger programs experiencing growth. This environment makes year-on-year changes
in application volumes harder to predict.
Some survey participants suggest the slow economic recovery has dampened students’ perspectives
about their future. Said one respondent, “Students are less sure about their professional futures and
therefore many are not willing to commit to investing in an MBA program at this time.” Other schools
point to the proliferation of and diversity of business programs, including growth in high-quality
programs, as a source of increased competition. As one respondent observes, “The competitive
landscape has changed—there are a lot of business schools, giving potential students more choices.”
These choices include more non-MBA business master’s programs and new MBA program formats, such
as the online MBA, which are generating upward pressure on volumes. For example, survey responses
this year show nine percent of online programs are new in 2017. Other growth areas include Master in
Data Analytics programs (36% are new in 2017), Master of Supply Chain Management (19% are new in
2017), and Master of Marketing (16% are new in 2017). Yet this competition continues to add downward
pressure on volume growth for flagship programs such as the full-time two-year MBA and part-time
MBA.
Business degrees continue to be one of the most sought-after educational credentials—creating upward
pressure on application volumes. The proliferation of programs has created a more competitive
environment, resulting in fewer applications for individual programs. Findings presented in this report
are a snapshot of the state of graduate management education; representing but one chapter in an
ongoing industry story.
1
NCES. Digest of Education Statistics 2015: />
©2016 Graduate Management Admission Council® (GMAC®). All rights reserved.
2016 Application Trends Survey Report
Historical View of Application Volume
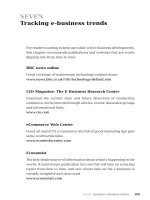
Trends in Graduate Management Education Application Volumes, by Program Type, 2000–2016
Scale: Relative change in application volume over time, where -3 indicates significant decline in volume compared with the previous
year, 0 indicates no change from the previous year, and +3 indicates significant increase compared with the previous year.
Full-Time MBA Programs (Combined)
Part-Time MBA Programs (Combined)
3
3
2
2
1
1
0
0
-1
-1
-2
-2
-3
'00 '01 '02 '03 '04 '05 '06 '07 '08 '09 '10 '11 '12 '13 '14 '15 '16
-3
'00 '01 '02 '03 '04 '05 '06 '07 '08 '09 '10 '11 '12 '13 '14 '15 '16
Flexible MBA
Executive MBA
3
3
2
2
1
1
0
0
-1
-1
-2
-2
-3
-3
'05 '06 '07 '08 '09
'10
'11
'12
'13
'14
'15
'04 '05 '06 '07 '08 '09 '10
'16
Online MBA
3
2
2
1
1
0
0
-1
-1
-2
-2
-3
-3
'09
'10
'11
'12
'13
'14
'15
'08
'16
'09
'10
Master of Accounting
3
2
2
1
1
0
0
-1
-1
-2
-2
-3
-3
'09
'10
'11
'12
'13
'14
'15
'16
'13
'11
'12
'13
'14
'15
'16
'14
'15
'16
Master of Finance
3
'08
'12
Master in Management
3
'08
'11
'14
'15
'16
'08
'09
'10
'11
'12
'13
Source: Data for 2000 to 2015 are from GMAC Application Trends Surveys conducted in those years. Data for 2016 are from the 2016 Application Trends Survey.
©2016 Graduate Management Admission Council® (GMAC®). All rights reserved.
3
4
2016 Application Trends Survey Report
Key Findings
More graduate business programs report growth in application volumes compared with those showing
declining volumes for 2016.
•
Nearly half (49%) of all graduate business programs received more applications in 2016 compared
with 2015, while 43 percent received fewer. Eight percent of programs report no change in volumes
for 2016 compared with 2015.
•
Large graduate business programs—those with 50 or more students—are more likely than small
programs to report application volume growth this year. More than half (55%) of large programs
received more applications this year compared with 43 percent of small programs that also grew
their volumes.
•
More than half (52%) of all graduate business programs are expanding their incoming class size for
2016. Growth in program size appears to be in response to application volumes: Seventy percent of
the programs with increased application volumes plan to increase their class size by a median of
eight students. On the other hand, 53 percent of programs that report declining application volumes
plan to reduce their class size by an average of seven students.
•
European programs offer a bright spot in this year’s findings. Across all program types combined,
65 percent of European programs grew their application volumes compared with 46 percent of US
programs and 41 percent of programs in East and Southeast Asia that did so. 2
Full-time MBA programs exhibit mixed results in 2016. A majority of full-time one-year MBA programs
report an increase in applications compared with less than half of full-time two-year MBA programs.
•
For the first time since 2012, less than half of full-time two-year MBA programs (43%) experienced
year-on-year application growth this year. This is the second straight year that the share of
programs reporting growth is down from a high of 61 percent in 2014.
•
Trends for full-time two-year MBA programs differ by program size. A majority (57%) of programs
with enrollments of more 120 students report a year-on-year increase in application volumes
compared with less than half of small (33%) and mid-sized (40%) programs.
•
Although acceptance rates show that larger programs are more competitive for gaining entry,
programs of varying class size have similar enrollment rates, with a median yield of 52 percent for
full-time two-year MBA programs.
•
These large full-time two-year MBA programs are also more likely than small programs to report
application growth from both domestic and international candidates and from both men and
women. In the United States, large programs also are more likely than small programs to report
application growth from underrepresented minority populations, such as African Americans and
Hispanic Americans.
•
A majority of full-time one-year MBA programs (57%) report growing application volumes this year,
building upon the momentum of last year’s results when 51 percent reported growth.
•
European full-time one-year MBA programs are a bright spot in this year’s findings—nearly 3 in 4
(74%) programs report year-on-year increases in application volumes. In contrast, just 43 percent of
2
For a list of countries represented by participating programs see Regional Location of Survey Respondents at the end of this report.
©2016 Graduate Management Admission Council® (GMAC®). All rights reserved.
2016 Application Trends Survey Report
US-based programs and 45 percent of programs in East and Southeast Asia report growth in the
full-time one-year MBA market.
Though professional MBA programs overall continue to lag in application volume growth, executive
MBA and online MBA programs report stronger numbers this year. 3
•
For the second consecutive year, a majority (57%) of online MBA programs report growing
application volumes, up from 50 percent of programs that reported volume growth last year.
•
For the first time since 2008, a majority (51%) of executive MBA programs report growing volumes,
eight percentage points higher than programs that reported growing volumes in 2015.
•
Part-time MBA programs in 2016 continue to exhibit the same application volume patterns seen
over the past seven years since the end of the Great Recession. This year, 43 percent of programs
report volume growth compared with 50 percent report declining volume.
•
Flexible MBA programs did not sustain the momentum begun last year when a majority of programs
(54%) grew their application volumes. In 2016, 44 percent report application volume growth.
•
Despite lagging volume growth for professional MBA programs, large-sized programs are seeing
higher volumes in 2016 compared with smaller programs—similar to the full-time MBA market.
Application volumes for non-MBA business master’s programs are a study in contrasts for 2016.
•
After three years of slowing growth, the Master in Management program holds steady in 2016 with a
majority (51%) of programs reporting growing application volumes. More European programs (58%)
report growth compared with half (50%) of US-based programs.
•
For the second year in a row, a majority of Master of Finance programs report growing volumes.
European programs (65%) are more likely than US-based programs (55%) to report growth.
•
Master of Accounting programs continue a trend of declining growth begun in 2013. Less than half
(44%) of programs experienced rising application volumes in 2016.
•
One of the newest programs in the graduate management education space—Master in Data
Analytics—continues to see growing demand. Nearly all (94%) of the 16 data analytics programs
that submitted application trends data comparing volumes from this year to last year report
application volume growth in 2016.
Schools continue to diversify their outreach and recruitment efforts to broaden their appeal to
targeted candidate segments.
•
Seventy percent of full-time two-year MBA programs recruit international candidates. These
candidates also are a priority for outreach and recruitment by a majority of full-time one-year MBA
programs and master’s programs in management and finance.
•
China, India, and the United States are the top three countries where these programs recruit
international candidates.
3
Professional MBA programs include those geared toward the needs of working professionals and include part-time, online, executive, and
flexible MBA programs.
©2016 Graduate Management Admission Council® (GMAC®). All rights reserved.
5
6
2016 Application Trends Survey Report
Merit scholarships are most common form of tuition assistance for full-time MBA programs.
•
The most common form of tuition assistance that graduate management programs offer is merit
scholarships. The majority of all program types offer such financial aid, including 80 percent of fulltime MBA programs.
•
More than 1 in 4 students entering Master of Accounting programs (31%), full-time two-year MBA
and full-time one-year MBA programs (27% each) will receive merit scholarships this year.
•
Smaller percentages of business school programs offer assistantships, reduced tuition, and needbased scholarships.
Share of incoming students expecting some employer funding is on par with last year.
•
Two-thirds of programs (69%) report that the percentage of their incoming students receiving
employer tuition reimbursement this year will be similar to 2015.
•
Eighteen percent of programs expect more students will receive employer funding in 2016, yet 13
percent expect fewer students will have such funding.
•
Nearly all professional MBA programs (99%) report that some portion of their incoming students
will receive tuition funding (in full or in part) from their current employer.
Overview of the Survey Report
The 2016 Application Trends Survey Report includes analysis of data submitted by a record number of
872 graduate business programs located at 335 universities worldwide. Survey responses reflect the
following program types: 509 MBA programs, 344 non-MBA business master’s programs (which
includes one nonbusiness master’s program), 19 doctoral programs, and 3 joint-degree programs.
Participating programs are located in 49 countries, including 42 US states and the District of Columbia.
This report highlights trends in 2016 application volumes for the following 10 most common graduate
business programs, which also had the highest survey response rate: full-time two-year MBA and fulltime one-year MBA; part-time, flexible, online, and executive MBA; and master’s programs in
management, accounting, finance, and data analytics. Featured topics for each program type include:
•
Application volume trends for 2016 compared with 2015,
•
Applicant pool composition, highlighting citizenship and gender, and
•
Targeted candidate outreach, tuition assistance, and employer funding.
An international candidate refers to any applicant whose citizenship differs from that of the
country where the program is located.
A domestic candidate refers to any applicant who is a citizen of the country where a program
is located.
©2016 Graduate Management Admission Council® (GMAC®). All rights reserved.
2016 Application Trends Survey Report
Trends for MBA Programs
Full-Time Two-Year MBA
Forty-three percent of full-time two-year MBA programs report receiving more applications this year
compared with 2015, compared with 48 percent that report a decline in volume for 2016. This is the first
time in four years that less than half of full-time two-year MBA programs experienced growing
application volume and the second straight year that the number of programs reporting growth is down
from a high of 61 percent in 2014. Forty percent of full-time two-year MBA programs in the United
States and 45 percent of such programs in East and Southeast Asia report application volume growth in
2016 (Figures 1 and 2). 4
Trends in full-time two-year MBA application volumes differ by program size. 5 A majority (57%) of large
programs report increased volumes this year compared with small (33%) and mid-sized (40%)
programs. This pattern holds true when measured by various applicant demographics. Large programs
are more likely than smaller programs to report application growth from domestic, international, male,
and female candidates. The greatest difference is seen in application volume from female applicants—75
percent of large full-time two-year MBA programs report growth in applications from women compared
with 45 percent of mid-sized and 42 percent of small programs. Among programs in the United States,
the majority of large (75%) and mid-sized (55%) programs report growing volumes among
underrepresented populations 6 compared with 38 percent of small programs.
Acceptance rates for 2016 show that large full-time two-year MBA programs tend to be more
competitive than mid-sized and small programs. On average, large programs receive more applications
per available seat (median of 7.8 applications per seat) compared with mid-sized (4.3) and small (3.5)
programs. Globally, all full-time two-year MBA programs report receiving enough applications to fill
their 2016–2017 classes. Though small programs report higher acceptance rates compared with large
programs, the enrollment rate (application yield) is fairly consistent regardless of program size—a
median of 52 percent of accepted students is expected to enroll in 2016 (Table 1).
Table 1. Application Summary Data for Full-Time Two-Year MBA Programs, 2016*
133
Number of programs
Total number of applications (median)
335
2016–2017 estimated class size (median)
78
Applications per seat (median)
4.5
Estimated acceptance rate† (median)
42%
Estimated enrollment rate†† (median)
52%
*Data reflect applications received as of June 30, 2016.
†Acceptance rate equals the number of acceptance offers divided by the number of total completed applications, multiplied by 100.
††Enrollment rate equals the number of accepted applicants who enroll divided by the number of all accepted applicants, multiplied by 100.
Source: GMAC (2016) Application Trends Survey.
Data for full-time two-year MBA programs in other world regions are not reported due to insufficient response (N < 10).
Program sizes for full-time MBA programs, as defined by 2016 survey data, are categorized as follows: large, more than 120 students; midsized, 54 to 120 students; and small, 53 or fewer students.
6
The term ‘underrepresented populations’ includes the following US citizen groups who are considered an underrepresented racial or ethnic
minority in the US business school pipeline: Hispanic Americans or Latino, Black or African American, Native Hawaiian or Pacific Islander, and
American Indian or Alaska Native. Asian Americans are not considered an underrepresented population in graduate management education.
4
5
©2016 Graduate Management Admission Council® (GMAC®). All rights reserved.
7
2016 Application Trends Survey Report
The 2016 survey sample includes 133 full-time two-year MBA programs from 16 countries. Three in 4
(75%) programs are located in the United States, across 32 states and the District of Columbia. About 1
in 10 (9%) participating full-time two-year MBA programs offer a portion of their coursework online.
Figure 1. Full-Time Two-Year MBA Programs Reporting Change in Application Volume, 2012–2016
Up
Down
Flat
100%
Percentage of programs
80%
51%
35%
46%
39%
4%
60%
6%
40%
20%
48%
4%
4%
9%
43%
50%
2012
2013
61%
57%
2014
2015
43%
0%
2016
Full-time two-year MBA
Source: Data for 2012 to 2015 are from GMAC Application Trends Surveys conducted in those years. Data from 2016 are from the 2016 GMAC
Application Trends Survey.
Figure 2. Full-Time Two-Year MBA Programs Reporting Change in Application Volume 2016 vs. 2015,
by School Location*
Up
Percentage of programs
8
Flat
Down
100%
80%
60%
36%
18%
7%
40%
20%
53%
45%
40%
East & Southeast Asia
United States
0%
Full-time two-year MBA
*Percentages in some columns may not sum to 100 due to rounding.
Source: GMAC (2016) Application Trends Survey.
GENDER
Globally, women represent 37 percent of full-time two-year MBA program applicants (a drop from 40%
last year) and men represent 63 percent of the applicant pool for the incoming 2016–2017 class (a three
percent increase over 2015). Overall, 54 percent of full-time two-year MBA programs report increasing
application volumes for women in 2016 compared with 2015, and 43 percent report growing application
volume for men (Figure 3).
©2016 Graduate Management Admission Council® (GMAC®). All rights reserved.
2016 Application Trends Survey Report
Figure 3. Full-Time Two-Year MBA Applicant Pool, by Gender, 2016
Gender Distribution (%)
% of Programs Reporting Change in Application
Volume 2016 vs. 2015, by Gender*
Up
Flat
Down
Female
37%
Male
63%
Percentage of programs
100%
80%
35%
48%
60%
40%
20%
11%
9%
54%
43%
0%
Male
Female
Full-time two-year MBA
Source: GMAC (2016) Application Trends Survey.
CITIZENSHIP
For the incoming class of 2016–2017, the majority of applicants seeking admission to full-time two-year
MBA programs are international candidates, representing 52 percent of the applicant pool. Domestic
candidates account for the remaining 48 percent of applicants (Figure 4). Overall, 47 percent of fulltime two-year MBA programs report increased application volumes for domestic candidates this year
compared with 2015; 42 percent of programs report increased application volume for international
candidates.
Figure 4. Full-Time Two-Year MBA Applicant Pool, by Citizenship, 2016
Applicant Pool, by Citizenship (%)
% Programs Reporting Change in Application
Volume 2016 vs. 2015, by Citizenship
International
52%
Domestic
48%
Percentage of programs
100%
80%
60%
Up
Flat
Down
34%
42%
19%
16%
40%
20%
47%
42%
Domestic
International
0%
Full-time two-year MBA
Source: GMAC (2016) Application Trends Survey.
©2016 Graduate Management Admission Council® (GMAC®). All rights reserved.
9
2016 Application Trends Survey Report
A majority of applicants to full-time two-year MBA programs come from the following world regions:
United States, Central and South Asia, and East and Southeast Asia (Figure 5).
Figure 5. Global Distribution of Full-Time Two-Year MBA Applicants, by School Location and Applicant
Citizenship, 2016
Percentage of applicants
10
School Location
79%
Global
United States
47%
East & Southeast
Asia
36%
24%21%
5%
2%
United
States
22%
19%
5% 3%
1%
3% 4% 2%
Latin
America
Middle
East
Central &
East &
South Asia Southeast
Asia
3% 2%
7%
2% 1% 1%
2% 1% 2%
1% 1% 1%
0% 1% 0%
Canada
Western
Europe
Eastern
Europe
Australia &
Pacific
Islands
Africa
Citizenship
Source: GMAC (2016) Application Trends Survey.
Table 2 displays the top countries from which full-time two-year MBA programs received the greatest
number of international applications, and saw both the greatest increase and the greatest decrease in
international applications.
Table 2. Top Sources of International Candidates, Greatest Number, Increase, and Decrease, 2016*
Full-Time Two-Year MBA
Greatest Number
India
China
United States
Saudi Arabia
Greatest Increase
Greatest Decrease
India
China
China
India
Brazil
Taiwan
Nigeria
South Korea
Vietnam
Saudi Arabia
*Countries shown were mentioned five or more times by program type and are shown in descending order of mentions.
Source: GMAC (2016) Application Trends Survey.
RECRUITMENT AND OUTREACH
Overall, 95 percent of full-time two-year MBA programs conduct special outreach and recruitment
efforts among a variety of targeted population groups. Seventy percent of full-time two-year MBA
programs recruit international candidates, primarily in China, India, and the United States. Other
countries include Brazil, Colombia, Japan, Mexico, South Korea, and Vietnam. (Figure 6).
©2016 Graduate Management Admission Council® (GMAC®). All rights reserved.
2016 Application Trends Survey Report
Figure 6. Percentage of Full-Time Two-Year MBA Programs Conducting Special Outreach, by
Candidate Type, 2016*
International candidates
70%
Women
68%
Military
56%
Underrepresented US populations
50%
Working professionals
46%
Undergraduates (general)
46%
LGBT community
36%
Business undergraduates
34%
Occupational specialties
30%
Nonbusiness undergraduates
25%
Pre-experience candidates
21%
Underrepresented nationalities
20%
Entrepreneurs
18%
Percentage of programs
*Percentages do not sum to 100 due to multiple selections.
Source: GMAC (2016) Application Trends Survey.
TUITION ASSISTANCE
Most full-time two-year MBA programs offer some type of tuition assistance. Figure 7 shows the
percentage of students enrolled for the 2016–2017 class year who will receive school-based tuition
assistance, by funding type. Merit scholarships top the list of tuition assistance offered.
Figure 7. Percentage of Enrolled Students in Full-Time Two-Year MBA Programs Who Will Receive
Tuition Assistance, 2016*
Merit scholarships
27%
Fellowships
6%
Assistantships
5%
Need-based scholarships
4%
Stipend
2%
Reduced tuition
2%
On-campus work-study
1%
Percentage of enrolled students
*The percentage of enrolled students who will receive tuition assistance was calculated by multiplying the projected class size by the estimated
percentage of students who will receive financial aid at the record level, then summing the total number of students across all programs who
will be receiving funding, and dividing by the total number of students in the given program type.
Source: GMAC (2016) Application Trends Survey.
©2016 Graduate Management Admission Council® (GMAC®). All rights reserved.
11
2016 Application Trends Survey Report
EMPLOYER FUNDING
In 2016, 72 percent of full-time two-year MBA programs estimate that their students will receive tuition
reimbursement (in part or in whole) from their current employer. Figure 8 shows the estimated amount
of financial assistance that full-time two-year MBA programs expect their enrolled students will receive
this year from their current employer. Twenty-one percent of programs expect that the share of
students receiving employer funding will increase in 2016 compared with last year, while 13 percent of
programs expect to see declines in the share of students receiving employer funding.
Figure 8. Percentage of Enrolled Students in Full-Time Two-Year MBA Programs Expected to Receive
Employer Funding, 2016
47%
Percentage of programs
12
28%
11%
10%
1%
None
1-9%
3%
1%
0%
0%
0%
0%
10-19% 20-29% 30-39% 40-49% 50-59% 60-69% 70-79% 80-89% 90-99%
Percentage of students with employer funding
Source: GMAC (2016) Application Trends Survey.
©2016 Graduate Management Admission Council® (GMAC®). All rights reserved.
0%
100%
2016 Application Trends Survey Report
Full-Time One-Year MBA
For the second year in a row, a majority of full-time one-year MBA programs report receiving more
applications compared with the previous year—57 percent report volume growth in applications in 2016
compared with 51 percent in 2015. By world region, application volume growth for full-time one-year
MBA programs is driven primarily by programs located in Europe. Three in 4 (74%) full-time one-year
MBA programs in Europe report growing application volumes compared with 45 percent of East and
Southeast Asia-based programs and 43 percent of US-based programs (Figures 9 and 10). 7
International candidates are the driving force behind this year’s application growth in European full-time
one-year MBA programs. In fact, 89 percent of applications to European full-time one-year MBA
programs are submitted by international candidates compared with 62 percent for programs in East and
Southeast Asia, and just 38 percent for US-based programs. The international candidate pools for
European and East and Southeast Asia-based programs differ in citizenship status. The majority of
international applicants to European programs are non-European candidates, whereas international
candidates to full-time one-year MBA programs in East and Southeast Asia tend to come from within
the greater Asia-Pacific region. The majority of applicants to US-based programs are domestic
candidates (US citizens). Notably, 55 percent of US-based full-time one-year MBA programs report
growing domestic volumes for 2016.
Prior years of work experience is another demographic variable that distinguishes candidates to fulltime one-year MBA programs based on world region. The majority of applicants to US-based programs
have less than three years of prior work experience, whereas candidates applying to programs both in
Europe and East and Southeast Asia tend to have more than three years of work experience.
This year’s survey includes responses received from 105 full-time one-year MBA programs situated in 30
countries (Table 3). Curriculum delivery for the majority of full-time one-year programs is classroombased. Eighteen percent of programs offer a small portion (typically less than 10%) of coursework
online.
Table 3. Application Summary Data for Full-Time One-Year MBA Programs, 2016*
105
Number of programs
Total number of applications (median)
119
2016–2017 estimated class size (median)
45
Applications per seat (median)
2.7
Estimated acceptance rate† (median)
53%
Estimated enrollment rate†† (median)
62%
*Data reflect applications received as of June 30, 2016.
†Acceptance rate equals the number of acceptance offers divided by the number of total completed applications, multiplied by 100.
††Enrollment rate equals the number of accepted applicants who enroll divided by the number of all accepted applicants, multiplied by 100.
Source: GMAC (2016) Application Trends Survey.
7
Data for full-time one-year MBA programs in other world regions are not reported due to insufficient response (N < 10).
©2016 Graduate Management Admission Council® (GMAC®). All rights reserved.
13
2016 Application Trends Survey Report
Figure 9. Full-Time One-Year MBA Programs Reporting Change in Application Volume, 2012–2016*
Up
Flat
Down
Percentage of programs
100%
80%
44%
60%
40%
20%
5%
5%
4%
9%
38%
44%
46%
60%
3%
47%
49%
2012
2013
37%
51%
57%
2015
2016
0%
2014
Full-time one-year MBA
*Percentages in some columns may not sum to 100 due to rounding.
Source: Data for 2012 to 2015 are from GMAC Application Trends Surveys conducted in those years. Data from 2016 are from the 2016 GMAC
Application Trends Survey.
Figure 10. Full-Time One-Year MBA Programs Reporting Change in Application Volume 2016 vs. 2015,
by School Location*
Up
Flat
Down
100%
Percentage of programs
14
80%
26%
45%
50%
60%
40%
20%
9%
7%
74%
45%
43%
0%
United States
Europe
East & Southeast Asia
Full-time one-year MBA
*Percentages in some columns may not sum to 100 due to rounding.
Source: GMAC (2016) Application Trends Survey.
GENDER
Women represent 36 percent of the applicant pool for the incoming 2016–2017 class for full-time oneyear MBA programs and men represent 64 percent of the total, about on par with last year. Overall, 52
percent of full-time one-year MBA programs report increasing application volumes for women in 2016
compared with 2015 and 53 percent report growing application volume for men (Figure 11).
©2016 Graduate Management Admission Council® (GMAC®). All rights reserved.
2016 Application Trends Survey Report
Figure 11. Full-Time One-Year MBA Applicant Pool, by Gender, 2016
Gender Distribution (%)
% Programs Reporting Change in Application
Volume 2016 vs. 2015, by Gender*
Up
Flat
Down
Female
36%
Male
64%
Percentage of programs
100%
80%
60%
29%
35%
18%
14%
53%
52%
Male
Female
40%
20%
0%
Full-time one-year MBA
*Percentages in some columns may not sum to 100 due to rounding.
Source: GMAC (2016) Application Trends Survey.
CITIZENSHIP
For the incoming class of 2016–2017, domestic candidates represent 49 percent of the applicant pool
for full-time one-year MBA programs and international candidates represent 51 percent (Figure 12).
Overall, 53 percent of full-time one-year MBA programs this year report increased application volumes
for domestic applicants compared with 2015; 49 percent report increased application volume from
international applicants.
Figure 12. Full-Time One-Year MBA Applicant Pool, by Citizenship, 2016
Applicant Pool, by Citizenship, 2016
% Programs Reporting Change in Application
Volume 2016 vs. 2015, by Citizenship*
Up
Flat
Down
International
51%
Domestic
49%
Percentage of programs
100%
80%
60%
29%
39%
18%
13%
40%
20%
53%
49%
Domestic
International
0%
Full-time one-year MBA
*Percentages in some columns may not sum to 100 due to rounding.
Source: GMAC (2016) Application Trends Survey.
©2016 Graduate Management Admission Council® (GMAC®). All rights reserved.
15
2016 Application Trends Survey Report
A majority of applicants to full-time one-year MBA programs come from the following world regions:
United States, Central and South Asia, and East and Southeast Asia (Figure 13).
Figure 13. Global Distribution of Full-Time One-Year MBA Applicants, by School Location and
Citizenship, 2016
School Location
Percentage of applicants
16
Global
62%
United States
60%
Europe
East & Southeast Asia
30%
8%
5%
United
States
25%
22% 23%
15%
14%
12%
10%
Central &
East &
South Asia Southeast
Asia
23%
9%
12%
2%
1%
Latin
America
7%
9%
2%
1%
Africa
7%
1%
4% 3% 4% 6%
3% 1% 2% 2% 2% 1% 4% 1% 1% 0% 1% 1%
0%
Western Middle East
Europe
Canada
Eastern
Europe
Citizenship
Australia &
Pacific
Islands
Source: GMAC (2016) Application Trends Survey.
Table 4 displays the top countries from which full-time one-year MBA programs received the greatest
number of international applications, and saw both the greatest increase and the greatest decrease in
international applications.
Table 4. Top Sources of International Candidates, Greatest Number, Increase, and Decrease, 2016*
Full-Time One-Year MBA
Greatest Number
Greatest Increase
Greatest Decrease
India
China
India
China
India
China
United States
South Korea
United States
Brazil
Saudi Arabia
Japan
Canada/Colombia/Mexico
*Countries shown were mentioned five or more times by program type and are shown in descending order of mentions.
Source: GMAC (2016) Application Trends Survey.
RECRUITMENT AND OUTREACH
The vast majority (92%) of full-time one-year MBA programs conduct special outreach and recruitment
of targeted populations. Fifty-eight percent of full-time one-year MBA programs specifically recruit
international candidates. China, India, and the United States are the top countries where these programs
recruit international candidates. Other countries include Brazil, Canada, Germany, Japan, Mexico,
Singapore, the United Kingdom, and Vietnam. Figure 14 shows the percentage of programs that
specifically reach out to various candidate groups.
©2016 Graduate Management Admission Council® (GMAC®). All rights reserved.
2016 Application Trends Survey Report
Figure 14. Percentage of Full-Time One-Year MBA Programs Conducting Special Outreach, by
Candidate Type, 2016*
International candidates
58%
Women
46%
Working professionals
46%
Business undergraduates
30%
Undergraduates (general)
30%
Occupational specialties
27%
Military
25%
Underrepresented US populations
25%
Nonbusiness undergraduates
16%
Entrepreneurs
16%
Pre-experience candidates
12%
Underrepresented nationalities
11%
LGBT community
3%
Percentage of programs
*Percentages do not sum to 100 due to multiple selections.
Source: GMAC (2016) Application Trends Survey.
TUITION ASSISTANCE
Figure 15 shows the percentage of enrolled students at full-time one-year MBA programs expected to
receive school-based tuition assistance in 2016, by funding type. Nearly one-third (27%) are expected to
receive merit scholarships, the most frequently awarded type of financial aid.
Figure 15. Percentage of Enrolled Students in Full-Time One-Year MBA Programs Who Will Receive
Tuition Assistance, 2016*
Merit scholarships
27%
Need-based scholarships
6%
Fellowships
4%
Reduced tuition
3%
Assistantships
3%
Stipend
On-campus work-study
2%
0%
Percentage of enrolled students
*The percentage of enrolled students that will receive tuition assistance was calculated by multiplying the projected class size by the estimated
percentage of students that will receive financial aid at the record level, and then summing the total number of students across all programs
that will be receiving funding and dividing by the total number of students in the given program type.
Source: GMAC (2016) Application Trends Survey.
©2016 Graduate Management Admission Council® (GMAC®). All rights reserved.
17
2016 Application Trends Survey Report
EMPLOYER FUNDING
In 2016, 70 percent of full-time one-year MBA programs estimate that a portion of their incoming
students will receive funding (in part or in whole) from their current employer. Figure 16 shows the
estimated amount of tuition support that full-time one-year MBA programs expect their enrolled
students will receive from their current employer. Twenty-two percent of programs expect that the
share of students receiving employer funding will increase in 2016 compared with last year, while 14
percent of programs expect to see declines in the share of students receiving employer funding.
Figure 16. Percentage of Enrolled Students in Full-Time One-Year MBA Programs Expected to Receive
Employer Funding, 2016
37%
Percentage of programs
18
30%
13%
8%
4%
None
1-9%
2%
2%
1%
0%
0%
1%
10-19% 20-29% 30-39% 40-49% 50-59% 60-69% 70-79% 80-89% 90-99%
Percentage of students with employer funding
Source: GMAC (2016) Application Trends Survey.
©2016 Graduate Management Admission Council® (GMAC®). All rights reserved.
1%
100%
2016 Application Trends Survey Report
Part-Time MBA
Globally, part-time MBA programs in 2016 continue to exhibit application volume patterns seen over the
last seven years since the end of the Great Recession. This year, less than half (43%) of part-time MBA
programs report volume growth compared with 50 percent that report declining volume (Figure 17).
Even though the majority (85%) of participating programs are located within the United States, this
persistent slow-growth pattern affects part-time MBA programs across the globe as well. Some regions
within the United States are experiencing growing application volume in 2016 including a majority of US
programs in the Northeast (53%) and West (50%). Only 37 percent of programs in both the South and
Midwest, however, report application volume growth this year (Figure 18). 8
Nearly half (49%) of part-time MBA programs plan to reduce the size of their incoming 2016–2017 class,
possibly in response to reduced student demand. Programs that have declining application volume plan
to seat three fewer students this year, on average, compared with 2015. Programs that report stable
application volumes plan to maintain their current class size, and those with growing volumes plan to
increase their class size by a median of five students. Nearly 9 in 10 (87%) part-time programs received
more applications than seats available, however.
Programs experiencing growth in their application volumes are seeing it occur in their pools of domestic
candidates and from both male and female applicants. US programs experiencing application growth
overall also were more likely to see an increased number of applications from underrepresented
populations. These individuals, however, make up just 17 percent of the US part-time MBA candidate
pool this year. Program size also appears to determine application volumes. 9 A majority of large
programs (53%) report growing application volumes in 2016 compared with just 33 percent of small
programs.
This year’s survey includes responses from 117 part-time MBA programs located in 13 countries (Table
5). The majority of programs are located in the United States, which includes programs in 33 states.
Two-thirds (66%) of part-time MBA programs are taught completely in the classroom and 34 percent
offer coursework online, including five programs that report delivering all of their coursework online.
Table 5. Application Summary Data for Part-Time MBA Programs, 2016*
Number of programs
117
Total number of applications (median)
78
2016–2017 estimated class size (median)
55
Applications per seat (median)
1.4
Estimated acceptance rate† (median)
75%
Estimated enrollment rate†† (median)
80%
*Data reflect applications received as of June 30, 2016.
†Acceptance rate equals the number of acceptance offers divided by the number of total completed applications, multiplied by 100.
††Enrollment rate equals the number of accepted applicants who enroll divided by the number of all accepted applicants, multiplied by 100.
Source: GMAC (2016) Application Trends Survey.
Data for part-time MBA programs in other world regions are not reported due to insufficient response (N < 10.)
Program sizes for part-time MBA programs, as defined by 2016 survey data, are categorized as follows: large, more than 55 students, and
small, 55 or fewer students.
8
9
©2016 Graduate Management Admission Council® (GMAC®). All rights reserved.
19
2016 Application Trends Survey Report
Figure 17. Part-Time MBA Programs Reporting Change in Application Volume, 2012–2016*
Up
Flat
Down
Percentage of programs
100%
80%
42%
53%
41%
54%
50%
60%
14%
40%
20%
14%
3%
18%
44%
8%
44%
45%
43%
2014
2015
2016
29%
0%
2012
2013
Part-time MBA
*Percentages in some columns may not sum to 100 due to rounding.
Source: Data for 2012 to 2015 are from GMAC Application Trends Surveys conducted in those years. Data from 2016 are from the 2016 GMAC
Application Trends Survey.
Figure 18. Part-Time MBA Programs Reporting Change in Application Volume 2016 vs. 2015, by US
School Location
Up
Flat
Down
100%
Percentage of programs
20
80%
36%
42%
58%
60%
14%
5%
40%
20%
58%
5%
5%
37%
37%
South
Midwest
53%
50%
0%
Northeast
Part-time MBA
Source: GMAC (2016) Application Trends Survey.
©2016 Graduate Management Admission Council® (GMAC®). All rights reserved.
West
2016 Application Trends Survey Report
GENDER
Women represent 41 percent of part-time MBA program applicants and men represent 59 percent of
the applicant pool for the incoming 2016–2017 class, which is on par with last year (Figure 19). Overall,
46 percent of part-time MBA programs report increasing application volumes for women in 2016
compared with 2015 and 35 percent report growing application volume for men.
Figure 19. Part-Time MBA Applicant Pool, by Gender, 2016
% Programs Reporting Change in Application
Volume 2016 vs. 2015, by Gender
Gender Distribution (%)
Female
41%
Percentage of programs
Up
Male
59%
Flat
Down
100%
80%
39%
49%
60%
15%
40%
16%
20%
35%
46%
0%
Male
Female
Part-time MBA
Source: GMAC (2016) Application Trends Survey.
RECRUITMENT AND OUTREACH
Overall, 92 percent of part-time MBA programs conduct special recruitment and outreach activities for
targeted populations. Working professionals are the most commonly targeted group (recruited by 83%
of respondents), followed by women (50%), and military (46%; Figure 20). Twenty percent of part-time
MBA programs also recruit international candidates.
Figure 20. Percentage of Part-Time MBA Programs Conducting Targeted Outreach, by Candidate
Type, 2016*
Working professionals
Women
Military
Underrepresented US populations
Occupational specialties
Undergraduates (general)
Business undergraduates
International candidates
Entrepreneurs
Pre-experience candidates
LGBT community
Nonbusiness undergraduates
Underrepresented nationalities
83%
50%
46%
38%
37%
27%
25%
20%
20%
19%
13%
12%
4%
Percentage of programs
*Percentages do not sum to 100 due to multiple selections.
Source: GMAC (2016) Application Trends Survey.
©2016 Graduate Management Admission Council® (GMAC®). All rights reserved.
21
2016 Application Trends Survey Report
TUITION ASSISTANCE
Figure 21 shows the percentage of enrolled students at part-time MBA programs expected to receive
school-based tuition assistance in 2016, by funding type.
Figure 21. Percentage of Enrolled Students in Part-Time MBA Programs Who Will Receive Tuition
Assistance, 2016*
Merit scholarships
13%
Reduced tuition
4%
Need-based scholarships
1%
Fellowships
1%
Assistantships
0%
Stipend
0%
On-campus work-study
0%
Percentage of enrolled students
*The percentage of enrolled students that will receive tuition assistance was calculated by multiplying the projected class size by the estimated
percentage of students that will receive financial aid at the record level, and then summing the total number of students across all programs
that will be receiving funding and dividing by the total number of students in the given program type.
Source: GMAC (2016) Application Trends Survey.
EMPLOYER FUNDING
In 2016, 99 percent of part-time MBA programs estimate that their students will receive funding (in part
or in whole) from their current employer. Figure 22 shows the percentage of students that part-time
MBA programs expected will receive funding from their current employer this year. Twenty-six percent
of programs expect that the share of students receiving employer funding will increase in 2016
compared with last year.
Figure 22. Percentage of Enrolled Students in Part-Time MBA Programs Expected to Receive Employer
Funding, 2016
22%
Percentage of programs
22
14%
12%
11%
7%
11%
10%
7%
2%
1%
None
2%
0%
1-9%
10-19% 20-29% 30-39% 40-49% 50-59% 60-69% 70-79% 80-89% 90-99%
Percentage of students with employer funding
Source: GMAC (2016) Application Trends Survey.
©2016 Graduate Management Admission Council® (GMAC®). All rights reserved.
100%
2016 Application Trends Survey Report
Flexible MBA
Flexible MBA programs did not sustain the momentum in application volume growth begun last year.
Less than half (44%) of the flexible MBA programs report application volume growth this year,
compared with 54 percent in 2015 (Figure23). Although a majority of programs last year reported
growth in application volume, flexible MBA programs have not seen consistent growth since 2008.
More than 3 in 4 (78%) participating flexible MBA programs are located within the United States. 10 Half
(50%) of non-US programs report growing application volumes in 2016 compared with 42 percent of US
programs. In the United States, some regions report positive trends in 2016, however. Half (50%) of the
programs in the Northeast, Midwest, and West report increased application volume. In the US South,
only 23 percent of programs report application volume growth this year (Figure 24).
Flexible MBA programs reporting volume growth also are seeing increased applications across most
candidate groups. Four in 5 (82%) programs that are growing this year report growth in their
international applicant pool, 55 percent in the domestic pool, and 73 percent each among male and
female applicants. In addition, 42 percent of the US-based flexible MBA programs that report volume
growth are receiving more applications from underrepresented population groups.
Program size appears to have an impact on application volumes 11. Half of the large programs with more
than 50 students report application volume growth compared with 37 percent of small programs. Onethird (33%) of flexible MBA programs have reduced the size of their incoming class, possibly in reaction
to reduced demand—similar to part-time MBA programs. On average, programs with declining
applications plan to seat 1.5 fewer students this year compared with 2015. Programs that report stable
volumes plan to decrease their class size by a median of one student, and those with growing volumes
plan to increase their class size by a median of 4.5 students. Nine in 10 (90%) flexible MBA programs
received enough applications to fill their incoming class, however.
This year’s survey includes responses from 55 flexible MBA programs from eight countries (Table 6).
The majority of these are located in the United States, in 15 different states. Half (50%) of the
participating programs offer some coursework online. Four programs are offered exclusively online.
Table 6. Application Summary Data for Flexible MBA Programs, 2016*
Number of programs
55
Total number of applications (median)
109
2016–2017 estimated class size (median)
Applications per seat (median)
51
1.9
Estimated acceptance rate† (median)
69%
Estimated enrollment rate†† (median)
70%
*Data reflect applications received as of June 30, 2016.
†Acceptance rate equals the number of acceptance offers divided by the number of total completed applications, multiplied by 100.
††Enrollment rate equals the number of accepted applicants who enroll divided by the number of all accepted applicants, multiplied by 100.
Source: GMAC (2016) Application Trends Survey.
Data for flexible MBA programs in other world regions are not reported due to insufficient response (N < 10).
Program sizes for flexible MBA programs, as defined by 2016 survey data, are categorized as follows: large, 51 or more students; and small, 50
or fewer students.
10
11
©2016 Graduate Management Admission Council® (GMAC®). All rights reserved.
23