Determination of QuinoloneAntibiotics in Bovine Liver UsingAgilent SampliQ QuEChERS Kits byLC/MS/MS
Bạn đang xem bản rút gọn của tài liệu. Xem và tải ngay bản đầy đủ của tài liệu tại đây (478.54 KB, 10 trang )
Determination of Quinolone
Antibiotics in Bovine Liver Using
Agilent SampliQ QuEChERS Kits by
LC/MS/MS
Application Note
Food
Author
Abstract
Limian Zhao, and Joan Stevens
This paper presents an analytical method which allows the determination of 11
Agilent Technologies, Inc.
quinolone antibiotic residue in bovine liver: pipemidic acid, ofloxacin, ciprofloxacin,
2850 Centerville Road
danofloxacin, lomefloxacin, enrofloxacin, sarafloxacin, cinoxacin, oxolinic acid, nalidix-
Wilmington, DE 19808
ic acid, and flumequine.
USA
The procedure involves a rapid and efficient pretreatment by SampliQ QuEChERS kits.
The homogenized liver sample was initially extracted in a buffered aqueous, 5%
formic acid acetonitrile system. An extraction and partitioning step was performed
after the addition of salts. Cleanup was done using dispersive solid phase extraction
(dispersive-SPE). The final extracts allowed determination of all compounds in a single run using LC-ESI-MS-MS operating in positive ion multiple reaction monitoring
(MRM) mode. Norfloxacin was selected as the internal standard. The accuracy of the
method, expressed as recovery, was between 62 and 113%. The precision, expressed
as RSD, was between 2.2 and 13.4%. The established limit of quantification (LOQ) was
5 ng/g and is significantly lower than the respective Maximum Residue Limit (MRL)
for quinolones in food producing animals.
Introduction
a combination of both. Although they have been widely used,
these traditional methods have inherent limitations.
Traditional methods are labor intensive, time consuming,
require a large amount of solvent and waste disposal. In
2003, the QuEChERS (Quick, Easy, Cheap, Effective, Rugged,
and Safe) method for pesticide residue analysis in fruit and
vegetable matrices was introduced. [5] There are two validated QuEChERS methodologies: the AOAC and EN versions.
Both are widely accepted and effective for the multiresidue
analysis of pesticides in fruit, vegetables and other plant food
matrices. The QuEChERS method contains significant advantages over traditional methods, including high recoveries for a
wide range of pesticides, high sample throughput, minimal
labor, time savings, limited solvent usage, and low waste. In
addition, the method is manually accommodating which has
made QuEChERS a very popular methodology for the analysis
of pesticide residues in fruits and vegetables in recent years.
Quinolones are a family of synthetic broad-spectrum antibiotics. They prevent bacterial DNA from unwinding and duplicating. There is evidence that quinolones in food animals lead
to the emergence of quinolone-resistant bacteria in animals.
The resistant organisms are transmitted to humans via direct
contact with the animal or through the consumption of contaminated food and water. Quinolone-resistant campylobacter is
an example of animal-to-human transmission and has been
observed in many European countries since the early 1990s
[1]. Therefore, public health agencies in many countries such
as the EU commission [2], the USA FDA administration [3],
and the Chinese Ministry of Agriculture [4] have established
maximum residue limits (MRLs) of veterinary drugs in foodproducing animals. Given the different drugs in different food
origins and in different countries, the MRLs of quinolones in
food products of animal origin are usually at the level of
100 µg/kg or higher.
Although the current QuEChERS methodology has been
designed for removing matrix interferences in food products
of plant origin, such as polar organic acids, sugars, and lipids,
it also has potential for other food matrices such as meat.
Based upon the chemical properties of the compounds of
interest and food matrices, some modifications of the original
method might be necessary to obtain accurate and precise
results. The purpose of this work is to extend the QuEChERS
methodology to veterinary drug residues in food-producing
animals. Agilent SampliQ QuEChERS EN buffered extraction
kits (p/n 5982-5650) and dispersive-SPE 2 mL kits for drug
residues in meat (p/n 5982-4921) were used for the analysis
of 11 quinolone antibiotics in bovine liver: pipemidic acid,
ofloxacin, ciprofloxacin, danofloxacin, lomefloxacin,
enrofloxacin, sarafloxacin, cinoxacin, oxolinic acid, nalidixic
acid and flumequine (Figure 2). The method was validated in
terms of recovery and reproducibility.
As animal food origins, such as muscle, liver, and eggs, are
complicated matrices, it is critical to use an efficient sample
pretreatment method for analyte extraction and concentration, and matrix cleanup. The established sample pretreatment methods used for determination of quinolones include
traditional solvent extraction, solid phase extraction (SPE), or
Fluoroquinolones (FQ) used in food animal
HO
H
H3C
H3C
HO O
OH
H
H
H
O
Zoonotic infection in
human by FQ-resistant
Campylobacter and
Salmonella
Figure 1.
Horizontal transfer of
resistant genes from
zoonotic to human
flora
Residual antibiotics
exert selective
pressure for resistant
mutant in human flora
Animal to human transmission of resistant bacteria [1].
Pipemidic acid
S fl
i
Sarafloxacin
Figure 2.
FQ-resistant E coli from
animal colonizes
human gastrointestinal
tract
Ofloxacin
Ofl
i
Cinoxacin
Ciprofloxacin
Danofloxacin
Oxolinic acid
N
lidi i acid
id
Nalidixic
Chemical structures of the quinolone antibiotics investigated in this study.
2
Lomefloxacin
Flumequine
Fl
i
Enrofloxacin
Norfloxacin (IS)
Experimental
Equipment and Material
Reagents and Chemicals
All reagents and solvents were HPLC or analytical grade.
Methanol (MeOH) was from Honeywell (Muskegon, MI, USA).
Acetonitrile (ACN), dimethyl sulfoxide (DMSO) and glacial
acetic acid (HAc) were from Sigma-Aldrich (St Louis, MO,
USA). Ammonium acetate (NH4OAc) was from Fisher
Chemicals (Fair Lawn, NJ, USA). Formic acid (FA) was from
Fluka (Sleinheim, Germany). The quinolone standards and
internal standard were purchased from Sigma-Aldrich (St
Louis, MO, USA). Potassium phosphate, monobasic (KH2PO4),
was from J.T. Baker (Phillipsburg, NJ, USA).
•
Agilent 1200 Series HPLC with Diode Array Detector
(Agilent Technologies Inc., CA, USA).
•
Agilent 6410 Series triple quadrupole LC/MS system with
Electrospray Ionization (Agilent Technologies Inc., CA,
USA).
•
Agilent SampliQ QuEChERS EN Extraction kits, p/n 59825650, and SampliQ QuEChERS dispersive-SPE kits for
Drug Residues in Meat, 2 mL, p/n 5982-4921 (Agilent
Technologies Inc., DE, USA).
•
CentraCL3R Centrifuge (Thermo IEC, MA, USA)
•
Eppendorf microcentrifuge (Brinkmann Instruments,
Westbury, NY, USA)
•
2010 Geno Grinder (Spex SamplePrep LLC, Metuchen, NJ,
USA)
•
Multi-tube Vortexer (Henry Troemner LLC, Thorofare, NJ,
USA)
Solutions and Standards
1M ammonium acetate stock solution was made by dissolving 19.27 g NH4OAc powder in 250 mL Milli-Q water. The
solution was stored at 4 ºC. A 5 mM ammonium acetate in
water solution with pH 3 was made by adding 5 mL of 1M
ammonium acetate stock solution into 1 L of Milli-Q water,
then adjusting the pH to 3 with glacial acetic acid. A 1:1
MeOH/ACN solution was made by combining 500 mL of
MeOH and ACN, then mixing well. A 5% formic acid solution
in ACN was made fresh daily by adding 10 mL of formic acid
to 190 mL of ACN, then mixing well. A 30 mM KH2PO4 buffer,
pH 7.0, was made by dissolving 4.08 g KH2PO4 powder into 1 L
Milli-Q water and adjusting the pH to 7.0 with 1 M KOH solution. A 1:1 ACN/H2O with 0.1% FA was prepared by combining 50 mL of ACN and Milli-Q water, then adding 100 µL of
formic acid. A 1:9 MeOH/H2O solution with 0.1% FA was prepared by combining 10 mL of MeOH and 90 mL of Milli-Q
water, then adding 100 µL of formic acid.
Instrument conditions
HPLC conditions
Column
Agilent ZORBAX Solvent Saver Eclipse Plus PhenylHexyl 150 × 3.0 mm, 3.5 µm (p/n 959963-312)
Flow rate
0.3 mL/min
Column Temperature 30 °C
Standard and internal standard (IS) stock solutions (1.0
mg/mL for all, except 0.25 mg/mL for ciprofloxacin) were
made in DMSO and stored at 4 ºC. Due to the solubility of
quinolones, it is essential to sonicate stock solutions to
ensure they completely dissolve. Three combined QC spiking
solutions of 0.2, 8 and 16 µg/mL were made fresh daily in 1:1
ACN/H2O containing 0.1% FA. A 10 µg/mL standard spiking
solution in 1:1 ACN/H2O containing 0.1% FA was made for
the preparation of calibration curves in the matrix blank
extract. A 20 µg/mL IS spiking solution of norfloxacin was
made in 1:1 ACN/H2O containing 0.1% FA.
Injection volume
10 µL
Mobile Phase
A: 5 mM ammonium acetate, pH 3.0 in H2O
B: 1:1 MeOH/ACN
Needle wash
1:1:1:1 ACN/ MeOH/ IPA/ H2O with 0.2% FA.
Gradient
Time
0
0.2
8.0
9.0
11.5
Post run
4 min
Total cycle time
~16 min.
%B
15
15
75
100
STOP
Flow rate (mL/min)
0.3
0.3
0.3
0.3
MS conditions
Polarity
positive
Gas Temp.
325 °C
Gas Flow
8 L/min
Nebulizer
50 Psi
Capillary
4000 V
Solvent cut
5 min
Other conditions relating to the analytes are listed in Table 1.
3
Table 1.
packet (p/n 5982-5650) was added to each tube. Sample
tubes were capped tightly and shaken vigorously for 1 min by
a 2010 Geno Grinder. Tubes were centrifuged at 4,000 rpm for
5 min at 4 °C.
Instrument Acquisition Data for the Analysis of 11 Quinolone
Antibiotics by LC/MS/MS
MRM channels
(m/z)
Fragmentor
(V)
CE
(V)
RT
(min)
Pipemidic acid
1) 304.1 → 286.1
2) 304.1 → 215.1
128
17
37
5.9
Ofloxacin
1) 362.2 → 318.1
2) 362.2 → 344.1
150
17
21
6.7
Ciprofloxacin
1) 332.1 → 314.1
2) 332.1 → 231.0
131
21
41
6.8
Danofloxacin
1) 358.2 → 340.2
2) 358.2 → 82.1
159
25
49
6.9
Lomefloxacin
1) 352.2 → 265.2
2) 352.2 → 334.1
144
21
21
7.0
Enrofloxacin
1) 360.2 → 342.2
2) 360.2 → 316.2
159
21
17
7.3
Sarafloxacin
1) 386.1 → 368.1
2) 386.1 → 348.2
144
21
33
7.9
Cinoxacin
1) 263.1 → 217.1
2) 263.1 → 189.0
103
21
29
8.8
Oxolinic acid
1) 262.1 → 216.0
2) 262.1 → 160.0
106
29
41
9.2
Nalidixic acid
1) 233.1 → 104.1
2) 233.1 → 159.1
94
45
33
10.3
Flumequine
1) 262.1 → 202.0
2) 262.1 → 126.0
106
33
50
10.8
134
17
6.6
Analyte
Norfloxacin (IS) 320.1 → 302.1
1) Quantifier transition channel
A 1 mL aliquot of the upper ACN layer was transferred into an
Agilent SampliQ QuEChERS dispersive-SPE 2 mL tube for
Drug Residues in Meat (p/n 5982-4921). This 2 mL dispersiveSPE tube contained 25 mg of C18 and 150 mg of anhydrous
MgSO4. The tubes were tightly capped and vortexed for 1 min.
The 2 mL tubes were centrifuged with a microcentrifuge at
13,000 rpm for 3 min. An 800 µL volume of extract was transferred into another tube and dried by N2 flow at 40 °C.
Samples were reconstituted into 800 µL of 1:9 MeOH/H2O
with 0.1% FA. After vortexing and sonicating for 10 min, the
sample was filtered by a 0.22 µm Cellulose Acetate Spin Filter
(p/n 5185-5990). The clear filtered sample was transferred
into an autosampler vial. The samples were capped and vortexed thoroughly in preparation for LC/MS/MS analysis.
Figure 2 shows the flow chart of the entire extraction procedure for bovine liver sample.
Weigh 2 g homogenized liver sample (± 0.05 g) in 50 mL centrifuge tube.
Spike 50 µL of IS spike solution, 50 µL of QC spike solution if necessary. Vortex 30 s.
2) Qualifier transition channel
Add 8 mL of 30 mM KH2PO4, pH 7.0. Vortex.
Sample preparation
Add 10 mL of 5% FA in ACN, and shake vigorously for 30 s.
The sample preparation procedure includes sample homogenization, extraction/partitioning, and dispersive-SPE cleanup.
As mentioned previously the QuEChERS methods were
designed for pesticides analysis in fruit and vegetable matrices; therefore modifications were necessary to optimize the
results for the determination of quinolones in bovine liver.
Add SampliQ EN QuEChERS extraction kit and shake vigorously for 1 min.
Centrifuge @ 4000 rpm for 5 min at 4 °C.
Transfer 1 mL of ACN layer to SampliQ QuEChERS dispersive-SPE 2 mL tube,
drug residues in meat.
Bovine liver was purchased from a local grocery store. It was
washed and chopped into small pieces. The chopped liver
was homogenized thoroughly with a food grinder and stored
at -20 °C. Two-gram (±0.05g) samples of homogenized liver
were placed into 50 mL centrifuge tubes. The tubes were centrifuged for 30 s to move the sample from the inside tube wall
to the bottom of the tube. Samples were then fortified with
appropriate QC spiking solutions (50 µL) when necessary,
then 50 µL of IS spiking solution (20 µg/mL of norfloxacin).
After vortexing the sample for 30 s, 8 mL of 30 mM KH2PO4
buffer, pH 7.0, were added. Tubes were then vortexed for 10 s
to mix. A 10 mL volume of 5% FA in ACN was added to each
tube. Tubes were capped and shaken by a 2010 Geno Grinder
for 30 s. An Agilent SampliQ QuEChERS EN extraction salt
Vortex 1 min, centrifuge @ 13,000 rpm for 3 min with microcentrifuge.
Transfer 800 µL extract to another tube, blow down @ 40 °C with N2.
Reconstitute into 800 µL 1:9 MeOH/H2O with 0.1% FA. Vortex and sonicate 10 min.
Filter samples with 0.22 µm cellulose acetate spin filter.
Samples are ready for LC/MS/MS analysis.
Figure 3.
4
Flow chart of QuEChERS procedure for the determination of
quinolones in bovine liver.
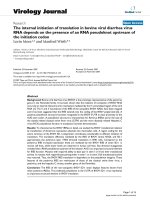
Results and Discussion
ACN extracts after the extraction step using different extraction kits. The ACN extracts using the EN extraction kit (p/n
5982-5650) showed much higher responses than those using
the AOAC extraction kit (p/n 5982-5755) and the original
extraction kit (p/n 5982-5550). The buffer system in the
extraction/partitioning step provided by the addition of salts
plays a key role in the extraction efficiency. The pH when the
acidic analytes exist in their neutral forms facilitates the
extraction. Both the EN and AOAC extraction kits provide a
buffer system of approximately pH 5.0 [6, 7], which is the
point where most quinolones are neutral. Therefore, these
extraction kits generate better extraction efficiency than the
original nonbuffered extraction kit. However, it is unknown
why the neat extract from the EN extraction buffer system
produced higher responses than that from the AOAC extraction buffer system, especially for the early eluted analytes.
From these results, the SampliQ EN buffered QuEChERS
extraction kit was selected for future work.
Feasibility Test
Quinolones are a group of relatively new antibacterials synthesized from 3-quinolone carboxylic acid. As shown in
Figure 2, they all contain the carboxylic group, and are weakly
acidic (pKa 4-6). Since this is the first time for quinolones
determination by the QuEChERS method, the feasibility test
was done by extracting 50 ng/mL of neat quinolone solution
(prepared in water) with different SampliQ QuEChERS kits,
including the SampliQ AOAC extraction kit, SampliQ EN
extraction kit, and SampliQ Original extraction kit. In addition,
bovine liver is a very different matrix than fruit and vegetables. Therefore, the cleanup was followed by the corresponding fatty dispersive-SPE kit (AOAC and EN fatty dispersiveSPE kit) because these fatty dispersive-SPE kits contain C18
which is critical for removing lipids from liver matrix.
However, the test results were initially very disappointing. All
of the analytes had extremely low or nonexistent recoveries.
The ACN extracts were tested at two points in the procedure
to investigate where the analytes were being lost. The first
test was made after the extraction step. The second test was
made after both the extraction and the dispersive-SPE steps.
Figure 3 shows the chromatogram comparison for the neat
×103
1
12
23
34
4
Neat extracts by EN
extraction kit only
3
Neat extracts by AOAC
extraction kit only
2.5
Neat extracts by Original
extraction kit only
2
1.5
1
0.5
1
Figure 4.
2
3
4
5
6
7
Counts vs. Acquisition Time (min)
8
9
10
Feasibility test results 1: chromatogram comparison of the neat extracts (no dispersive-SPE) obtained by SampliQ QuEChERS EN extraction kit ,
AOAC extraction kit, and original extraction kit.
5
The addition of acid to acetonitrile during the extraction/partitioning step was also investigated. Acetonitrile only, used in
the original EN method, and acidified acetonitrile with 5%
formic acid were evaluated for their efficiency. As demonstrated in Figure 5 by comparing the results from columns A
and D, better analyte recoveries were achieved (10-30% higher) with the acidified acetonitrile. The addition of formic acid
into solvent extraction inhibits the acid dissociation for
quinolones. Therefore, their protonated neutral form can be
extracted easily into the solvent phase [8]. Furthermore, the
addition of acid into acetonitrile greatly decreased the negative impact caused by PSA in the dispersive-SPE step
(Figure 5, columns C and E). The formic acid in ACN extract
interacts with PSA in the dispersive-SPE step, greatly
decreasing the binding of PSA with the target quinolones.
From these results, 5% (vol/vol) formic acid in acetonitrile
was chosen as an extraction solvent for further study.
get analytes, the quinolones, leading to the loss of analytes.
When acetonitrile was used in the extraction step, PSA from
the dispersive-SPE kit caused almost total loss of all of analytes (Figure 5, columns D and E). When acidified acetonitrile
was used in the extraction step, the existence of PSA in the
dispersive-SPE kit still caused a 10-40% loss of analytes
(Figure 5, columns A and C). Because of these results, a brand
new SampliQ dispersive-SPE kit for Drug Residues in Meat
(p/n 5982-4921) was used for this study. This new SampliQ
dispersive-SPE kit contains 25 mg C18 and 150 mg MgSO4 per
mL of ACN extract. The new dispersive-SPE kit’s effect on the
analytes recovery is negligible (Figure 5, columns A and B).
According to the above feasibility test results, a QuEChERS
method was developed and applied for the subsequent study
in the liver matrix. This method uses the SampliQ EN buffered
extraction kit and 5% FA in ACN for the extraction/ partitioning step as well as the new SampliQ dispersive-SPE kit for
drug residues in meat for the following cleanup.
Although the EN extraction kit generated better recovery, the
cleanup using the fatty dispersive-SPE kit in step two significantly lowered extraction efficiency (Figure 5). The selected
fatty dispersive-SPE kit contains PSA (primary secondary
amine), C18, and MgSO4; however the loss of quinolones was
mostly due to the PSA. In the QuEChERS method, PSA is used
in all dispersive-SPE kits, because it acts as a weak anion
exchanger. It strongly interacts with acidic interferences from
fruits and vegetables such as polar organic acids, sugars, and
fatty acids. However, it can also strongly interact with the tar-
30000
A) 5% FA ACN, No dispersive-SPE
B) 5% FA ACN, C18 dispersive-SPE
C) 5% FA ACN, C18 + PSA dispersive-SPE
D) ACN, No dispersive-SPE
E) ACN, C18 + PSA dispersive-SPE
25000
20000
15000
10000
5000
Pi
p
em
id
ic
ac
id
0
Figure 5.
Feasibility test 2. Analytes peak area comparison for the neat extract processed by different procedures. Comparisons include pure ACN and acidified ACN, with and without PSA dispersive-SPE.
6
Method Optimization in the Liver Matrix
After the extraction/partitioning step, the sample was centrifuged at 4,000 rpm and 4 °C for 5 min. The low temperature
helped to remove lipids from the ACN extracts. After centrifuging, a thin layer of lipids might show up on the surface of
the ACN layer. Additional lipids will be removed by C18 in the
dispersive-SPE step. A 1 mL amount of ACN extract was
transferred into a 2 mL dispersive-SPE tube containing 25 mg
C18 and 150 mg MgSO4 for cleanup. An 800 µL amount of
upper solvent was transferred into another tube by vortexing
and centrifuging. This was the final extract after the
QuEChERS extraction and cleanup. It appeared light brown to
red in color and was transparent. In order to get sufficient
sensitivity and integrity of peak shape, the sample was dried
under N2 flow and reconstituted into 800 µL 1:9 MeOH/H2O
with 0.1% FA. The reconstituted sample was cloudy and filtration was necessary, which was done by a 0.22 µm cellulose
acetate spin filter. The sample became colorless and clear
after filtering, and was ready for LC/MS/MS injection.
The QuEChERS method established from the results of the
feasibility test was applied to the determination of quinolones
in bovine liver.
The homogenized liver sample was very thick and could not
be used directly for the extraction. Therefore, it was necessary to dilute the liver sample with an aqueous buffer (30 mM
KH2PO4 in water, pH 7.0) before the extraction. Different sample/buffer ratios including 1:4, 3:7, 1:1, were investigated by
adding 8 mL, 7 mL and 5 mL of buffer to 2 g, 3 g, and 5 g of
homogeneous liver sample. After dilution, 10 mL of 5% FA in
ACN was added. Visually, the more sample used, the more
foam was generated during the extraction/partitioning step
resulting in a darker red ACN extract. Although more sample
should lead to a lower detection limit, it simultaneously introduced more matrix interferences and higher matrix effect.
Since the addition of 5% FA ACN to the liver sample is also a
protein precipitation procedure, a sample/ACN ratio of 1:4 to
1:5 usually provides the best precipitation effect and sufficient cleanup for proteins. Therefore, a sample/buffer ratio of
1:4 (2 g of liver sample and 8 mL of buffer) was employed.
70
1
12
1
12
Figure 6 shows the MRM chromatograms of liver control
blank and 5 ng/g fortified liver extract (LOQ). The liver control
blank chromatogram indicated that it was free from any interference to the target analytes. The 5 ng/g fortified liver
extract chromatogram demonstrated that the 5 ng/g limits of
quantitation (LOQ) for all of analytes were well established
with a signal-to-noise ratio (S/N) greater than 5.
23
34
23
34
A4
60
50
40
70
10
11 B 4
4
6
60
3
7
2
1
50
5
9
8
40
1
2
3
4
5
6
7
8
9
10
11
Counts vs. Acquisition Time (min)
Figure 6.
LC/MS/MS chromatograms of A) liver blank extract, and B) 5 ng/g fortified liver extract (LOQ). Peaks identification: 1. Pipemidic acid, 2. Ofloxacin,
3. Ciprofloxacin, 4. Danofloxacin, 5. Lomefloxacin, 6. Enrofloxacin, 7. Sarafloxacin, 8. Cinoxacin, 9. Oxolinoc acid, 10. Nalidixic acid, 11. Flumequine.
7
Linearity and limit of quantification (LOQ)
Table 3.
The linear calibration range for all of the quinolone antibiotics
was 5 – 400 ng/g and matrix blanks were prepared for evaluation. Calibration curves spiked in matrix blanks were made at
levels of 5, 10, 50, 100, 200, 300, and 400 ng/g for each analyte. The norfloxacin was used as an internal standard at
200 ng/g. The calibration curves were generated by plotting
the relative responses of analytes (peak area of analyte /
peak area of IS) to the relative concentration of analytes (concentration of analyte/concentration of IS). The 5 ng/g limit of
quantification LOQ (5 ppb) established for all of the quinolones is far below the MRLs for residues of these antibiotics
in animal food products. Table 2 shows the regression equation and correlation coefficient (R2). Linear regression fit was
used with 1/x2 weight. Results indicated excellent linearity
for all of the analytes calibration curves over a broad
quantification range.
Table 2.
Analytes
Regression equation
R2
Pipemidic acid
Y = 0.2081X – 0.00002
0.9966
Ofloxacin
Y = 0.2221X + 0.00001
0.9964
Ciprofloxacin
Y = 0.2971X – 0.00005
0.9975
Danofloxacin
Y = 0.6861X – 0.0039
0.9957
Lomefloxacin
Y = 0.1702X – 0.00003
0.9958
Enrofloxacin
Y = 0.6530X – 0.0020
0.9962
Sarafloxacin
Y = 0.2132X – 0.0004
0.9937
Cinoxacin
Y = 0.0933X – 0.0004
0.9959
Oxolinic acid
Y = 0.1043X + 0.0003
0.9939
Nalidixic acid
Y = 0.3223X + 0.0005
0.9974
Flumequine
Y = 0.3232X + 0.0003
0.9966
Recovery and Reproducibility
The recovery and reproducibility were evaluated by fortifying
quinolone standards in homogenized liver sample at levels of
5, 200 and 400 ng/g. These QC samples were quantified
against the matrix spiked calibration curve. The analysis was
performed in replicates of six at each level. The recovery and
reproducibility (shown as RSD) data are shown in Table 3. It
can be seen from the results that all of quinolones except
pipemidic acid gave excellent recoveries (average of 95.9%)
and precision (average of 6.6% RSD). Pipemidic acid gave
lower recovery (average of 66.7%) but great precision (average of 5.7% RSD). Additionally, it still meets the 5 ng/g LOQ
requirement. Therefore, the results are acceptable.
8
5 ng/g
fortified QC
RSD
Recovery (n=6)
200 ng/g
400 ng/g
fortified QC
fortified QC
RSD
RSD
Recovery (n=6) Recovery (n=6)
Pipemidic acid
71.6
8.1
62.0
6.8
66.4
Ofloxacin
72.9
9.7
101.0
7.7
102.4
5.7
108.2
8.3
101.4
4.2
98.9
2.3
Ciprofloxacin
Linearity of Quinolone Antibiotics in Bovine Liver.
Analytes
Recovery and Repeatability of Pesticides in Fortified Liver with
2 mL Dispersive-SPE Tube (p/n 5982-4921)
2.2
Danofloxacin
88.2
7.9
109.3
7.8
114.0
6.1
Lomefloxacin
82.6
13.4
96.8
8.5
97.8
5.3
5.8
Enrofloxacin
88.6
7.5
109.5
8.3
113.1
Sarafloxacin
99.6
9.0
97.7
8.4
97.0
4.6
Cinoxacin
92.3
9.3
95.1
7.9
93.5
2.6
Oxolinic acid
95.1
9.8
92.7
4.3
87.6
2.9
Nalidixic acid
92.7
6.0
90.2
5.3
87.7
3.5
Flumequine
91.6
6.6
93.3
5.3
89.9
2.9
Conclusions
The Agilent SampliQ Buffered Extraction EN kit and the
SampliQ dispersive-SPE kit for Drug Residues in Meat provide
a simple, fast and effective method for the purification of
quinolone antibiotics in bovine liver. Compared to the other
sample pretreatment methods, such as LLE and SPE, the
QuEChERS method is easier to handle, faster, labor-saving,
and cheaper. The recovery and reproducibility, based on
matrix spiked standards, were acceptable for multiresidue
quinolone determination in bovine liver. The impurities and
matrix effects from liver were minimal and did not interfere
with the quantification of any target compound. The LOQs of
the quinolones were much lower than their regulated MRLs in
animal food products. On the whole, the QuEChERS procedures presented here appear to be a promising reference
method for the quantitative analysis of quinolones in food
products of animal origin. This method also has the potential
to extend the applications of SampliQ QuEChERS extraction
and dispersive-SPE kits to the quantitative analysis in other
bio-matrices, such as animal food products and bio-fluids,
rather than just plant matrices.
References
1.
Fluoroquinolone Antibiotics, A.R. Ronald and D.E. Low pg
58, Birkhauser Verlag, Basil Switzerland, ISBN 3-76436591
2.
Commission Regulation (EC) No 508/1999 of 4 March
1999 amending Annexes I to IV to Council Regulation
(EEC) No 2377/90 laying down a Community procedure
for the establishment of maximum residue limits of veterinary medicinal products in foodstuffs of animal origin.
Official Journal L 060, 09/03/1999, 16.
3.
Code of Federal Regulation, Title 21 (Food and Drugs),
Vol. 6, Part 556, Revised April 1, 2006.
4.
Ministry of Agriculture of the People’s Republic of China,
Announcement 2002/235 concerning the maximum
residue limit of veterinary drug of animal foodstuff.
/>
5.
Anastassiades M., Lehotay S.J.; Fast and Easy
Multiresidue Method Employment Acetonitrile
Extraction/Partitioning and “dispersive Solid-Phase
Extraction” for the Determination of Pesticide Residues
in Produce, J. AOAC Int., 2003, 86, 412- 431.
9
6.
Lehotay S.J., et al; Use of Buffering and Other Means to
Improve Results of Problematic Pesticides in a Fast and
Easy Method for Residue Analysis of Fruits and
Vegetables, J. AOAC Int., 2005, 88, 615-629.
7.
Payá P., Anastassiades M.; Analysis of pesticide residues
using the Quick Easy Cheap Effective Rugged and Safe
(QuEChERS) pesticide multiresidue method in combination with gas and liquid chromatography and tandem
mass spectrometric detection. Anal Bioanal Chem., 2007,
389, 1697-1714.
8.
Koesukwiwat U., et al; Rapid determination of phenoxy
acid residues in rice by modified QuEChERS extraction
and liquid chromatography-tandem mass spectrometry.
Analytical Chim. Acta, 2008, 626, 10-20.
www.agilent.com/chem
Agilent shall not be liable for errors contained herein or
for incidental or consequential damages in connection
with the furnishing, performance, or use of this material.
Information, descriptions, and specifications in this
publication are subject to change without notice.
© Agilent Technologies, Inc., 2010
Printed in the USA
January 25, 2010
5990-5085EN