bản-hoàn-chỉnh-ver1-đã-có-số-trang-trang-bìa-hoàn-chỉnh-nội-dung-đã-đc-Mai-xem
Bạn đang xem bản rút gọn của tài liệu. Xem và tải ngay bản đầy đủ của tài liệu tại đây (206.89 KB, 22 trang )
HANOI UNIVERSITY
FACULTY OF MANAGEMENT AND TOURISM
----------o0o----------
Student’s name
ID
Tutorial
Trịnh Hạnh Lê
1304000047
Tut 1 BA13
Đào Phương Mai
1304000055
Tut 1 BA13
Lê Hồng Nhung
1304000066
Tut 1 BA13
Nguyễn Thuý Quỳnh
1304000074
Tut 1 BA13
Vũ Thị Mai Linh
1304000051
Tut 1 BA13
Phùng Ngọc Phương Ly
1304000054
Tut 1 BA13
Bùi Thanh Huyền
1304000036
Tut 1 BA13
Hoàng Quân Nhật Minh
1304000057
Tut 1 BA13
STATISTIC PROJECT
TÊN BÀI
1
TABLE OF CONTENT:
2
ABSTRACT
Lecture -an exposition of a given subject delivered before an audience or class, as for the
purpose of instruction. For any students in university, lectures are said to play an
extremely important role. Especially at Faculty of Management and Tourism (FMT), Hanoi
University, when lectures are the only formal time teachers interact with students besides
tutorial. It is undeniable that lectures have contributed a lot into students’ study results.
However, our team realized that the proportion of student attending to these classes is not
a significant number. Furthermore, the outcome of FMT students recent year has been on a
decreasing track. Therefore, we conducted this research in two weeks with the sample of
50 k2013 students in FMT to discuss about the relationship between lecture skip and their
consequences. Based on the information gathered, we certify two hypotheses. The first is
whether 30% of students who do not attend the lecture get bad study result. The second
one is whether the proportion of students who attend the lectures have high scores exceed
these figures of that but skipping. The significance level of α = 0.05 was selected.
Throughout this research we hopefully to solve these questions and give some
recommendations to students within the faculty.
3
1. INTRODUCTION:
Hanoi university is proud to be in the vanguard of application of international studying
multidisciplinary programs with the highest standard. Based on it, Faculty of Management
and Tourism ( FMT) has offered students weekly two classes on each subject in terms of
lecture and tutorial class, each of which plays a particularly important role in delivering
the exclusive knowledge to students. The knowledge provided in the lecture time is the big
picture of subject matters and fundamental foundations on which you can build your own
knowledge. Tutorial classes are made with the aim to help students fully understand the
matter given in lectures and know how to apply what they learn in the reality. Even though
the fact is that attendance at both lectures and tutorials is necessary because the
knowledge gained from two classes supports to each other, it is likely that a huge number
of students have tendency to skip lectures that can not only make themselves find difficult
and hard to catch up with the knowledge provided in the tutorial class but also create
some gaps in the knowledge of students. After more than one semester studying at Faculty
of Management and Tourisms, we found that the study result of last semester was quite
gloomy with the average score going around 6.5 and the highest score not exceeding 9.0. A
doubtful question came up in our mind that are there any relationship between lecture
absenteeism and student’s performance in subjects? That promotes us to conduct a
primary research to figure out how non- lecture attendance has effects on the study results
of students in FMT.
To collect the subjective information for statistic , we deliver the questionnaires to 50 FMT
– k2013 students chosen randomly from population by the probability sampling method,
which focus on some issues including: Do you often skip lectures in the previous semester?
Why did you skip the lectures? Measure the FREQUENCY of your SKIPPING on each
subject? How much is your average mark? you think attending lectures directly affects
your study results? If “Not at all”, what is the possible reason?
4
The data obtained will follow the steps of being processed ,analyzed and evaluated
carefully by using Z- statistic test to provide the statistic inference. Methodology,
descriptive results, findings of the hypothesis test, project evaluation and some possible
recommendations are also included in this research.
2. METHEDOLOGY:
2.1. Population and sample:
o
o
Population: all K2013 students in Faculty of Management and Tourism.
Sample: 50 K2013 students in Faculty of Management and Tourism picked
randomly to do the survey .
2.2. Sample size:
The population is about 400 students of Faculty of Management and Tourism. As usual.
The larger the sample is, the more accuracy the characteristics of population have.
However, performing a large scale project leads to some difficulties such as financial cost
and time- consuming. Also, this research is about public opinion, therefore, we made a
decision about the sample size (n=50) which is considered to be reasonable and relatively
appropriate to present the objective of population.
2.3. Questionnaire design:
To gather the data for the project, the questionnaires is designed with two main parts. In
first part, we asked for participant’s identity including: their name, their names, gender,
student ID, email addresses and major to contact them in case of some complexity or
problems occur.
Second part includes 6 questions designed in order to research about the influence of
lecture absenteeism in studying performance. Here is the list of questions:
Question 1: Do you often skip lectures in the previous semester?
Question 2: Why did you skip the lectures?
Question 3: Measure the FREQUENCY of your SKIPPING on each subject?
Question 4: How much is your average mark?
Question 5: Do you think attending lectures directly affects your study results?
Question 6: If “Not at all” or “A little”, what is the possible reason?
The first and third question gives us an overview of prevalence of lecture attendance
(whether students take part in lecture or not) and the frequency of it in particular subjects
5
studying in the previous semester in terms of: Introduction to management,
Microeconomics, Principles of accounting and calculus. If the answer is “ No”, they can
move to question 5.
If the answer is “ Yes”, FMT students give the reasons for their absenteeism by giving the
answer for question 2. In the fourth question, we asked students for their study results in
last semester. After that, the next question designed to find out the opinion of FMT students
whether skipping lectures affect their study results. If the answer is “ Not at all” or “A little”
, students was asked to give reasonable explanation for their answer.
3. SAMPLING METHOD AND DATA COLLECTION:
3.1. Sampling method:
Sampling method plays an important role which influences the result of the project. In our
research, simple random sampling is used to make sure that every FMT students has the
same probability to be included in the sample. In order to receive exact and fast
information, we come randomly to the lecture and carry out delivered questionnaires.
3.2. Data collection:
After finishing the process of designing questionnaire and defining the suitable sampling
method, we distributed the questionnaires in one day. On Thursday 7th May, 50
questionnaires were distributed to 50 FMT students in the lecture’s break and then
collected immediately to ensure the number. We met some challenges when performing
this task because some participants lacked co-operation with unfulfilled personal
information ( email, class or ID).
The collection of the 50 respondents is presented in Appendix 2 and the table of organized
data is provided at the end of the report in Appendix 3.
3.3. Data process:
As soon as the task of delivery of the questionnaires had been finished, the data was
analyzed and solved by hand. The data was shown in both qualitative and quantitative,
therefore, we have the data done by Microsoft Excel 2013 with some common data
processing functions in terms of: COUNT, COUNTIF, FILTER, basic mathematic functions
such as SUM, SUMIF. We also calculated necessary statistics by hand.
6
3.4 Significant level:
The level of significance chosen is 0.05 to process hypothesis test.
4. DESCRIPTIVE RESULT AND FINDINGS:
From our survey’s results, we can conclude that of 50 FMT K13 students who did the
questionnaires, there are 19 students said that they have at least once skipped the lectures.
Therefore, the proportion of those who skipped lectures is smaller than those attending
lectures fully. In other words, a lot of FMT K13 students haven’t been absent from lectures
ever.
7
In the 3rd and 4th questions, students were asked about their frequency of skipping
lectures in terms of four subjects: ITM, CAL, POA and MIC as well as the average total
scores.Our purpose of surveying about that is to find the relationship between attending
lectures and the study results, whether frequently skipping lectures consequence to bad
scores and vice versa.
Firstly, about the frequency of skipping lectures, MIC is the lecture that students skip the
most. It is followed by CAL, and the last two subjects are POA and ITM.
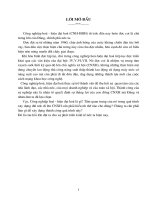
Secondly, as can be seen from the bar chart, the number of students who rarely skip is
three times higher than those who always skip in terms of high marks (18 and 6
respectively), or we can say that the more frequently students attend lectures, the higher
marks they acheive.
However, regarding to medium marks and low marks, the gap between the number of
“always skipping” and “rarely skipping” is very small (the difference is only 1 student).
Contributing to “low marks”, the amount of “always skipping” reaches 7 students, while
that of “rarely skipping” is 8. “Medium marks” consists of 6 and 5 students who always and
rarely skip respectively. Accordingly, students either attending lectures or skipping them
still have the same chance of getting unexpected marks. From that fact we can come to a
conclusion: joining lectures at a high frequency can not always guarantee high study
results for FMT K13 students. The reasons explaining for that fact will be discussed in
detail in question 6.
So there are different kinds of students? Those always skip lectures and those fully attend
lectures? The reason comes from the attitude of students toward lectures. In question 5, we
8
asked them to rate the level of inportance of attending lectures, whether going to lecture
classes directly affects study results. Of 50 students, 16 students approved that lectures
play a very important role in determining their marks, in contrast, only 9 students
considered lectures do not have any effect on the scores. And the rest 25 (also the most)
students feel that attending lectures have a little influence.
There are several reasons which responsible for the fact that up to 2/3 of the students did
not highly appreciate the role of lectures. According to them, there are many other factors
contributing to study results rather than lectures. Most of them found that self-study is
much better and effective than attending lectures. 8 out of 34 students believed that luck in
the exam can significantly affect their marks. Another 8 students think that tutorials are
much more effective than lectures as the numbers of students in tutorial classes are
extremely lower than those in lecture classes, so they can concentrate well on the lessons,
moreover, teachers in tutorials focus on solving excercises which helps students practice
how to apply theories on specific problems. Finally, only 2 students admitted they cheated
in the exam to achieve their scores.
After conducting the project, with the level of significance 5%, we can say that our
statistical evidence is sufficient and realiable enough to lead to a conclusion that attending
lectures does substaintially affect FMT K13 students’ study results.
According to the project’s findings, we are highly confident to say that attending lectures
frequently can help FMT students acheive higher scores. Moreover, there is enough
statistical evidence to infer that the proportion of students frequently attending lectures
and getting high result exceeds the proportion of those who get high results often skip the
lectures. Therefore, it is quite apperent that attending lectures is one of the key
determinants of students’ study results
5. HYPOTHESIS TESTING
5.1. Research question 1:
In some recent years, the proportion of FMT’s (Faculty of Management and Tourism )
students who fail the final exams ( bad result- under mark 5 ) is quite high, over 30%. Is
9
there sufficient evidence to conclude that over 30% of students who skip lectures get bad
study result (under mark 5).
a. Checking assumption:
When analyzing the relationship between skipping lectures and students result, the
respondents were asked the question:
+ Measure the FREQUENCY of your SKIPPING on each subject? Rarely / usually /
always.
+ Their average marks? Then we categories their average marks into 3 levels: low score
(under mark 5), fair (mark 5 - 7) and high score ( above mark 7).
Therefore, the data type is qualitative and we can not calculate the mean. It is obvious that
the method of testing is Z Test of proportion. The parameter of interest is the population
proportion p and the point estimator of this parameter is the sample proportion.
The requirements to test proportion by using Z Test include that population follows
Binomial distribution and sampling proportion is approximately normally distributed.
b. Checking condition:
np ≥ 5; nq ≥ 5
With n= 19
p = 0.3
q = 1 – p =1-0.3= 0.7
Obviously:
np= 19 * 0.3 = 5.7 > 5
nq = 19 * 0.7 =13.3 > 5
The sample proportion is approximately normally distributed.
c. Hypothesis testing procedure:
Let p be the proportion of FMT students who often skip lectures get bad study result
Based on the research questions, we have:
State the null hypothesis:
H0: p = 0.3
State the alternative hypothesis: Ha: p > 0.3
Now we conduct 6 steps to make decision:
Step 1 : The null and alternative hypothesis
10
H0: p = 0.3
Ha: p > 0.3
Step 2: Test statistic:
is standard normally distributed as np ≥ 5 & nq ≥ 5
Use Z test.
Step 3 : Significance level : α = 0.05
Step 4 : Decision rule : Critical value Z0.05=1.645. Reject H0 if z >1.645
Step 5 : Test value : = 13/19 = 0.6842
= = 3.6545
Step 6 : Conclusion
As z = 3.6545 > 1.645, we reject H0.
There is enough evidence to conclude that more than 30% of FMT’s student skipping
lectures get bad result at the significance level α = 0.05
5.2. Research question 2:
At the 5% significant level, do the data provide sufficient evidence to establish that among
the students who get high result, the proportion of students who attend lectures exceed the
proportion of those who do not attend the lectures?
a. Assumptions
From the hypothesis 1, we see that there is a link between skipping lectures and study
result. To examine deeper, we conduct the second test on whether the proportion of
students who attend lectures get high result exceed the proportion of those who get high
result but do not attend the lectures. The populations we choose are all K13 students in
major of Business Administration and Tourism. However, to fit the purpose of examining
the link between skipping lectures and students average result, we divide these students
into two groups: Group 1 consists of students who usually skip lectures and group 2
includes students who never or rarely skip lectures.
There are two categorical outcomes: proportion of students who have high score (mark 7
-10) (success) and proportion of students having low score (under mark 5). The parameter
11
is the difference between two population proportions, p1 - p2, and the point estimator of
each population proportion is p^
There are 19 out of 50 students replied that they always skip the lectures, therefore the
number of students going to lectures regularly is 31. Of the 19 students who skip lectures, 6
people have high result (mark 7 - 10). And of the 31 students having lectures, 18 of them
get good mark
b. Hypothesis testing procedure
Checking condition: n1p1 ≥ 5; n1q1 ≥ 5
n2p2 ≥ 5, n2q2 ≥ 5
With n1=19, n2=31
p1 = 0.58065, q1=0.41935
p2= 0.31579, q2 =0.68421
Obviously:
n1p1= 19 * 0.58065 = 11.03235 > 5
n1q1 = 19 * 0.41935 =7.96765 > 5
n2p2 = 31*0.31579 = 9.78949 > 5
n2q2 = 31 * 0.68421 = 21.21051 > 5
The sample proportion is approximately normally distributed.
The step statistical inference process is as follow:
•
Step 1: The null and alternative hypotheses are:
•
Step 2: Test statistics
Step 3: Level of significance:
Step 4:Decision rule:
Critical value: . Reject H0 if
• Step 5:Value of the statistic
1 = 18/31 =0.58065
2 = 6/19 =0.31579
= (6+18)/(19+31) = 0.48
= =1.81956
•
•
12
Step 6: Conclusion
Because z = 1.81956 > = 1.645 with Reject H0
Therefore with 5% level of significance, there is enough statistical evidence to infer that
•
the proportion of students who attend lectures get high result exceed the proportion of
those who get high result but do not attend the lectures.
6. EVALUATION:
6.1. Limitation:
Although all the data and information we collected for the project was gathered through
questionnaires, there are still some drawbacks that cannot be prevented. Firstly, FMT is a
big faculty - a combination of four majors with a huge number of students. This results in a
lot of different schedules, which accounts for their lack of patience and concern with our
given questions due to the demand for relax as well as time- saving. Therefore, it is a risk
that our project won’t be really objective. Another obstacle we have to deal with is that
many students, in a rush to complete all the paper, forgot to fulfill their personal
information: name. ID, email, class, … In terms of time frame, the project was conducted in
short period of time, so we chose qualitative data and z-test statistic for proportion to
reduce the assumptions required in the hypothesis testing. However, this also leads to
limitation in determining how significance skipping lecture can influence students’ results.
For example, in the questionnaire for qualitative method, we just asked the average total
result of subjects that students often skip and rarely skip lecture in categories such as
always, often, never … In contrast, if the method is quantitative, the questions can require
13
students to give exact marks they achieved, and the comparison would be more meaningful
and accurate.
6.2. Implication:
This project is meaningful for FMT because it shows the significance of attending lectures
for students to get better understanding of subjects and higher results. This survey
discovers that students who often skip lectures obtain lower mark/ results than ones who
keep catching up with lectures .However, the results of students who regularly attend
lectures are not really impressive. The initial reason may be the language barrier that take
them long time to get used to. Because of being unable to take in all the lessons, students
have the tendency to stay at home and use outlines. To enrich study quality, they should try
to totally focus on the knowledge that their teacher is conveying at the lecture or tutorial
sectionsand read more materials when having free time. Besides, lecturers had better find
a new, attractive and easy-to-understand teaching method so as to make students
interested in learning.
7. CONCLUSION AND RECOMMENDATION:
After conducting the project, with the level of significance 5%, we can say that our
statistical evidence is sufficient and reliable enough to lead to a conclusion that attending
lectures does substantially affect students’ study results.
According to the project’s findings, we are highly confident to say that attending lectures
frequently can help BA students achieve higher scores. Moreover, there is enough statistical
evidence to infer that the proportion of students frequently attending lectures and getting
high result exceeds the proportion of those who get high results often skip the lectures.
Therefore, it is quite apparent that attending lectures is one of the key determinants of
students’ study results.
Attending lectures might be can considered as a boring and useless obligation by several
university students. Luckily, that is just an assumption of a minority and a multitude of
students still holds a positive perception about the benefits of lectures and keeps joining
lectures. Though affected by many contributing, the benefits that lectures provide students
are irrefutable. The advantage about specialized knowledge relating to the major or the
tips or additional information about test offered in the lectures is clear. Besides, students
14
can reduce a massive portion of their self-study time after joining lectures as well. Based
on the actual fact that students are the ones who directly receive the profit from lectures,
so they themselves really should be conscious of the significance of lectures. They should
realize it on their own or university can rely on the consulting assistance from the tutors
who own skillful convincing capability to make it clear for the students from the very start
about the value of lectures.
In addition, evoking the students’ interest for lectures would be a great approach to
encourage students to raise attendance rate. One recommendation posed is upgrading the
teaching quality of lecturers. The lecturers are sure to have a solid knowledge background,
but their transferring and inspiring ability are not really adequate to attract students.
Advisably the lectures can try some new teaching techniques, increase the interactive
activities in classroom to inhibit boredom and boost up bonding between lecturers and
students.
In a nutshell, the students are not advised to play truant. This is a serious problem since it
at first hand places negative impact on studying result at the end of semesters. To get rid of
this issue perpetually and get 100% students to attend lectures, the integral coordination
of both lecturers and students is in need.
REFERENCES:
Bennett, R. (2001) Lecturers' Attitudes Towards New Teaching Methods, International
Journal of Management Education, 2, 1, pp. 42-56.
Bennett, R. and Kottasz, R. (2001) Marketing Undergraduates' Attitudes Towards
QueryBased Instructional Machines as a Possible Learning Medium, British Journal of
Educational Technology, 32, 4, pp. 471-482.
Churchill, G. A. (1999) Marketing Research Methodological Foundations.5th Ed. Dryden
Press. Orlando, FL.
Csikszentmihalyi, M. and Larson, R. (1984) Being Adolescent, New York, Basic Books
Confederation of British Industry (1987) Absence from Work, A Survey of Non-Attendance
and Sickness Absence, London.
Cooper, C. L., Davidson, M. J. and Robinson, P. (1982) Stress in the Police Service, Journal
ofOccupational Medicine, 24, pp. 30-36.
Creswell, J. W. (1998) Qualitative Inquiry and Research Design: Choosing Among Five
Traditions.Sage Publications, London.
Entwistle, N. (1998) Motivation and Approaches to Learning in Brown, S., Armstrong, S.
and
15
Thompson, G. (1998) (Eds.) Motivating Students, Kogan Page, London.
Fleming, N. (1992) Why don't they Attend?, Occassional Paper, Education Unit, Lincoln
University.
Fleming, N. (1995) Attendance. Why don't They Attend? Part Two, Discussion Paper,
Education Unit, Lincoln University.
Ford, J., Bosworth D. and Wilson, R. (1995) Part Time Work and Full Time Higher
Education, Studies in Higher Education, 20, 2, pp. 187-202.
Gottfried, A. (1985) Academic Intrinsic Motivation in Elementary and Junior High School
Students', Journal of Educational Psychology, 77, pp. 631-645.
Gupta, N. and Beehr, T. A. (1979) Job Stress and Employee Behaviour, Organisation
Behaviour and Human Performance, 23, pp. 373-87.
Hidi, S. (1990) Interest and its Contribution as a Mental Resource for Learning, Review of
Educational Research, 60, pp. 549-571.
16
APPENDIX A – QUESTIONARE:
QUESTIONAIRE
We are students from BA13 of Faculty of Management and Tourism in Hanoi University.
We are doing a statistic project about the importance of skipping lectures towards study
results of FMT-k13 students as a way to evaluate students’ knowledge about the result of
this act. We would appreciate if you could spend a few minutes to take part in answering
the questions below. These multiple-choice questions will help us collect data that are
necessity for our project.
Thank you very much!
Personal Information:
Name:..............................................................................................................................................................................
Class: ...............................................................................................................................................................................
Gender: ..........................................................................................................................................................................
Major: .............................................................................................................................................................................
Student ID: ...................................................................................................................................................................
Email:..............................................................................................................................................................................
Questions:
1. Do you often skip lectures in the previous semester?
❏ Yes ( Move to question 2)
❏ No ( Move to question 5)
2.
❏
❏
❏
❏
Why did you skip the lectures?
Unapporiate teaching methods
No attendance check
Personal business
Other
17
3. Measure the FREQUENCY of your SKIPPING on each subject?
Rarely
Usually
Always
ITM
MIC
CAL
POA
4. How much is your average mark? ………………………
5.
❏
❏
❏
Do you think attending lectures directly affects your study results?
Very much
A little
Not at all.
6.
❏
❏
❏
❏
If “Not at all” or “A little”, what is the possible reason?
Self-study is much better
I got lucky in exams.
I cheated
Others
THANK YOU FOR YOUR PARTICIPATION!!!
APPENDIX B – SURVEY RESULT:
ID
Full Name
ĐTB
1206090011
Trần Hương Giang
1
Q1
Q2
Q5
A B A B C D A B C
x
x
x
18
Q6
A B C D
x
1304000017
1304000028
1304000097
1204000078
1206090086
1304000022
1306090045
1206090056
1206090019
1304000073
1304000104
1304000043
1306090057
1304000098
1304000006
1306090073
1304000100
1306090019
1304040096
1204040086
1304040057
1204000080
1304010042
1306090032
1304000036
1306090026
1204040002
1304000019
1306090053
1306090029
1304000014
1304000034
1304000054
1304000071
1304010038
1304010062
1304010057
1304010087
1306090049
1306090061
1304000048
1304000066
1204000056
1306090075
Lê Văn Giáp
Trần Đại Hiệp
Nguyễn Tuấn Trung
Nguyễn Đan Phượng
Nguyễn Tiến Thắng
Lê T. Thu Hằng
Nguyên Văn Linh
Nguyễn Thị Kim Oanh
Lê Mai Hương
Đoàn Thị Thắm
Đặng Thanh Vân
Lê Vũ Tuấn Khang
Nguyễn Thị Ngọc
Đào Anh Tú
Nguyễn Ngọc Anh
Nguyễn Thị Hồng Như
Nguyễn Minh Tú
Nguyễn Minh Đức
Nguyễn Thu Trang
Đặng Thị Thơ
Phạm Nguyễn Hồng Minh
Nguyễn Văn Quảng
Ma Thị Vân Huyền
Trần Thị Hiền
Bùi Thanh Huyền
Nguyễn Thị Thu Hà
Lưu Ngọc Anh
Phạm Việt Hà
Đào Thị Minh
Phan Thị Hằng
Nguyễn Xuân Cường
Trần Thị Thu Hường
Phùng Ngọc Phương Ly
Đỗ Linh Phương
Đinh Thị Hương
Nguyễn Thị Kim Nga
Vũ Thị Mai
Duy Thị Huyền Trang
Tạ Thị Luyến
Lê Hồng Nhung
Phạm Mỹ Linh
Lê Hồng Nhung
Nguyễn Ngọc Linh
Đỗ Hà Thu
3
3
4
4
4
4
5
5
5
5
5
5
5
5
6
6
6
6
6
6
6
6
7
7
7
7
7
7
7
7
7
7
7
7
7
7
8
8
8
8
8
8
8
8
x
x
x
x
x
x
x
x
x
x
x
x
x
x
x
x
x
x
x
x
x
x
x
x
x
x
x
x
x
x
x
x
x
x
x
x
x
x
x
x
x
x
x
x
x
x
x
x
x
x
x
x
x
x
x
x
x
x
x
x
x
x
x
x
x
x
x
x
x
x
x
x
x
x
x
x
x
19
x
x
x
x
x
x
x
x
x
x
x
x
x
x
x
x
x
x
x
x
x
x
x
x
x
x
x
x
x
x
x
x
x
x
x
x
x
x
x
x
x
x
x
x
x
x
x
x
x
x
x
x
x
x
x
x
x
x
x
x
x
x
x
x
x
x
x
x
x
x
x
x
x
x
x
x
x
x
x
x
x
x
x
x
x
x
x
1304000055
1304000047
1204000033
1306090027
1306090077
Đào Phương Mai
Trịnh Hạnh Lê
Nguyễn Thị Hiếu Hạnh
Phạm Thị Hà
Nghiêm Xuân Thương
8
8
8
8
9
x
x
x
x
x
x
x
x
x
x
x
x
x
x
x
x
:
APPENDIX C –POPULATION AND SAMPLE LIST:
ID
Full Name
1206090011
1304000017
1304000028
1304000097
Trần Hương Giang
Lê Văn Giáp
Trần Đại Hiệp
Nguyễn Tuấn Trung
20
1204000078
1206090086
1304000022
1306090045
1206090056
1206090019
1304000073
1304000104
1304000043
1306090057
1304000098
1304000006
1306090073
1304000100
1306090019
1304040096
1204040086
1304040057
1204000080
1304010042
1306090032
1304000036
1306090026
1204040002
1304000019
1306090053
1306090029
1304000014
1304000034
1304000054
1304000071
1304010038
1304010062
1304010057
1304010087
1306090049
1306090061
1304000048
1304000066
1204000056
1306090075
1304000055
1304000047
1204000033
Nguyễn Đan Phượng
Nguyễn Tiến Thắng
Lê T. Thu Hằng
Nguyên Văn Linh
Nguyễn Thị Kim Oanh
Lê Mai Hương
Đoàn Thị Thắm
Đặng Thanh Vân
Lê Vũ Tuấn Khang
Nguyễn Thị Ngọc
Đào Anh Tú
Nguyễn Ngọc Anh
Nguyễn Thị Hồng Như
Nguyễn Minh Tú
Nguyễn Minh Đức
Nguyễn Thu Trang
Đặng Thị Thơ
Phạm Nguyễn Hồng Minh
Nguyễn Văn Quảng
Ma Thị Vân Huyền
Trần Thị Hiền
Bùi Thanh Huyền
Nguyễn Thị Thu Hà
Lưu Ngọc Anh
Phạm Việt Hà
Đào Thị Minh
Phan Thị Hằng
Nguyễn Xuân Cường
Trần Thị Thu Hường
Phùng Ngọc Phương Ly
Đỗ Linh Phương
Đinh Thị Hương
Nguyễn Thị Kim Nga
Vũ Thị Mai
Duy Thị Huyền Trang
Tạ Thị Luyến
Lê Hồng Nhung
Phạm Mỹ Linh
Lê Hồng Nhung
Nguyễn Ngọc Linh
Đỗ Hà Thu
Đào Phương Mai
Trịnh Hạnh Lê
Nguyễn Thị Hiếu Hạnh
21
1306090027
1306090077
Phạm Thị Hà
Nghiêm Xuân Thương
22