Design and construction of driven pile foundations
Bạn đang xem bản rút gọn của tài liệu. Xem và tải ngay bản đầy đủ của tài liệu tại đây (650.74 KB, 59 trang )
Design and Construction of Driven Pile
Foundations—Lessons Learned on the
Central Artery/Tunnel Project
PUBLICATION NO. FHWA-HRT-05-159
JUNE 2006
Research, Development, and Technology
Turner-Fairbank Highway Research Center
6300 Georgetown Pike
McLean, VA 22101-2296
FOREWORD
The purpose of this report is to document the issues related to the design and construction of
driven pile foundations at the Central Artery/Tunnel project. Construction issues that are
presented include pile heave and the heave of an adjacent building during pile driving.
Mitigation measures, including the installation of wick drains and the use of preaugering, proved
to be ineffective. The results of 15 dynamic and static load tests are also presented and suggest
that the piles have more capacity than what they were designed for. The information presented in
this report will be of interest to geotechnical engineers working with driven pile foundation
systems.
Gary L. Henderson
Director, Office of Infrastructure
Research and Development
NOTICE
This document is disseminated under the sponsorship of the U.S. Department of Transportation
in the interest of information exchange. The U.S. Government assumes no liability for the use of
the information contained in this document.
The U.S. Government does not endorse products or manufacturers. Trademarks or
manufacturers’ names appear in this report only because they are considered essential to the
objective of the document.
QUALITY ASSURANCE STATEMENT
The Federal Highway Administration (FHWA) provides high-quality information to serve
Government, industry, and the public in a manner that promotes public understanding. Standards
and policies are used to ensure and maximize the quality, objectivity, utility, and integrity of its
information. FHWA periodically reviews quality issues and adjusts its programs and processes to
ensure continuous quality improvement.
Technical Report Documentation Page
1. Report No.
2. Government Accession No.
FHWA-HRT-05-159
4. Title and Subtitle
Design and Construction of Driven Pile Foundations—
Lessons Learned on the Central Artery/Tunnel Project
3. Recipient’s Catalog No.
5. Report Date
June 2006
6. Performing Organization Code
7. Author(s)
Aaron S. Bradshaw and Christopher D.P. Baxter
8. Performing Organization Report No.
9. Performing Organization Name and Address
University of Rhode Island
Narragansett, RI 02882
10. Work Unit No.
12. Sponsoring Agency Name and Address
Office of Infrastructure Research and Development
Federal Highway Administration
6300 Georgetown Pike
McLean, VA 22101-2296
11. Contract or Grant No.
DTFH61-03-P-00174
13. Type of Report and Period Covered
Final Report
January 2003–August 2003
14. Sponsoring Agency Code
15. Supplementary Notes
Contracting Officer’s Technical Representative (COTR): Carl Ealy, HRDS-06
16. Abstract
Five contracts from the Central Artery/Tunnel (CA/T) project in Boston, MA, were reviewed to document issues
related to design and construction of driven pile foundations. Given the soft and compressible marine clays in the
Boston area, driven pile foundations were selected to support specific structures, including retaining walls,
abutments, roadway slabs, transition structures, and ramps. This report presents the results of a study to assess the
lessons learned from pile driving on the CA/T. This study focused on an evaluation of static and dynamic load test
data and a case study of significant movement of an adjacent building during pile driving. The load test results
showed that the piles have more capacity than what they were designed for. At the site of significant movement of an
adjacent building, installation of wick drains and preaugering to mitigate additional movement proved to be
ineffective. Detailed settlement, inclinometer, and piezometer data are presented.
18. Distribution Statement
No restrictions. This document is available to the public
through the National Technical Information Service,
Springfield, VA 22161.
21. No. of Pages 22. Price
20. Security Classif. (of this
page)
58
Unclassified
17. Key Words
Driven piles, heave, CAPWAP, static load test,
Boston tunnel
19. Security Classif. (of this report)
Unclassified
Form DOT F 1700.7 (8-72)
Reproduction of completed page authorized
SI* (MODERN METRIC) CONVERSION FACTORS
APPROXIMATE CONVERSIONS TO SI UNITS
Symbol
When You Know
in
ft
yd
mi
inches
feet
yards
miles
Multiply By
LENGTH
25.4
0.305
0.914
1.61
To Find
Symbol
millimeters
meters
meters
kilometers
mm
m
m
km
square millimeters
square meters
square meters
hectares
square kilometers
mm
2
m
2
m
ha
2
km
AREA
2
in
2
ft
2
yd
ac
2
mi
square inches
square feet
square yard
acres
square miles
645.2
0.093
0.836
0.405
2.59
fl oz
gal
ft3
3
yd
fluid ounces
gallons
cubic feet
cubic yards
oz
lb
T
ounces
pounds
short tons (2000 lb)
o
Fahrenheit
fc
fl
foot-candles
foot-Lamberts
lbf
lbf/in2
poundforce
poundforce per square inch
2
VOLUME
29.57
milliliters
3.785
liters
0.028
cubic meters
0.765
cubic meters
3
NOTE: volumes greater than 1000 L shall be shown in m
mL
L
m3
3
m
MASS
28.35
0.454
0.907
grams
kilograms
megagrams (or "metric ton")
TEMPERATURE (exact degrees)
F
5 (F-32)/9
or (F-32)/1.8
g
kg
Mg (or "t")
Celsius
o
lux
candela/m2
lx
cd/m2
C
ILLUMINATION
10.76
3.426
FORCE and PRESSURE or STRESS
4.45
6.89
newtons
kilopascals
N
kPa
APPROXIMATE CONVERSIONS FROM SI UNITS
Symbol
When You Know
mm
m
m
km
millimeters
meters
meters
kilometers
2
Multiply By
LENGTH
0.039
3.28
1.09
0.621
To Find
Symbol
inches
feet
yards
miles
in
ft
yd
mi
square inches
square feet
square yards
acres
square miles
in
ft2
2
yd
ac
2
mi
fluid ounces
gallons
cubic feet
cubic yards
fl oz
gal
3
ft
3
yd
ounces
pounds
short tons (2000 lb)
oz
lb
T
AREA
mm
m2
2
m
ha
2
km
square millimeters
square meters
square meters
hectares
square kilometers
0.0016
10.764
1.195
2.47
0.386
mL
L
3
m
3
m
milliliters
liters
cubic meters
cubic meters
g
kg
Mg (or "t")
grams
kilograms
megagrams (or "metric ton")
o
Celsius
2
VOLUME
0.034
0.264
35.314
1.307
MASS
C
0.035
2.202
1.103
TEMPERATURE (exact degrees)
1.8C+32
Fahrenheit
o
foot-candles
foot-Lamberts
fc
fl
F
ILLUMINATION
lx
2
cd/m
lux
2
candela/m
N
kPa
newtons
kilopascals
0.0929
0.2919
FORCE and PRESSURE or STRESS
0.225
0.145
poundforce
poundforce per square inch
lbf
2
lbf/in
*SI is the symbol for the International System of Units. Appropriate rounding should be made to comply with Section 4 of ASTM E380.
(Revised March 2003)
ii
TABLE OF CONTENTS
Page
CHAPTER 1. INTRODUCTION ................................................................................................ 1
ROLE OF DRIVEN PILE FOUNDATIONS ON THE CA/T PROJECT ......................... 1
OBJECTIVES ..................................................................................................................... 3
SCOPE ................................................................................................................................ 3
CHAPTER 2. DRIVEN PILE DESIGN CRITERIA AND SPECIFICATIONS.................... 5
SUBSURFACE CONDITIONS ......................................................................................... 5
DESIGN CRITERIA AND SPECIFICATIONS ................................................................ 9
Pile Types .................................................................................................................... 9
Preaugering Criteria................................................................................................... 10
Pile Driving Criteria .................................................................................................. 10
Axial Load and Pile Load Test Criteria..................................................................... 13
CHAPTER 3. CONSTRUCTION EQUIPMENT AND METHODS .................................... 15
EQUIPMENT AND METHODS ..................................................................................... 15
CONSTRUCTION-RELATED ISSUES.......................................................................... 19
Pile Heave.................................................................................................................. 19
Soil Heave.................................................................................................................. 21
Summary.................................................................................................................... 27
CHAPTER 4. DYNAMIC AND STATIC PILE LOAD TEST DATA .................................. 29
LOAD TEST METHODS................................................................................................. 29
Dynamic Load Test Methods..................................................................................... 29
Static Load Test Methods .......................................................................................... 30
LOAD TEST RESULTS................................................................................................... 33
Dynamic Results and Interpretation .......................................................................... 35
Comparison of CAPWAP Data ................................................................................. 38
Static Load Test Data................................................................................................. 39
Comparison of Dynamic and Static Load Test Data ................................................. 41
CHAPTER 5. COST DATA OF DRIVEN PILES................................................................... 43
CHAPTER 6. LESSONS LEARNED ....................................................................................... 45
REFERENCES............................................................................................................................ 47
iii
LIST OF FIGURES
Page
Figure 1. Locations of selected contracts from the CA/T project................................................... 2
Figure 2. Soil profile at the contract C07D1 site as encountered in Boring EB3-5........................ 6
Figure 3. Soil profile at the contract C07D2 site as encountered in Boring EB2-149.................... 7
Figure 4. Soil profile at the contract C08A1 site as encountered in Boring EB6-37...................... 7
Figure 5. Soil profile at the contract C09A4 site as encountered in Boring IC10-13. ................... 8
Figure 6. Soil profile at the contract C19B1 site as encountered in Boring AN3-101. .................. 8
Figure 7. Typical pile details for a 30-cm-diameter PPC pile. ..................................................... 11
Figure 8. Typical pile details for a 41-cm-diameter PPC pile with stinger. ................................. 12
Figure 9. Single-acting diesel hammer. ........................................................................................ 16
Figure 10. Double-acting diesel hammer...................................................................................... 17
Figure 11. Single-acting hydraulic hammer.................................................................................. 17
Figure 12. Typical pile driving record. ......................................................................................... 18
Figure 13. Site plan, piling layout for the arrivals tunnel at Logan Airport. ................................ 19
Figure 14. Site plan showing locations of piles, building footprint, and geotechnical
instrumentation. ................................................................................................................ 22
Figure 15. Settlement data obtained during first phase of pile driving......................................... 23
Figure 16. Settlement data obtained during second phase of pile driving. ................................... 25
Figure 17. Multipoint heave gauge data obtained during second phase of pile driving. .............. 25
Figure 18. Pore pressure data obtained during second phase of pile driving. .............................. 26
Figure 19. Inclinometer data obtained during second phase of pile driving................................. 27
Figure 20. Example of CAPWAP signal matching, test pile 16A1-1........................................... 30
Figure 21. Typical static load test arrangement showing instrumentation. .................................. 31
Figure 22. Load-displacement curves for pile toe, test pile 16A1-1............................................. 37
Figure 23. CAPWAP capacities at end of initial driving (EOD) and beginning
of restrike (BOR). ............................................................................................................. 39
Figure 24. Deflection of pile head during static load testing of pile 12A1-1. .............................. 40
Figure 25. Distribution of load in pile 12A1-1. ............................................................................ 40
Figure 26. Deflection of pile head during static load testing of pile 14........................................ 40
Figure 27. Distribution of load in pile 14. .................................................................................... 40
Figure 28. Deflection of pile head during static load testing of pile IPW. ................................... 41
Figure 29. Distribution of load in pile IPW. ................................................................................. 41
iv
LIST OF TABLES
Page
Table 1. Summary of selected contracts using driven pile foundations. ........................................ 2
Table 2. Summary of pile types used on the selected CA/T contracts. ........................................ 10
Table 3. Summary of pile types and axial capacity (requirements identified in the selected
contracts). ....................................................................................................................... 13
Table 4. Summary of pile driving equipment used on the selected contracts............................... 15
Table 5. Summary of pile spacing from selected contracts. ......................................................... 21
Table 6. Maximum building heave observed during pile driving................................................. 23
Table 7. Summary of pile and preauger information.................................................................... 34
Table 8. Summary of pile driving information. ............................................................................ 34
Table 9. Summary of CAPWAP capacity data............................................................................. 35
Table 10. Summary of CAPWAP soil parameters........................................................................ 38
Table 11. Summary of static load test data. .................................................................................. 39
Table 12. Summary of dynamic and static load test data. ............................................................ 42
Table 13. Summary of contractor’s bid costs for pile driving. ..................................................... 43
Table 14. Summary of contractor’s bid costs for preaugering...................................................... 43
v
CHAPTER 1. INTRODUCTION
Pile foundations are used extensively for the support of buildings, bridges, and other structures to
safely transfer structural loads to the ground and to avoid excess settlement or lateral movement.
They are very effective in transferring structural loads through weak or compressible soil layers
into the more competent soils and rocks below. A “driven pile foundation” is a specific type of
pile foundation where structural elements are driven into the ground using a large hammer. They
are commonly constructed of timber, precast prestressed concrete (PPC), and steel (H-sections
and pipes).
Historically, piles have been used extensively for the support of structures in Boston, MA. This
is mostly a result of the need to transfer loads through the loose fill and compressible marine
clays that are common in the Boston area. Driven piles, in particular, have been a preferred
foundation system because of their relative ease of installation and low cost. They have played
an important role in the Central Artery/Tunnel (CA/T) project.
ROLE OF DRIVEN PILE FOUNDATIONS ON THE CA/T PROJECT
The CA/T project is recognized as one of the largest and most complex highway projects in the
United States. The project involved the replacement of Boston’s deteriorating six-lane, elevated
central artery (Interstate (I) 93) with an underground highway; construction of two new bridges
over the Charles River (the Leverett Circle Connector Bridge and the Leonard P. Zakim Bunker
Hill Bridge); and the extension of I–90 to Boston’s Logan International Airport and Route 1A.
The project has been under construction since late 1991 and is scheduled to be completed in
2005.(1)
Driven pile foundations were used on the CA/T for the support of road and tunnel slabs, bridge
abutments, egress ramps, retaining walls, and utilities. Because of the large scale of the project,
the construction of the CA/T project was actually bid under 73 separate contracts. Five of these
contracts were selected for this study, where a large number of piles were installed, and 15 pile
load tests were performed. The locations of the individual contracts are shown in figure 1 and
summarized in table 1. A description of the five contracts and associated pile-supported
structures is also given below.
1. Contract C07D1 is located adjacent to Logan Airport in East Boston and included
construction of a part of the I–90 Logan Airport Interchange roadway network. New
roadways, an egress ramp, retained fill sections, a viaduct structure, and retaining walls were
all constructed as part of the contract.(2) Driven piles were used primarily to support the
egress ramp superstructure, abutments, roadway slabs, and retaining walls.
2. Contract C07D2 is located adjacent to Logan Airport in East Boston and included
construction of a portion of the I–90 Logan Airport Interchange. Major new structures
included highway sections, a viaduct structure, a reinforced concrete open depressed
roadway (boat section), and at-grade approach roadways.(2) Driven piles were used to support
the boat section, walls and abutments, and portions of the viaduct.
1
C8A1
C19B1
C7D1/D2
I-93
I-90
C9A4
Figure 1. Locations of selected contracts from the CA/T project.(3)
Table 1. Summary of selected contracts using driven pile foundations.
Contract
C07D1
C07D2
C08A1
C09A4
C19B1
Location
Logan Airport
Logan Airport
Logan Airport
Downtown
Charlestown
Description
I–90 Logan Airport Interchange
I–90 Logan Airport Interchange
I–90 and Route 1A Interchange
I–93/I–90 Interchange, I-93 Northbound
I–93 Viaducts and Ramps North of the Charles River
3. Contract C08A1 is located just north of Logan Airport in East Boston and included
construction of the I–90 and Route 1A interchange. This contract involved new roadways,
retained fill structures, a viaduct, a boat section, and a new subway station.(2) Both vertical
and inclined piles were used to support retaining walls and abutments.
4. Contract C09A4 is located just west of the Fort Point Channel in downtown Boston. The
contract encompassed construction of the I–90 and I–93 interchange, and the northbound
section of I–93. Major new structures included surface roads, boat sections, tunnel sections,
viaducts, and a bridge.(2) Piles were used to support five approach structures that provide a
transition from on-grade roadways to the viaduct sections. Piles were also used to support
utility pipelines.
5. Contract C19B1 is located just north of the Charles River in Charlestown. The contract
included the construction of viaduct and ramp structures forming an interchange connecting
Route 1, Storrow Drive, and I–93 roadways. Major new structures included roadway
transition structures, boat sections, retaining walls, and a stormwater pump station.(2) Piles
2
were used to support the ramp structures that transition from on-grade roadways to the
viaduct or boat sections.
OBJECTIVES
The overall objective of this report is to document the lessons learned from the installation of
driven piles on the CA/T project. This includes review and analysis of pile design criteria and
specifications, pile driving equipment and methods, issues encountered during construction,
dynamic and static load test data, and cost data for different pile types and site conditions.
SCOPE
This report consists of six chapters, the first of which presents introductory and background
information about the contracts where significant pile driving occurred. The second chapter
discusses the criteria and specifications used for pile design and construction on the CA/T
project. The third chapter documents the equipment and methods used for pile driving. Major
construction issues encountered during driving, such as pile and soil heave, are also discussed.
The fourth chapter presents the results of pile load tests performed on test piles using static and
dynamic test methods, including a discussion of axial capacity, dynamic soil parameters, and pile
driving criteria. The fifth chapter presents the unit costs for pile driving and preaugering for the
different pile types used, as identified in the original construction bids. Finally, the sixth chapter
summarizes the important findings of this study.
3
CHAPTER 2. DRIVEN PILE DESIGN CRITERIA
AND SPECIFICATIONS
This chapter presents the pile design criteria and specifications used on the CA/T project in
contracts C07D1, C07D2, C08A1, C09A4, and C19B1. These include information on the types
of piles used, capacity requirements, minimum preaugering depths, and testing requirements.
The subsurface conditions on which the design criteria were based are also discussed.
SUBSURFACE CONDITIONS
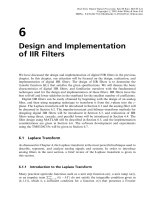
Representative soil profiles from each of the contract sites are shown in figures 2 through 6
based on the interpretation of geotechnical borings. (See references 4, 5, 6, 7, 8, 9, and 10)
As shown in figures 2 through 5, the conditions encountered at sites in East Boston (C07D1,
C07D2, and C08A1) and in downtown Boston (C09A4) are similar. The subsurface conditions at
these locations typically consisted of fill overlying layers of organic silt, inorganic sand or silt,
marine clay, glacial soils, and bedrock. The subsurface conditions shown in figure 6 for the
C19B1 site in Charlestown, however, were different from the other four sites. Organic soils and
marine clays were only encountered to a limited extent at the site. Also, the thickness of the fill
layer was greater relative to the other sites.
The physical properties and geological origin of the soils encountered at the contract sites are
described below.(11-12)
Bedrock: The bedrock in the area consists of argillite from the Cambridge formation. The
condition of the bedrock varies considerably with location, even within a given site. Evaluation
of rock core samples indicates that the rock is typically in a soft and weathered condition and
contains a significant amount of fracturing. However, hard and sound bedrock was found at some
locations.
Glacial Soils: The glacial soils were deposited during the last glaciation approximately 12,000
years ago. These deposits include glacial till, and glaciomarine, glaciolacustrine, and
glaciofluvial soils. Till is characterized by a mass of unsorted debris that contains angular
particles composed of a wide variety of grain sizes, ranging from clay-sized particles to large
boulders. Glaciomarine or glaciolacustrine deposits generally consist of clay, silt, and sand,
whereas glaciofluvial deposits contain coarser grained sand and gravel. The glacial soils are
typically dense in nature as indicated by high standard penetration test (SPT) resistance, and the
piles were typically terminated in these deposits.
Marine Soils: Marine soils were deposited over the glacial soils during glacial retreat in a
quiescent deepwater environment. The marine clay layer, as shown in figures 2 through 5, is the
thickest unit in the profile, but was encountered only to a limited extent at the Charlestown site.
The clay is generally overconsolidated in the upper portions of the layer and is characterized by
relatively higher strengths. The overconsolidation is a result of past desiccation that occurred
during a period of low sea level. By comparison, the deeper portions of the clay layer are much
5
softer and penetration of the SPT split spoon can sometimes occur with just the weight of the
drilling rods alone.
Inorganic Soils: Inorganic silts and sands are typically encountered overlying the marine soils.
These soils were deposited by alluvial processes.
Organic Soils: The organic soils that are encountered below the fill generally consist of organic
silt and may contain layers of peat or fine sand. These soils are the result of former tidal marshes
that existed along the coastal areas.
Fill Soils: Fill material was placed in the more recent past to raise the grade for urban
development. The fill layer is highly variable in its thickness and composition, ranging from silts
and clays to sands and gravels. The consistency or density is also variable as indicated by the
SPT blow counts. The variability in the fill is attributed to the characteristics of the particular
borrow source material and the methods of placement.
SPT N Value
1
10
ET2-C2
100
0
Fill
5
Organic Silt
Sand
10
15
Depth (m)
20
25
Marine Clay
30
35
40
Sand (Glaciofluvial)
45
50
Glacial Till
EB3-5
Bedrock
55
Figure 2. Soil profile at the contract C07D1 site as encountered in Boring EB3-5.
6
SPT N Value
1
10
923
100
0
Fill
5
Organic Silt
Sand
10
Depth (m)
15
Marine Clay
20
25
30
Silt(Glaciomarine)
35
EB2-149
Bedrock
40
Figure 3. Soil profile at the contract C07D2 site as encountered in Boring EB2-149.
SPT N Value
1
10
ET2-C2
100
0
Fill
Silt and Sand
10
20
Depth (m)
Marine Clay
30
40
50
Sand and Gravel
(Glaciofluvial)
60
EB6-37
Bedrock
70
Figure 4. Soil profile at the contract C08A1 site as encountered in Boring EB6-37.
7
SPT N Value
1
10
12A1-1
100
0
Fill
5
Organic Silt
10
15
Depth (m)
20
Marine Clay
25
30
35
40
Sand and Silt
(Glaciofluvial)
45
IC10-13
Bedrock
50
Figure 5. Soil profile at the contract C09A4 site as encountered in Boring IC10-13.
SPT N Value
1
10
100
Organic Silt
IPW
0
5
Granular Fill
Depth (m)
10
Sand
15
Gravel
(Glaciomarine)
20
Glacial Till
AN3-101
Bedrock
25
Figure 6. Soil profile at the contract C19B1 site as encountered in Boring AN3-101.
8
DESIGN CRITERIA AND SPECIFICATIONS
The variable fill and compressible clay soils encountered at depth necessitated the use of deep
foundations. Driven piles were selected, and design criteria and specifications were developed
for their installation, ultimate capacity, and testing. Because the CA/T project was located in
Massachusetts, the design criteria were required to satisfy the regulations given in the
Massachusetts State building code.(13) The technical content of the State code is based on the
1993 edition of the Building Officials and Code Administrators (BOCA) national building code.
The specifications that were used for each CA/T contract are contained in two documents of the
Massachusetts Highway Department (MHD). The first document includes the general
requirements for all CA/T contracts and is entitled Supplemental Specifications and CA/T
Supplemental Specifications to Construction Details of the Standard Specifications for Highways
and Bridges (Division II) for Central Artery (I-93)/Tunnel (I-90) Project in the City of Boston.(14)
The specifications pertaining to individual contracts are covered in a second document
concerning special provisions.(15) The special provisions are necessary given the uniqueness of
the environmental conditions, soil conditions, and structure types found in each contract. The
special provisions present specific details regarding the pile types, pile capacity requirements,
and minimum preaugering depths.
Information selected from the specification regarding pile types, preaugering criteria, pile driving
criteria, and axial load and test criteria is highlighted below.
Pile Types
Two types of piles were specified on the selected contracts of the CA/T: (1) PPC piles, and
(2) concrete-filled steel pipe piles. The PPC piles were fabricated using 34.5- to 41.3-megapascal
(MPa) (28-day strength) concrete and were prestressed to 5.2 to 8.3 MPa. The design drawings
of typical 30-centimeter (cm)- and 41-cm-diameter square PPC piles are shown in figures 7 and
8, respectively.
To prevent damage to the pile tips during driving in very dense materials, the PPC piles were
also fitted with 1.5-meter (m)-long steel H-pile “stingers.” In the 41-cm-diameter PPC piles, an
HP14x89 section was used as the stinger. The stingers were welded to a steel plate that was cast
into the pile toe, as shown in figure 8. Stingers were used intermittently on the 30-m-diameter
PPC piles, consisting of HP10 by 42 sections.
The concrete-filled steel pipe piles were 31 to 61 cm in diameter, with wall thicknesses ranging
from 0.95 to 1.3 cm. The piles were driven closed-ended by welding a steel cone or flat plate
onto the pile tip prior to driving. Once the pile was driven to the required depth, the pile was
filled with concrete.
A summary of the pile types used on the CA/T is given in table 2, along with the estimated
quantities driven. The quantities are based on the contractor’s bid quantities that were obtained
directly from Bechtel/Parsons Brinckerhoff. As shown in table 2, the 41-cm-diameter PPC piles
were the dominant pile type used, accounting for more than 70 percent of the total length of pile
driven.
9
Table 2. Summary of pile types used on the selected CA/T contracts.
Pile Type
32-cm pipe
41-cm pipe
61-cm pipe
30-cm square PPC
41-cm square PPC
C07D1
7,969
32,918
Estimated Length of Pile Driven (m)
C07D2
C08A1
C09A4
C19B1
5,550
5,578
296
3,981
792
3,658
2,177
19,879
8,406
14,326
6,279
Total
5,550
5,578
296
18,577
81,808
Preaugering Criteria
Preaugering was specified for all piles that were installed in embankments or within the specified
limits of adjacent structures. Settlement problems observed at the Hilton hotel (contract C07D1)
initiated the use of preaugering to reduce the potential for soil heave caused by pile installation.
Soil heave is discussed further in chapter 3. The required depth of preaugering varied depending
on the contract and pile location, but ranged from 7.6 to 32.0 m below the ground surface.
Pile Driving Criteria
The specifications required that a Wave Equation Analysis of Piles (WEAP) be used to select the
pile driving equipment. The WEAP model estimates hammer performance, driving stresses, and
driving resistance for an assumed hammer configuration, pile type, and soil profile. The
acceptability of the hammer system was based on the successful demonstration that the pile
could be driven to the required capacity or tip elevation without damage to the pile, within a
penetration resistance of 3 to 15 blows per 2.5 cm.
The pile driving resistance criteria estimated from the WEAP analysis was also used as the initial
driving criteria for the installation of the test piles. Additional WEAP analyses were required for
changes in the hammer type, pile type or size, or for significant variations in the soil profile. It
was also specified that the WEAP analyses be rerun with modifications to the input parameters
to match the results obtained from the dynamic or static load test results. Modifications to the
driving criteria could be made as appropriate, based on the results of the pile load tests.
10
11
1 foot = 0.30 m
1 inch = 25.4 mm
Figure 7. Typical pile details for a 30-cm-diameter PPC pile.
12
1 foot = 0.30 m
1 inch = 25.4 mm
Figure 8. Typical pile details for a 41-cm-diameter PPC pile with stinger.
Axial Load and Pile Load Test Criteria
The required allowable axial capacities that were identified in the special provisions are
summarized in table 3. Allowable axial load capacities ranged from 311 to 1,583 kilonewtons
(kN). Lateral load criteria were not identified in the selected contracts.
Table 3. Summary of pile types and axial capacity
(requirements identified in the selected contracts).
Required Allowable Axial
Capacity (kN)
890
1,583
311
356–756
534–1,379
Pile Type
32-cm pipe
41-cm pipe
61-cm pipe
30-cm square PPC
41-cm square PPC
The axial capacity of the piles was verified using pile load tests, which were specified in section
940.62 of the general specifications.(14) The required ultimate capacities for the load tests were
specified by applying a minimum factor of safety of 2.0 to the required allowable values. A
factor of safety of 2.25 was specified in contract C19B1, which is consistent with the
recommended American Association of State Highway and Transportation Officials (AASHTO)
criteria for piles designed and evaluated based only on a subsurface exploration, static analysis,
WEAP analysis, and dynamic pile testing.(16)
Dynamic load testing was required for test piles and for a portion of the production piles to
monitor driving-induced stresses in the piles, evaluate hammer efficiency and performance,
estimate the soil-resistance distribution, and evaluate the pile capacity during initial installation
driving and restrikes. A waiting period of 12 to 36 hours (h) was required after pile installation
before restrike tests could be performed.
Static load tests were required for test piles to confirm that the minimum specified allowable
capacity was achieved and to better estimate or establish higher allowable design capacities.
Section 1817.4.1 of the Massachusetts State building code says that the load reaching the top of
the bearing stratum under maximum test load for a single pile or pile group must not be less than
100 percent of the allowable design load for end-bearing piles. Therefore, the specifications
required that the static load test demonstrate that 100 percent of the design load was transferred
to the bearing layer. If any of the test criteria were not met, the contractor was required to
perform additional static load test(s).
13
CHAPTER 3. CONSTRUCTION EQUIPMENT AND METHODS
This chapter presents a description of the equipment and methods used during pile driving
operations at the CA/T project in the selected contracts. This includes a general overview of
impact hammers, how a pile is installed, and how to tell when a pile has reached the desired
capacity. Construction issues associated with pile driving during this project are also presented.
Pile heave was identified as an issue during construction of the arrivals tunnel at Logan Airport,
which required a significant number of piles to be redriven. At another site at the airport, soil
heave resulting from pile driving caused significant movement of an adjacent building and
required changes to the installation process, including preaugering the piles to a depth of 26 m.
EQUIPMENT AND METHODS
Impact hammers were used to drive all of the piles for the CA/T project. An impact hammer
consists of a heavy ram weight that is raised mechanically or hydraulically to some height
(termed “stroke”) and dropped onto the head of the pile. During impact, the kinetic energy of the
falling ram is transferred to the pile, causing the pile to penetrate the ground.
Many different pile driving hammers are commercially available, and the major distinction
between hammers is how the ram is raised and how it impacts the pile. The size of the hammer is
characterized by its maximum potential energy, referred to as the “rated energy.” The rated
energy can be expressed as the product of the hammer weight and the maximum stroke.
However, the actual energy transferred to the pile is much less a result of energy losses within
the driving system and pile. The average transferred energies range from 25 percent for a diesel
hammer on a concrete pile to 50 percent for an air hammer on a steel pile.(17)
Three types of hammers were used on the selected contracts: (1) a single-acting diesel, (2) a
double-acting diesel, and (3) a single-acting hydraulic. The manufacturers and characteristics of
the hammers used in these contracts are summarized in table 4, along with the pile types driven.
Schematics of the three types of hammers are shown in figures 9 through 11.
Table 4. Summary of pile driving equipment used on the selected contracts.
Make and Model
Type
Action
Rated
Energy
(kN-m)
Pile Types Driven
Delmag™
D 46-32
Diesel
Double
153.5
41-cm PPC
HPSI 2000
Hydraulic
Single
108.5
41-cm PPC
ICE 1070
Diesel
Double
98.5
HPSI 1000
Delmag D 19-42
Delmag D 30-32
Hydraulic
Diesel
Diesel
Single
Single
Single
67.8
58.0
99.9
31-cm PPC, 41-cm
PPC, 41-cm pipe
41-cm PPC
32-cm pipe
32-cm pipe
Contracts
C07D1
C07D1,
C07D2
C08A1,
C09A4
C19B1
C19B1
C19B1
Designation
I
II
III
IV
V
VI
A single-acting diesel hammer (figure 9) works by initially raising the hammer with a cable and
then releasing the ram. As the ram free-falls within the cylinder, fuel is injected into the
15
combustion chamber beneath the ram and the fuel/air mixture becomes pressurized. Once the
ram strikes the anvil at the bottom of the cylinder, the fuel/air mixture ignites, pushing the ram
back to the top of the stroke. This process will continue as long as fuel is injected into the
combustion chamber and the stroke is sufficient to ignite the fuel.
Figure 9. Single-acting diesel hammer.(17)
A double-acting diesel hammer (figure 10) works like the single-acting diesel hammer except
that the system is closed at the top of the ram. As the ram rebounds to the top of the stroke,
gasses are compressed in the bounce chamber at the top of the hammer. The bounce chamber
temporarily stores and redirects energy to the top of the ram, allowing the stroke height to be
reduced and the blow rate to be increased. Bounce chamber pressure is monitored during pile
driving because it is correlated with hammer energy. The stroke of the hammer, and thus the
energy, is controlled using the fuel pump. This is effective for avoiding bouncing of the hammer
during the upstroke, which can lead to unstable driving conditions and damage to the hammer.(17)
A single-acting hydraulic hammer (figure 11) uses a hydraulic actuator and pump to retract the
ram to the top of the stroke. Once the ram is at the top of the stroke, the ram is released and free-
16
falls under gravity, striking the anvil. An advantage of hydraulic hammers is that the free-fall
height, and thus the energy delivered to the pile, can be controlled more accurately.
Figure 10. Double-acting diesel hammer.(17)
Figure 11. Single-acting
hydraulic hammer.(17)
In preparation for driving, a pile is first hoisted to an upright position using the crane and is
placed into the leads of the pile driver. The leads are braces that help position the piles in place
and maintain alignment of the hammer-pile system so that a concentric blow is delivered to the
pile for each impact. Once the pile is positioned at the desired location, the hammer is lowered
onto the pile butt. A pile cushion consisting of wood, metal, or composite material is placed
between the pile and the hammer prior to driving to reduce stresses within the pile during
driving.
Once the pile is in position, pile driving is initiated and the number of hammer blows per 0.3 m
of penetration is recorded. Toward the end of driving, blows are recorded for every 2.5 cm of
penetration. Pile driving is terminated when a set of driving criteria is met. Pile driving criteria
are generally based on the following: (1) the minimum required embedment depth, (2) the
minimum number of blows required to achieve capacity, and (3) the maximum number of blows
to avoid damage to the pile. All information that is associated with pile driving activities (e.g.,
hammer types, pile types, pile lengths, blow counts, etc.) is recorded on a pile driving log.
17