Handbook of environmental degradation materials
Bạn đang xem bản rút gọn của tài liệu. Xem và tải ngay bản đầy đủ của tài liệu tại đây (19.86 MB, 604 trang )
Handbook of Environmental
Degradation of Materials
Edited by
Myer Kutz
Myer Kutz Associates, Inc.
Delmar, New York
Copyright © 2005 by William Andrew, Inc.
No part of this book may be reproduced or utilized in any form or by any means, electronic or
mechanical, including photocopying, recording, or by any information storage and retrieval
system, without permission in writing from the Publisher.
Cover art © 2005 by Brent Beckley / William Andrew, Inc.
ISBN: 0-8155-1500-6 (William Andrew, Inc.)
Library or Congress Catalog Card Number: 2005005496
Library of Congress Cataloging-in-Publication Data
Handbook of environmental degradation of materials / edited by Myer Kutz.
p. cm.
Includes bibliographical references and index.
ISBN 0-8155-1500-6 (0-8155)
1. Materials—Effect of environment on—Handbooks, manuals, etc. I. Kutz,
Myer.
TA418.7.H354 2005
620.1Ј122—dc22
2005005496
Printed in the United States of America
This book is printed on acid-free paper.
10 9 8 7 6 5 4 3 2 1
Published by:
William Andrew Publishing
13 Eaton Avenue
Norwich, NY 13815
1-800-932-7045
www.williamandrew.com
NOTICE
To the best of our knowledge the information in this publication is accurate; however the Publisher does not
assume any responsibility or liability for the accuracy or completeness of, or consequences arising from, such
information. This book is intended for informational purposes only. Mention of trade names or commercial
products does not constitute endorsement or recommendation for their use by the Publisher. Final determination of the suitability of any information or product for any use, and the manner of that use, is the sole responsibility of the user. Anyone intending to rely upon any recommendation of materials or procedures mentioned in this publication should be independently satisfied as to such suitability, and must meet all applicable
safety and health standards.
For my lifelong friendships, none the worse for wear
PREFACE
The idea for the Handbook of Environmental Degradation of Materials originated several years ago
when Bill Woishnis, the founder of William Andrew
Publishing, and I met at my upstate New York office
to discuss materials information needs at the practitioner level, an area that Bill and I had been involved
in for some time. Several handbooks that I had
already published or was then working on dealt entirely with materials or had substantial numbers of
chapters devoted to materials. Bill and his partner,
Chris Forbes, were embarking on a new electronic
publishing venture, Knovel Corporation, that would
deliver technical information, much of it on materials, to engineers’ desktops. We thought that a handbook that dealt with the harm that environmental factors could cause to a wide range of engineering
materials would be useful to practitioners, and that
my expertise at developing handbooks could be combined successfully with his companies’ capabilities
for delivering information in print and electronically.
The aim of this handbook is to present practical
aspects of environmental degradation of materials
(which I shall call “EDM” here): what causes EDM;
how to detect and measure it; how to control it—
what remediation strategies might be employed to
retard damage caused by EDM; and how to possibly
even prevent it. Because an engineer, no matter the
industry he or she is employed in, may have to work
with multiple materials, including metals, plastics,
composites (such as reinforced concrete), even textiles and wood, it is useful to know how many different kinds of industrial materials degrade environmentally, what the principal environmental agents of
degradation are for each class of materials, and the
degradation control and prevention strategies and
techniques that are most successful for each class of
materials. The handbook deals with a broad range of
degradation media and environmental conditions,
including water and chemicals, weather, sunlight
and other types of radiation, and extreme heat generated by explosion and fire.
The handbook has a design orientation. I want the
handbook to be useful to people with questions such
as these:
I’m designing a structure, which will have to operate
under adverse environmental conditions. What
materials should I specify?
How can I protect the surface of a product from degrading in the environment in which consumers
will use the product?
What protective measures can I apply to structural
materials if they are subjected to a potentially catastrophic attack by intense heat?
The handbook has a practical, not a theoretical,
orientation. A substantial portion includes chapters
on preventive and remedial aspects of industrial
and commercial applications where EDM can have
major and, in some cases, even catastrophic consequences. I want this handbook to serve as a source of
practical advice to the reader. I would like the handbook to be the first information resource a practicing
engineer reaches for when faced with a new problem
or opportunity—a place to turn to even before turning to other print sources, including officially sanctioned ones, or to Internet search engines. So the
handbook is more than a voluminous reference or
collection of background readings. In each chapter,
the reader should feel that he or she is in the hands
of an experienced consultant who is providing sensible engineering-design-oriented advice that can
lead to beneficial action and results.
But why develop such a handbook? The data
in a single handbook of the scope outlined above can
be indicative only, not comprehensive. After all,
this handbook cannot purport to cover any of the
subjects it addresses in anywhere near the detail that
an information resource devoted to a single subject
can. Moreover, no information resource—I mean no
handbook, no shelf of books, not even a web site
or an Internet portal or search engine (not yet, at
least!)—can offer an engineer, designer, or materials
scientist complete assurance that he or she will, by
consulting such a resource, gain from it all the
knowledge necessary to incorporate into the design
of a part, component, product, machine, assembly,
or structure measures that will prevent its constituent
materials from degrading to the point of failure or
collapse when confronted by adverse environmental
conditions, whether anticipated, such as weathering,
or unexpectedly severe, such as the heat generated
by a fire resulting from an explosion.
Nevertheless, when a practitioner is considering
how to deal with any aspect of EDM, whether in the
design, control, prevention, inspection, or remedia-
vii
viii
PREFACE
tion phase, he or she has to start somewhere. The
classic first step, which I have confirmed in surveys
and focus groups of engineering professionals, was,
in the pre-Internet era, either to ask a colleague (usually, the first choice), open a filing cabinet to look for
reports or articles that might have been clipped and
saved, scan the titles on one’s own bookshelves or,
when all else had failed, go to an engineering library,
where one would hope to find more information
sources than in one’s own office, sometimes with the
help of a good reference librarian.
To be sure, there are numerous references that
deal with separate aspects of EDM. Corrosion, for
example, is a topic that has been covered in great detail in voluminous references, from the points of
view of materials themselves, of corroding media,
and of testing and evaluation in various industries.
Professional societies—NACE, ASM International,
and ASTM—have devoted great energy to developing and disseminating information about corrosion.
The topic of environmental degradation of plastics,
to take another example, has been covered in other
reference books, albeit to a lesser extent. So there are
many print references where a practitioner can begin
the study of many individual topics within the subject of EDM.
Of course, this is the Internet era. Many, if not
most, practitioners now begin the search for EDM
information by typing words or phrases into a search
engine. Such activity, if the search has been done
properly (a big if, just ask any reference librarian)
will yield whatever the search engines have indexed,
which, of course, may or may not be information
useful to the particular situation. And a search engine will not connect practitioners and students to
the content of valuable engineering references, unless one has access to web sites where such references are offered in full text.
Moreover, engineers, designers, and materials scientists also practice in an era of innovative materials
selection and substitution that enable them to develop
new versions of products, machines, or assemblies
that are cheaper and more efficient than older versions made with more expensive, harder to form, and
heavier materials. There can be competition for the
attention of practitioners. For example, while steel
may still account for slightly more than half of the
material in an automobile, the rest is made from a
wide variety of metallic and non-metallic materials,
and the competition among suppliers of these nonferrous materials for inclusion by automobile manufacturers is, to judge by the wars of words waged by
materials trade associations, intense.
So here is the situation with regard to EDM
knowledge and information that practitioners find
themselves in: they must have access to information
that covers numerous materials, as well as numerous
degradation media and environments, but it has not
been easy to find information of such broad scope
in a single, easily accessible resource. What I have
sought to do with this handbook is to deal with the
EDM knowledge and information situation by including enough information about a broad range of
subjects that deal with multiple aspects of EDM so
that the handbook will be positioned at the hub of an
information wheel, if you will, with the rim of the
wheel divided into segments, each of which includes
the wealth of information that exists for each of the
topics within the subject of materials’ environmental
degradation. Each individual chapter in the handbook is intended to point readers to a web of information sources dealing with the subjects that the
chapter addresses. Furthermore, each chapter, where
appropriate, is intended to provide enough analytical
techniques and data so that the reader can employ a
preliminary approach to solving problems. The idea,
then, is for the handbook to be the place for practitioners, as well as advanced students, to turn to when
beginning to look for answers to questions in a way
that may enable them to select a material, substitute
one material or another, or employ a protection technique or mechanism that will save money, energy, or
time.
I have asked contributors to write, to the extent
their backgrounds and capabilities make possible, in
a style that will reflect practical discussion informed
by real-world experience. I would like readers to feel
that they are in the presence of experienced teachers
and consultants who know about the multiplicity of
technical and societal issues that impinge on any
topic within the subject of environmental degradation of materials. At the same time, the level is such
that students and recent graduates can find the handbook as accessible as experienced engineers.
I have gathered together contributors from a wide
range of locations and organizations. While most of
the contributors are from North America, there are
two from India, one from Hong Kong, two from
Russia (who collaborated on a chapter), and one
from Sweden. Personnel from the Royal Thai Navy
contributed to the chapter on oil tankers. Sixteen
chapters are by academic authors; 11 are by authors
who work in industry, are at research organizations,
or are consultants.
The handbook is divided into six parts. Part I,
which deals with an assessment of the economic cost
PREFACE
of environmental degradation of materials, has just
one chapter, a recapitulation of the work done by a
team including Mike Brongers and Gerhardus Koch,
both at CC Technologies, a corrosion consultancy in
Dublin, Ohio. Part II contains three chapters on failure analysis and measurement, by K.E. Perumal, a
consultant in Mumbai, India, Sean Brossia, who
works on corrosion at the Southwest Research Institute in Can Antonio, Texas, and Jim Harvey, a plastics consultant in Corvalis, Oregon.
Part III deals with several different types of degradation. Professors Raymond Buchanan and E.E.
Stansbury of the University of Tennessee and A.S.
Khanna of the Indian Institute of Technology in
Bombay cover metallic corrosion. Jim Harvey, in his
second chapter in the handbook, treats polymer
aging. Neal Berke, who works at WR Grace in Cambridge, Massachusetts, writes about the environmental degradation of reinforced concrete. Professor J.D.
Gu of the University of Hong Kong deals with biodegration. Part III concludes with a chapter on material flammability by Marc Janssens, also at Southwest Research Institute.
In Part IV, the handbook moves on to protective
measures, starting with a chapter on cathodic protection by Prof Richard Evitts of the University of Saskatchewan in Saskatoon, Canada. In addition to metals, Part IV deals with polymers, textiles, and wood.
Professors Gennadi Zaikov and S.M. Lomakin of the
Institute of Biochemical Physics in Moscow cover
polymeric flame retardants. Hechmi Hamouda, at
North Carolina State University in Raleigh, North
Carolina, writes about thermal protective clothing.
The contributors of the two chapters on wood and
measures that can be taken to protect it are from the
Pacific Northwest—Phil Evans and his colleagues,
Brian Matthews and Jahangir Chowdhury, are at the
University of British Columbia in Vancouver and Jeff
Morrell is at Oregon State in Corvalis.
Protection issues are also the subjects of Part V,
which is called Surface Engineering and deals with
coatings. Gary Halada and Clive Clayton, professors
at SUNY in Stony Brook, set the stage for this section of the handbook with a chapter on the intersection of design, manufacturing, and surface engineering. Professor Tom Schuman at the University of
Missouri—Rolla, continues with a discussion of protective coatings for aluminum alloys. Professor Rudy
Buchheit, at the Ohio State University in Columbus,
ix
writes about anti-corrosion paints, and Mark
Nichols, at Ford Motor Company in Dearborn,
Michigan, writes about paint weathering tests, a topic
of great interest to auto makers. Mitch Dorfman, who
works at Sulzer Metco in Westbury, Long Island,
covers thermal spray coatings. Professor “Vipu” Vipulanandan, with his colleague, J. Liu, deals with concrete surface coatings issues. Ray Taylor of the University of Virginia closes Part V with a discussion of
coatings defects.
The handbook concludes with five chapters that
cover industrial applications with, collectively, a
wide variety of materials. The chapters are meant to
illustrate in a hands-on way points made more generally elsewhere in the handbook. The first of these
chapters, on degradation of spacecraft materials,
comes from a Goddard Research Center group, including Bruce Banks, Joyce Dever, Kim de Groh,
and Sharon Miller. Branko Popov of the University
of South Caroline in Columbia wrote the next chapter, which deals with metals, and is on cathodic protection for pipelines. The next chapter is also on
metals. David Olson, a professor at the Colorado
School of Mines in Golden headed a team, including
George Wang of Mines, John Spencer of the American Bureau of Shipping, and Sittha Saidararamoot
and Brajendra Mishra of the Royal Thai Navy, that
provides practical insight into the real-world problem of tanker corrosion. Mikael Hedenqvist of Institutionen för Polymerteknologi, Kungliga Tekniska
Högskolan in Stockholm deals with polymers in his
chapter on barrier packaging materials used in consumer products. Steve Tait, an independent consultant in Madison, Wisconsin, closes the handbook
with a chapter on preventing and controlling corrosion in chemical processing equipment.
My undying thanks to all of the contributors:
I salute their professionalism and perseverance. I
know how difficult it is to fit a writing project into a
busy schedule. Chapters like those in this handbook
do not get written in an evening or in a few hours
snatched from a weekend afternoon. Thanks also to
Millicent Treloar, the acquisitions editor at William
Andrew Publishing. And, of course, many thanks to
my wife Arlene, who successfully cushions each
day, no matter how frustrating it’s been.
Myer Kutz
Delmar, New York
CONTRIBUTORS
Stephen Ayer
Forintek Canada Corporation
Vancouver, Canada
Richard W. Evitts
University of Saskatchewan
Saskatoon, Canada
Bruce Banks
NASA Glenn Research Center
Cleveland, Ohio
Kim de Groh
NASA Glenn Research Center
Cleveland, Ohio
Neal Berke
WR Grace Construction Products
Cambridge, Massachusetts
J. D. Gu
The University of Hong Kong
Hong Kong, China
Michiel Brongers
CC Technologies
Dublin, Ohio
Gary Halada
State University of New York
Stony Brook, New York
Sean Brossia
Southwest Research Institute
San Antonio, Texas
Hechmi Hamouda
North Carolina State University
Raleigh, North Carolina
Raymond A. Buchanan
University of Tennessee
Knoxville, Tennessee
James A. Harvey
Under the Bridge Consulting
Corvallis, Oregon
Rudolph G. Buchheit
The Ohio State University
Columbus, Ohio
Mikael S. Hedenqvist
Royal Institute of Technology
Stockholm, Sweden
Jahangir Chowdhury
University of British Columbia
Vancouver, BC, Canada
Marc Janssens
Southwest Research Institute
San Antonio, Texas
Clive Clayton
State University of New York
Stony Brook, New York
Yutaka Kataoka
Tsukuba Norin
Ibaraki, Japan
Joyce Dever
NASA Glenn Research Center
Cleveland, Ohio
Anand Sawroop Khanna
Indian Institute of Technology
Bombay, India
Mitchell R. Dorfman
Sulzer Metco, Inc.
Westbury, New York
Makoto Kiguchi
Tsukuba Norin
Ibaraki, Japan
Philip D. Evans
University of British Columbia
Vancouver, BC, Canada
Gerhardus Koch
CC Technologies
Dublin, Ohio
xi
xii
CONTRIBUTORS
Swaminatha P. Kumaraguru
University of South Carolina
Columbia, South Carolina
Karl Schmalzl
University of British Columbia
Vancouver, Canada
J. Liu
University of Houston
Houston, Texas
Thomas Schuman
University of Missouri—Rolla
Rolla, Missouri
S. M. Lomakin
Institute of Biochemical Physics
Moscow, Russia
John S. Spencer
American Bureau of Shipping
Houston, Texas
Brian Matthews
University of British Columbia
Vancouver, BC, Canada
E. E. Stansbury
University of Tennessee
Knoxville, Tennessee
Sharon Miller
NASA Glenn Research Center
Cleveland, Ohio
William Stephen Tait
Pair O Docs Professionals L.L.C.
Madison, Wisconsin
Brajendra Mishra
Colorado School of Mines
Golden, Colorado
S. Ray Taylor
University of Mississippi Medical Center
Jackson, Mississippi
Jeff Morrell
Oregon State University
Corvallis, Oregon
Neil Thompson
CC Technologies
Dublin, Ohio
Mark Nichols
Ford Motor Company
Dearborn, Michigan
Swieng Thuanboon
Royal Thai Navy
David L. Olson
Colorado School of Mines
Golden, Colorado
Joseph Payer
Case Western Reserve University
Cleveland, Ohio
K. E. Perumal
Corrosion and Metallurgical Consultancy Centre
Mumbai, India
Branko Popov
University of South Carolina
Columbia, South Carolina
Sittha Saidarasamoot
Royal Thai Navy
Cumaraswamy Vipulanandan
University of Houston
Houston, Texas
Paul Virmani
Turner-Fairbank Highway Research Center
McLean, Virginia
Ge Wang
American Bureau of Shipping
Houston, Texas
Gennadii E. Zaikov
Institute of Biochemical Physics
Moscow, Russia
TABLE OF CONTENTS
Preface . . . . . . . . . . . . . . . . . . . . . . . . . . . . . . . . . . . . . . . . . . . . . . . . . . . . . . . . . . . . . . . . . . . . . . . . . . . . . vii
Contributors . . . . . . . . . . . . . . . . . . . . . . . . . . . . . . . . . . . . . . . . . . . . . . . . . . . . . . . . . . . . . . . . . . . . . . . . . xi
PART 1 DEGRADATION ECONOMICS . . . . . . . . . . . . . . . . . . . . . . . . . . . . . . . . . . . . . . . . . . . . . . . . . 1
1. Cost of Corrosion in the United States . . . . . . . . . . . . . . . . . . . . . . . . . . . . . . . . . . . . . . . . . . . . 3
Gerhardus H. Koch, Michiel P. H. Brongers, Neil G. Thompson, Y. Paul Virmani, and
Joe H. Payer
PART 2 ANALYSIS . . . . . . . . . . . . . . . . . . . . . . . . . . . . . . . . . . . . . . . . . . . . . . . . . . . . . . . . . . . . . . . . . . . 25
2. Analysis of Failures of Metallic Materials Due to Environmental Factors . . . . . . . . . . . . . . . . 27
K. E. Perumal
3. Laboratory Assessment of Corrosion . . . . . . . . . . . . . . . . . . . . . . . . . . . . . . . . . . . . . . . . . . . . . 47
Sean Brossia
4. Lifetime Predictions of Plastics . . . . . . . . . . . . . . . . . . . . . . . . . . . . . . . . . . . . . . . . . . . . . . . . . 65
James A. Harvey
PART 3 TYPES OF DEGRADATION . . . . . . . . . . . . . . . . . . . . . . . . . . . . . . . . . . . . . . . . . . . . . . . . . . . 79
5. Electrochemical Corrosion . . . . . . . . . . . . . . . . . . . . . . . . . . . . . . . . . . . . . . . . . . . . . . . . . . . . 81
R. A. Buchanan and E. E. Stansbury
6. High Temperature Oxidation . . . . . . . . . . . . . . . . . . . . . . . . . . . . . . . . . . . . . . . . . . . . . . . . . . 105
A. S. Khanna
7. Chemical and Physical Aging of Plastics . . . . . . . . . . . . . . . . . . . . . . . . . . . . . . . . . . . . . . . . 153
James A. Harvey
8. Environmental Degradation of Reinforced Concrete . . . . . . . . . . . . . . . . . . . . . . . . . . . . . . . . 165
Neal Berke
9. Biofouling and Prevention: Corrosion, Biodeterioration and Biodegradation of Materials . . 179
Ji-Dong Gu
10. Material Flammability . . . . . . . . . . . . . . . . . . . . . . . . . . . . . . . . . . . . . . . . . . . . . . . . . . . . . . . 207
Marc L. Janssens
PART 4 PROTECTIVE MEASURES . . . . . . . . . . . . . . . . . . . . . . . . . . . . . . . . . . . . . . . . . . . . . . . . . . 227
11. Cathodic Protection . . . . . . . . . . . . . . . . . . . . . . . . . . . . . . . . . . . . . . . . . . . . . . . . . . . . . . . . . 229
Richard W. Evitts
12. Polymeric Flame Retardants: Problems and Decisions . . . . . . . . . . . . . . . . . . . . . . . . . . . . . . 243
G. E. Zaikov and S. M. Lomakin
13. Thermal Protective Clothing . . . . . . . . . . . . . . . . . . . . . . . . . . . . . . . . . . . . . . . . . . . . . . . . . . 261
Hechmi Hamouda
14. Weathering and Surface Protection of Wood . . . . . . . . . . . . . . . . . . . . . . . . . . . . . . . . . . . . . . 277
v
vi
CONTENTS
Philip Evans, Mohammed Jahangir Chowdhury, Brian Mathews, Karl Schmalzl,
Stephen Ayer, Makoto Kiguchi, and Yutaka Kataoka
15. Protection of Wood-Based Materials . . . . . . . . . . . . . . . . . . . . . . . . . . . . . . . . . . . . . . . . . . . . 299
Jeff Morrell
PART 5 SURFACE ENGINEERING . . . . . . . . . . . . . . . . . . . . . . . . . . . . . . . . . . . . . . . . . . . . . . . . . . . 319
16. The Intersection of Design, Manufacturing, and Surface Engineering . . . . . . . . . . . . . . . . . . 321
Gary P. Halada and Clive R. Clayton
17. Protective Coatings for Aluminum Alloys . . . . . . . . . . . . . . . . . . . . . . . . . . . . . . . . . . . . . . . . 345
Thomas P. Schuman
18. Corrosion Resistant Coatings and Paints . . . . . . . . . . . . . . . . . . . . . . . . . . . . . . . . . . . . . . . . . 367
Rudolph G. Buchheit
19. Paint Weathering Tests . . . . . . . . . . . . . . . . . . . . . . . . . . . . . . . . . . . . . . . . . . . . . . . . . . . . . . . 387
Mark E. Nichols
20. Thermal Spray Coatings . . . . . . . . . . . . . . . . . . . . . . . . . . . . . . . . . . . . . . . . . . . . . . . . . . . . . 405
Mitchell R. Dorfman
21. Coatings for Concrete Surfaces: Testing and Modeling . . . . . . . . . . . . . . . . . . . . . . . . . . . . . 423
C. Vipulanandan and J. Liu
22. The Role of Intrinsic Defects in the Protective Behavior of Organic Coatings . . . . . . . . . . . . 449
S. Ray Taylor
PART 6 INDUSTRIAL APPLICATIONS . . . . . . . . . . . . . . . . . . . . . . . . . . . . . . . . . . . . . . . . . . . . . . . . 463
23. Degradation of Spacecraft Materials . . . . . . . . . . . . . . . . . . . . . . . . . . . . . . . . . . . . . . . . . . . . 465
Joyce Dever, Bruce Banks, Kim de Groh, and Sharon Miller
24. Cathodic Protection of Pipelines . . . . . . . . . . . . . . . . . . . . . . . . . . . . . . . . . . . . . . . . . . . . . . . 503
Branko N. Popov and Swaminatha P. Kumaraguru
25. Tanker Corrosion . . . . . . . . . . . . . . . . . . . . . . . . . . . . . . . . . . . . . . . . . . . . . . . . . . . . . . . . . . . 523
Ge Wang, John S. Spencer, David L. Olson, Brajendra Mishra, Sittha Saidarasamoot,
and Swieng Thuanboon
26. Barrier Packaging Materials . . . . . . . . . . . . . . . . . . . . . . . . . . . . . . . . . . . . . . . . . . . . . . . . . . 547
Mikael S. Hedenqvist
27. Corrosion Prevention and Control of Chemical Processing Equipment . . . . . . . . . . . . . . . . . 565
William Stephen Tait
Index . . . . . . . . . . . . . . . . . . . . . . . . . . . . . . . . . . . . . . . . . . . . . . . . . . . . . . . . . . . . . . . . . . . . . . . . . . . . . . 583
P
•
A
•
R
•
T
•
1
DEGRADATION ECONOMICS
CHAPTER 1 COST OF CORROSION IN THE UNITED STATES
3
CHAPTER 1
COST OF CORROSION IN THE
UNITED STATES
Gerhardus H. Koch
Michiel P. H. Brongers
Neil G. Thompson
CC Technologies Laboratories, Inc., Dublin, Ohio
Y. Paul Virmani
Federal Highway Administration, Turner-Fairbank Highway Research Center, McLean, Virginia
Joe H. Payer
Case Western Reserve University, Cleveland, Ohio
1.1
1.2
1.3
1.4
1.1
INTRODUCTION 3
OBJECTIVES AND SCOPE
APPROACH 3
RESULTS 6
3
INTRODUCTION
The latest Cost of Corrosion Study(1) (2001) conducted by CC Technologies for the Federal Highway
Administration (FHWA) focused on infrastructure,
utilities, transportation, production and manufacturing, and government. It was determined that the total
direct cost of corrosion in the United States is approximately $276 billion per year, which is 3.1 percent of the nation’s gross domestic product (GDP).
This chapter presents the results of this recent study.
Corrosion costs result from equipment and structure replacement, loss of product, maintenance and
repair, the need for excess capacity and redundant
equipment, corrosion control, designated technical
support, design, insurance, and parts and equipment
inventories. Previous studies in the United States(2–4)
and abroad(5–8) had already shown that corrosion is
very costly and has a major impact on the economies
of industrial nations. While all these studies emphasized the financial losses due to corrosion, no systematic study was conducted to investigate preventive
strategies to reduce corrosion costs.
1.2
OBJECTIVES AND SCOPE
The primary objectives of this study were:
1. Develop an estimate of the total economic impact
of metallic corrosion in the United States.
1.5
1.6
1.7
1.8
DISCUSSION 20
PREVENTIVE STRATEGIES 21
ACKNOWLEDGMENTS 22
REFERENCES 22
2. Identify national strategies to minimize the impact of corrosion.
The work to accomplish these objectives was conducted through the following main activities:
• Determination of the cost of corrosion, based on
corrosion control methods and services.
• Determination of the cost of corrosion for specific
industry sectors.
• Extrapolation of individual sector costs to a national total corrosion cost.
• Assessment of barriers to progress and effective
implementation of optimized corrosion control
practices.
• Development of implementation strategies and
recommendations for the realization of cost savings.
1.3
APPROACH
A critical review of previous national studies was
conducted. These studies have formed the basis for
much of the current thinking regarding the cost of
corrosion to the various national economies, and
have led to a number of recent national studies.(9–11)
The earliest study was reported in 1949 by Uhlig,
who estimated the total cost to the economy by summing materials and procedures related to corrosion
3
4
DEGRADATION ECONOMICS
control. The 1949 Uhlig report, which was the first
to draw attention to the economic importance of corrosion, was followed in the 1970s by a number of
studies in various countries, such as the United
States, the United Kingdom, and Japan. The national
study by Japan, conducted in 1977, followed the
Uhlig methodology. In the United States, BattelleNBS estimated the total direct cost of corrosion
using an economic input/output framework. The
input/output method was adopted later by studies in
two other nations, namely, Australia in 1983 and
Kuwait in 1995. In the United Kingdom, a committee chaired by T. P. Hoar conducted a national study
in 1970 using a method where the total cost was estimated by collecting data through interviews and
surveys of targeted economic sectors.
Although the efforts of the above-referenced
studies ranged from formal and extensive to informal and modest, all studies arrived at estimates of
the total annual cost of corrosion that ranged from
1 to 5 percent of each country’s GNP.
In the current study, two different approaches
were taken to estimate the cost of corrosion. The
first approach followed a method where the cost is
determined by summing the costs for corrosion control methods and contract services. The costs of materials were obtained from various sources, such
as the U.S. Department of Commerce Census Bureau, existing industrial surveys, trade organizations,
industry groups, and individual companies. Data
on corrosion control services, such as engineering
services, research and testing, and education and
training, were obtained primarily from trade organizations, educational institutions, and individual experts. These services included only contract services
and not service personnel within the owner/operator
companies.
The second approach followed a method where
the cost of corrosion was first determined for specific industry sectors and then extrapolated to calculate a national total corrosion cost. Data collection
for the sector-specific analyses differed significantly
from sector to sector, depending on the availability
of data and the form in which the data were available. In order to determine the annual corrosion
costs for the reference year of 1998, data were obtained for various years in the last decade, but
mainly for the years 1996 to 1999.
The industry sectors for corrosion cost analyses
represented approximately 27 percent of the U.S.
economy gross domestic product (GDP), and were
divided among five sector categories: infrastructure,
utilities, transportation, production and manufacturing, and government.
The total cost of corrosion was estimated by determining the percentage of the GDP of those industry sectors for which direct corrosion costs were estimated and extrapolating these numbers to the total
U.S. GDP. The direct cost used in this analysis was
defined as the cost incurred by owners or operators
of the structures, manufacturers of products, and
suppliers of services.
The following elements were included in these
costs:
• Cost of additional or more expensive material
used to prevent corrosion damage.
• Cost of labor attributed to corrosion management
activities.
• Cost of the equipment required because of corrosion-related activities.
• Loss of revenue due to disruption in supply of
product.
• Cost of loss of reliability.
• Cost of lost capital due to corrosion deterioration.
For all analyzed industry sectors, the direct corrosion costs were determined. Indirect costs are incurred by individuals other than the owner or operator of the structure. Measuring and valuing indirect
costs are generally complex assessments, and several different methods can be used to evaluate potential indirect costs. Owners or operators can be
made to assume the costs through taxation, penalties, litigation, or payment for cleanup of spills. In
such cases, these expenses become direct costs. In
other cases, costs are assumed by the end user or the
overall economy. Once assigned a dollar value, the
indirect costs are included in the cost of corrosion
management of the structure and treated the same
way as direct costs.
1.3.1
Data Collection
Data collection for the sector-specific analyses differed significantly from sector to sector depending
on the availability of data and the form in which the
data were available. For many of the public sectors,
such as infrastructure and utilities, much of the information is public and could be obtained from government reports and other publicly available documents. The advice of experts in the specific sectors
was sought in order to obtain further relevant information. Discussions with industry experts provided
COST OF CORROSION IN THE UNITED STATES
the basis of the industry sector data collection. Corrosion-related cost information from the private industry sectors was more difficult to obtain directly,
because either the information was not readily available or could not be released because of company
policies. In those cases, information from publicly
available industry records on operation and maintenance costs was obtained and, with the assistance of
industry experts, corrosion-related costs could be estimated.
While a general approach for corrosion cost calculations was followed, it was recognized that each
of the individual industry sectors had its own economic characteristics, specific corrosion problems,
and methods to deal with these problems. For some
sectors, a multitude of reports was found describing
the mechanisms of corrosion in detail for that particular area. In some cases, formal cost data were not
available and a “best estimate” had to be made based
on experts’ opinions. In other cases, a convenient
multiplier was determined, and a cost per unit was
calculated. By multiplying the cost per unit by the
number of units used or made in a sector, a total cost
could be determined. It was found that by analyzing
each sector individually, a corrosion cost could be
determined using a calculation method appropriate
for that specific industry sector. After the costs were
calculated, the components of the cost determined
which Bureau of Economic Analysis (BEA) industry category would be the best match for correlating
that industry sector to a BEA subcategory.
1.3.2
Correlation Between BEA
Categories and Industry Sectors
The basic method used for extrapolating the cost
analysis performed in the current study to the entire
GDP was to correlate categories defined by the BEA
to the industry sectors that were analyzed in the current study. For clarification, BEA “categories” and
“subcategories” were used to specify BEA classifications, and “industry sectors” was used to classify
industries that were analyzed for the current study.
1.3.2.1
BEA Categories
Each BEA category represents a portion of the U.S.
GDP. In 1998, the total GDP was $8.79 trillion, divided into the major BEA categories as follows:
Services (20.90 percent), Finance, Insurance, and
Real Estate (19.22 percent), Manufacturing (16.34
percent), Retail Trade (9.06 percent), State and
Local Government (8.48 percent), Transportation
5
and Utilities (8.28 percent), Wholesale Trade (6.95
percent), Construction (4.30 percent), Federal Government (4.10 percent), Agriculture (1.45 percent),
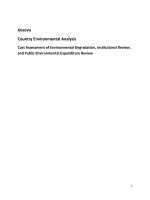
and Mining (1.20 percent). These figures are summarized in Table 1.1 and graphically shown in Figure 1.1.
1.3.2.2
Analyzed Industry Sectors
Table 1.2 shows the list of 26 industry sectors that
were analyzed in the current study, which were divided into five sector categories (not to be confused
with the BEA categories).
The basis for selecting the industry sectors was
done to represent those areas of industry for which
corrosion is known to exist. This was accomplished
by examining the Specific Technology Groups
(STGs) within NACE International (The Corrosion
Society). Table 1.3 shows the listing of current
STGs. Each STG has various Task Groups and Technology Exchange Groups. It can be expected that
these groups are formed around those industrial
areas that have the largest corrosion impact, because
the membership of NACE represents industry corrosion concerns.
A comparison of the industry sectors (Table 1.2)
with the STGs (Table 1.3) shows that the industry
sectors selected for analysis in the current study
cover most industries and technologies represented
in NACE’s STGs. One exception was noted—the
absence of an industry sector that would represent
the NACE STG of “Building Systems.” Some of the
NACE STGs do not have a direct sector related to
TABLE 1.1 Distribution of 1998 U.S. Gross Domestic
Product for BEA Industry Categories.
GDP
$ x billion percentage
Services
Finance, Insurance, and Real Estate
Manufacturing
Retail Trade
State and Local Government
Transportation and Utilities
Wholesale Trade
Construction
Federal Government
Agriculture
Mining
Statistical Discrepancy
TOTAL GDP
1,837.2
1,689.4
1,435.9
796.8
745.1
727.9
610.9
378.1
360.7
127.3
105.6
–24.8
$8,790.1
20.90
19.22
16.34
9.06
8.48
8.28
6.95
4.30
4.10
1.45
1.20
–0.28
100%
6
DEGRADATION ECONOMICS
Finance, Insurance, and Real Estate
Retail Trade
Wholesale Trade
FIGURE 1.1
Distribution of 1998 U.S. gross domestic product for BEA industry categories.
them; however, those STGs were generally covered
in the section on Corrosion Control Methods and
Services of the study.
The method used for the extrapolation of corrosion cost per industry sector to total corrosion cost
was based on the percentages of corrosion costs in
the BEA categories. If a non-covered BEA category
or subcategory was judged to have a significant corrosion impact, then an extrapolation was made for
that non-covered BEA category or subcategory by
multiplying its fraction of GDP by the percentage of
corrosion costs for subcategories that were judged to
have a similar corrosion impact. If a non-covered
sector was judged to have no significant corrosion
impact, then the direct corrosion cost for that noncovered sector was assumed to be zero.
For complete details on the correlation between
BEA categories and industry sectors, the reader is
referred to the full report by CC Technologies.(1)
1.4
RESULTS
Two different methods are used in the current study
to determine the total cost of corrosion to the United
States. Method 1 is based on the Uhlig method(4)
where the costs of corrosion control materials, meth-
ods, and services are added up. Method 2 analyzes in
detail the specific industry sectors that have a significant impact on the national economy. The percentage contribution to the nation’s GDP is estimated,
and the total cost of corrosion is then expressed as a
percentage of the GDP by extrapolation to the whole
U.S. economy. It is noted that this extrapolation is
non-linear because most of the analyzed sectors
have more corrosion impact than the non-analyzed
industrial sectors.
1.4.1
Method 1—Corrosion Control
Methods and Services
The corrosion control methods that were considered
include organic and metallic protective coatings, corrosion-resistant alloys, corrosion inhibitors, polymers, anodic and cathodic protection, and corrosion
control and monitoring equipment. Other contributors to the total cost that were reviewed include corrosion control services, corrosion research and development, and education and training.
1.4.1.1
Protective Coatings
Both organic and metallic coatings are used to provide protection against corrosion of metallic sub-
COST OF CORROSION IN THE UNITED STATES
TABLE 1.2 Summary of the Industry Sectors Analyzed in
the Current Study.
SECTOR CATEGORY
Infrastructure
Utilities
Transportation
Production and
Manufacturing
Government
26 ANALYZED INDUSTRY
SECTORS
Highway Bridges
Gas and Liquid Transmission
Pipelines
Waterways and Ports
Hazardous Materials Storage
Airports
Railroads
Gas Distribution
Drinking Water and Sewer
Systems
Electrical Utilities
Telecommunications
Motor Vehicles
Ships
Aircraft
Railroad Cars
Hazardous Materials Transport
Oil and Gas Exploration and
Production
Mining
Petroleum Refining
Chemical, Petrochemical,
Pharmaceutical
Pulp and Paper
Agricultural
Food Processing
Electronics
Home Appliances
Defense
Nuclear Waste Storage
strates. These metallic substrates, mostly carbon
steel, will corrode in the absence of the coating, resulting in the reduction of the service life of the steel
part or component. The total annual cost for organic
and metallic protective coatings is $108.6 billion.
According to the U.S. Department of Commerce
Census Bureau, the total amount of organic coating
material sold in the United States in 1997 was 5.56
billion L (1.47 billion gal), at a cost of $16.56 billion.(12) The total sales can be broken down into architectural coatings, product Original Equipment
Manufacturers (OEM) coatings, special-purpose
coatings, and miscellaneous paint products. A portion of each of these was classified as corrosion coatings at a total estimate of $6.7 billion. It is important
to note that raw material cost is only a portion of a
total coating application project, ranging from 4 to
20 percent of the total cost of application.(13–14)
7
TABLE 1.3 Summary of Specific Technology Groups in
NACE International.
NACE SPECIFIC
TECHNOLOGY
GROUP NUMBER
01
02
03
05
06
09
10
11
31
32
33
34
35
36
37
38
39
40
41
43
44
45
46
60
61
80
SPECIFIC TECHNOLOGY
GROUP NAME
Concrete and Rebar
Protective Coatings and Linings—
Atmospheric
Protective Coatings and Linings—
Immersion/Buried
Cathodic/Anodic Protection
Chemical and Mechanical Cleaning
Measurement and Monitoring Techniques
Nonmetallic Materials of Construction
Water Treatment
Oil and Gas Production—Corrosion
and Scale Inhibition
Oil and Gas Production—Metallurgy
Oil and Gas Production—Nonmetallics
and Wear Coatings (Metallic)
Petroleum Refining and Gas Processing
Pipelines, Tanks, and Well Casings
Process Industry—Chemicals
Process Industry—High Temperature
Process Industry—Pulp and Paper
Process Industry—Materials Applications
Aerospace/Military
Energy Generation
Land Transportation
Marine Corrosion and Transportation
Pollution Control, Waste Incineration,
and Process Waste
Building Systems
Corrosion Mechanisms
Corrosion and Scaling Inhibition
Intersociety Joint Coatings Activities
When applying these percentages to the raw materials cost, the total annual cost of coating application
ranges from $33.5 billion to $167.5 billion (an average of $100.5 billion).
The most widely used metallic coating for corrosion protection is galvanizing, which involves the
application of metallic zinc to carbon steel for corrosion control purposes. Hot-dip galvanizing is the
most common process, and as the name implies, it
consists of dipping the steel member into a bath of
molten zinc. Information released by the U.S. Department of Commerce in 1998 stated that about 8.6
million metric tons of hot-dip galvanized steel and
2.8 million metric tons of electrolytic galvanized
8
DEGRADATION ECONOMICS
steel were produced in 1997. The total market for
metallizing and galvanizing in the United States is
estimated at $1.4 billion. This figure is the total material costs of the metal coating and the cost of processing, and does not include the cost of the carbon
steel member being galvanized/metallized.
1.4.1.2
Corrosion-Resistant Metals
and Alloys
Corrosion-resistant alloys (CRAs) are used where
corrosive conditions prohibit the use of carbon steels
and protective coatings provide insufficient protection or are economically not feasible. CRAs include
stainless steels, nickel-base alloys, and titanium
alloys.
According to U.S. Census Bureau statistics, a
total of 2.5 million metric tons of raw stainless steel
was sold in the United States in 1997.(15) With an estimated cost of $2.20 per kg ($1 per lb) for raw stainless steel, a total annual production cost of $5.5 billion (1997) was estimated. It is assumed that all
production is for U.S. domestic consumption. The
total consumption of stainless steel also includes imports, which account for more than 25 percent of the
U.S. market. The total consumption of stainless steel
can therefore be estimated at $7.3 billion.
Where environments become particularly severe,
nickel-base alloys and titanium alloys are used.
Nickel-base alloys are used extensively in the oil
production and refinery and chemical process industries, and other industries where high temperature
and/or corrosive conditions exist. The annual average price of nickel has steadily increased from less
than $2.20 per kg in the 1960s to about $4.40 per kg
in 1998.(16) Chromium and molybdenum are also
common alloying elements for both corrosion-resistant nickel-base alloys and stainless steels. The price
of chromium has increased steadily from $2 per kg
in the 1960s to nearly $8 per kg in 1998, while the
price of molybdenum has remained relatively constant at $5 per kg.(17) With the average price for
nickel-base alloys (greater than 24 percent nickel) at
$13 per kg in 1998, the total sales value in the United
States was estimated at $285 million.
The primary use of titanium alloys is in the aerospace and military industries where the high
strength-to-weight ratio and the resistance to high
temperatures are properties of interest. Titanium and
its alloys are, however, also corrosion resistant to
many environments, and have therefore found application in oil production and refinery, chemical
processes, and pulp and paper industries. In 1998, it
was estimated that 65 percent of the titanium alloy
mill products were used for aerospace applications
and 35 percent for non-aerospace applications.(18) In
1998, the domestic consumption of titanium sponge
(the most common titanium form) was 39,100 metric tons, which, at a price of approximately $10 per
kg, sets the total price at $391 million. In addition,
28,600 metric tons of scrap were used for domestic
consumption at a price of approximately $1 per kg,
setting the total price at $420 million. As mentioned
previously, only 35 percent of mill products were for
non-aerospace applications, which leads to a titanium consumption price estimate of $150 million
for titanium and titanium alloys with corrosion control applications.
The total consumption cost of the corrosion-resistant stainless steels, nickel-base alloys, and titanium
alloys in 1998 is estimated at $7.7 billion ($7.3 billion + $0.285 billion + $0.150 billion).
1.4.1.3
Corrosion Inhibitors
A “corrosion inhibitor” may be defined, in general
terms, as a substance that when added in a small
concentration to an environment effectively reduces
the corrosion rate of a metal exposed to that environment. Inhibition is used internally with carbon
steel pipes and vessels as an economic corrosion
control alternative to stainless steels and alloys,
coatings, or non-metallic composites. A particular
advantage of corrosion inhibition is that it can be
implemented or changed in situ without disrupting a
process. The major industries using corrosion inhibitors are the oil and gas exploration and production industry, the petroleum refining industry, the
chemical industry, heavy industrial manufacturing
industry, water treatment facilities, and the product
additive industries. The largest consumption of corrosion inhibitors is in the oil industry, particularly in
the petroleum refining industry.(19) The use of corrosion inhibitors has increased significantly since the
early 1980s. The total consumption of corrosion inhibitors in the United States has doubled from approximately $600 million in 1982 to nearly $1.1 billion in 1998.
1.4.1.4
Engineering Plastics and Polymers
In 1996, the plastics industry accounted for $274.5
billion in shipments.(20) It is difficult to estimate the
fraction of plastics used for corrosion control, because in many cases, plastics and composites are
used for a combination of reasons, including corro-
COST OF CORROSION IN THE UNITED STATES
sion control, light weight, economics, strength-toweight ratio, and other unique properties. Certain
polymers are used mostly, if not exclusively, for corrosion control purposes. The significant markets for
corrosion control by polymers include composites
(primarily glass-reinforced thermosetting resins),
PVC pipe, polyethylene pipe, and fluoropolymers.
The fraction of polymers used for corrosion control
in 1997 is estimated at $1.8 billion.
1.4.1.5
Cathodic and Anodic Protection
The cost of cathodic and anodic protection of metallic buried structures or structures immersed in seawater that are subject to corrosion can be divided
into the cost of materials and the cost of installation,
operation, and maintenance. Industry data have provided estimates for the 1998 sales of various hardware components, including rectifiers, impressed
current cathodic protection (CP) anodes, sacrificial
anodes, cables, and other accessories, totaling
$146 million. The largest share of the CP market is
taken up by sacrificial anodes at $60 million, of
which magnesium has the greatest market share.
Major markets for sacrificial anodes are underground pipelines, the water heater market, and the
underground storage tank market. The costs of installation of the various CP components for underground structures vary significantly depending on
the location and the specific details of the construction. For 1998, the average total cost for installing
CP systems was estimated at $0.98 billion (range:
$0.73 billion to $1.22 billion), including the cost of
hardware components. The total cost for replacing
sacrificial anodes in water heaters and the cost for
corrosion-related replacement of water heaters was
$1.24 billion per year; therefore, the total estimated
cost for cathodic and anodic protection is $2.22 billion per year.
1.4.1.6
Corrosion Control Services
In the context of the 1998 Cost of Corrosion study,
services were defined as companies, organizations,
and individuals that are providing their services to
control corrosion. By taking the NACE International
membership as a basis for this section, a total number of engineers and scientists that provide corrosion
control services was estimated. In 1998, the number
of NACE members was 16,000, 25 percent of whom
are providing consulting and engineering services as
outside consultants or contractors. Assuming that
the average revenue of each is $300,000 (including
9
salary, overhead, benefits, and the cost to direct one
or more non-NACE members in performing corrosion control activities), the total services cost can
be calculated as $1.2 billion. This number, however,
is conservative since many professionals who follow
a career in corrosion are not members of NACE
International.
1.4.1.7
Research and Development
Over the past few decades, less funding has been
made available for corrosion-related research and
development, which is significant in light of the cost
and inconvenience of dealing with leaking and exploding underground pipelines, bursting water
mains, corroding storage tanks, aging aircraft, and
deteriorating highway bridges. In fact, several government and corporate research laboratories have
significantly reduced their corrosion research staff
or even have closed down their research facilities.
Corrosion research can be divided into academic
and corporate research. NACE International has
listed 114 professors under the Corrosion heading.
Assuming an average annual corrosion research
budget of $150,000, the total academic research
budget is estimated at approximately $20 million.
No estimates were made for the cost of corporate or
industry corrosion-related research, which is likely
to be much greater than the annual academic budget.
1.4.1.8
Education and Training
Corrosion-related education and training in the
United States includes degree programs, certification programs, company in-house training, and general education and training. A few national universities offer courses in corrosion and corrosion control
as part of their engineering curricula. Professional
organizations such as NACE International (The Corrosion Society)(21) and SSPC (The Society for Protective Coatings)(22) offer courses and certification
programs that range from basic corrosion to coating
inspector to cathodic protection specialist. NACE
International offers the broadest range of courses
and manages an extensive certification program. In
1998, NACE held 172 courses with more than 3,000
students, conducted multiple seminars, and offered
publications, at a total cost of $8 million.
1.4.1.9
Summary
A total annual direct cost of corrosion was estimated
by adding the individual cost estimates of corrosion
10
DEGRADATION ECONOMICS
TABLE 1.4 Summary of Annual Costs of Corrosion Control
Methods and Services.
MATERIAL AND
SERVICES
Protective Coatings
Organic Coatings
Metallic Coatings
Metals and Alloys
Corrosion Inhibitors
Polymers
Anodic and Cathodic
Protection
Services
Research and Development
Education and Training
TOTAL
RANGE
AVERAGE COST
($ x billion)
($ x billion) (%)
40.2–174.2
1.4
7.7
1.1
1.8
0.73–1.22
107.2
1.4
7.7
1.1
1.8
0.98
88.3
1.2
6.3
0.9
1.5
0.8
1.2
0.020
1.2
0.02
1.0
<0.1
0.01
$54.16–$188.65
0.01
$121.41
<0.1
100%
control materials, methods, services, and education
and training (see Table 1.4). The total cost was estimated at $121 billion, or 1.381 percent of the $8.79
trillion GDP in 1998. In some categories, such as organic coatings and cathodic protection, a wide range
of costs was reported based on installation costs.
FIGURE 1.2
When taking these ranges into account, the total cost
sum ranges from $54.2 billion to $188.7 billion. The
table shows that the highest cost is for organic coatings at $107.2 billion, which is approximately 88 percent of the total cost. Notably, the categories of Research and Development and Education and Training
indicate unfavorably low numbers.
1.4.2
Method 2—Industry Sector Analysis
For the purpose of the 1998 Cost of Corrosion study,
the U.S. economy was divided into five sector categories and 26 industrial sectors, selected according
to the unique corrosion problems experienced within
each of the groups. In this study, the sector categories were: (1) infrastructure, (2) utilities, (3) transportation, (4) production and manufacturing, and (5)
government. The sum of the direct corrosion costs of
the analyzed industrial sectors was estimated at
$137.9 billion. Since these sectors only represent a
fraction of the total economy, this cost does not represent the total cost of corrosion to the U.S. economy, and therefore was extrapolated to calculate the
total cost. Figure 1.2 shows the percentage contribution to the total cost of corrosion for the five sector
categories analyzed in the current study.
Percentage contribution to the total cost of corrosion for the five sector categories.
COST OF CORROSION IN THE UNITED STATES
FIGURE 1.3
1.4.2.1
11
Annual cost of corrosion in the Infrastructure category.
Infrastructure
Figure 1.3 shows the annual cost of corrosion in the
Infrastructure category to be $22.6 billion, which is
16.4 percent of the total cost of the sector categories
examined in the study. The U.S. infrastructure and
transportation system allows for a high level of mobility and freight activity for the nearly 270 million
residents and 7 million business establishments.(23)
In 1997, more than 230 million motor vehicles, transit vehicles, ships, airplanes, and railroad cars using
more than 6.4 million km (4 million mi) of highways, railroads, and waterways connecting all parts
of the United States were used. The transportation
infrastructure also includes more than 800,000 km
(approximately 500,000 mi) of oil and gas transmission pipelines, and 18,000 public and private airports.
Highway Bridges. There are 583,000 bridges in
the United States (1998). Of this total, 200,000
bridges are steel, 235,000 are conventional reinforced concrete, 108,000 are constructed using prestressed concrete, and the balance is made using
other materials of construction. Approximately 15
percent of the bridges are structurally deficient, primarily due to corrosion of steel and steel reinforcement. The annual direct cost of corrosion for highway bridges is estimated at $8.3 billion, consisting
of $3.8 billion to replace structurally deficient
bridges over the next 10 years, $2.0 billion for maintenance and cost of capital for concrete bridge
decks, $2.0 billion for maintenance and cost of capital for concrete substructures (minus decks), and
$0.5 billion for maintenance painting of steel
bridges. Life-cycle analysis estimates indirect costs
to the user due to traffic delays and lost productivity
at more than 10 times the direct cost of corrosion
maintenance, repair, and rehabilitation.
Gas and Liquid Transmission Pipelines. There
are more than 528,000 km (328,000 mi) of natural
gas transmission and gathering pipelines, 119,000
km (74,000 mi) of crude oil transmission and gathering pipelines, and 132,000 km (82,000 mi) of
hazardous liquid transmission pipelines.(24) (25) For
all natural gas pipeline companies, the total investment in 1998 was $63.1 billion, from which a total
12
DEGRADATION ECONOMICS
revenue of $13.6 billion was generated. For liquid
pipeline companies, the investment was $30.2 billion, from which a revenue of $6.9 billion was
generated. At an estimated replacement cost of
$643,800 per km ($1,117,000 per mi), the asset replacement value of the transmission pipeline system
in the United States is $541 billion; therefore, a significant investment is at risk, with corrosion being
the primary factor in controlling the life of the asset.
The average annual corrosion-related cost is estimated at $7.0 billion, which can be divided into the
cost of capital (38 percent), operation and maintenance (52 percent), and failures (10 percent).
Waterways and Ports. In the United States,
40,000 km (25,000 mi) of commercial navigable waterways serve 41 states, including all states east of
the Mississippi River. Hundreds of locks facilitate
travel along these waterways. In January 1999, 135
of the 276 locks had exceeded their 50-year design
life. U.S. ports play an important role in connecting
waterways, railroads, and highways. The nation’s
ports include 1,914 deepwater ports (seacoast and
Great Lakes) and 1,812 ports along inland waterways. Corrosion is typically found on piers and
docks, bulkheads and retaining walls, mooring
structures, and navigational aids. There is no formal
tracking of corrosion costs for these structures.
Based on figures obtained from the U.S. Army Corps
of Engineers and the U.S. Coast Guard, an annual
corrosion cost of $0.3 billion could be estimated. It
should be noted that this is a low estimate since the
corrosion costs of harbor and other marine structures
are not included.
Hazardous Materials Storage. The United States
has approximately 8.5 million regulated and nonregulated aboveground storage tanks (ASTs) and underground storage tanks (USTs) for hazardous materials (HAZMAT). While these tanks represent a
significant investment and good maintenance practices would be in the best interest of the owners, federal and state environmental regulators are concerned with the environmental impact of spills from
leaking tanks. In 1988, the U.S. Environmental Protection Agency set a December 1998 deadline for
UST owners to comply with requirements for corrosion control on all tanks, as well as overfill and spill
protection. In case of non-compliance, tank owners
face considerable costs related to cleanup and penalties. As a result, the number of USTs has decreased
from approximately 1.3 million to 0.75 million in
that 10-year period.(26) The total annual direct cost of
corrosion for HAZMAT storage is $7.0 billion, broken down into $4.5 billion for ASTs and $2.5 billion
for USTs.
Airports. According to Bureau of Transportation
statistics data, there were 5,324 public-use airports
and 13,774 private-use airports in the United States
in 1999. A typical airport infrastructure is complex,
and components that might be subject to corrosion
include the natural gas distribution system, jet fuel
storage and distribution system, de-icing storage and
distribution system, vehicle fueling system, natural
gas feeders, dry fire lines, parking garages, and runway lighting. Generally, each of these systems is
owned or operated by different organizations or
companies; therefore, the impact of corrosion on an
airport as a whole is not known or documented.
Railroads. In 1997, there were nine Class I freight
railroads accounting for 71 percent of the industry’s
274,399 km (170,508 mi) track operated. In addition, there were 35 regional railroads and 513 local
railroads. The elements that are subject to corrosion
include metal members, such as rail and steel spikes;
however, corrosion damage to railroad components
is either limited or goes unreported. Hence, an accurate estimate of the corrosion cost could not be
determined.
1.4.2.2
Utilities
Figure 1.4 shows the annual cost of corrosion in the
Utilities category to be $47.9 billion. Utilities form
an essential part of the U.S. economy by supplying
end users with gas, water, electricity, and telecommunications. All utility companies combined spent
$42.3 billion on capital goods in 1998, an increase of
9.3 percent from 1997.(27) Of this total, $22.4 billion
was used for structures and $19.9 billion was used
for equipment.
Gas Distribution. The natural gas distribution
system includes 2,785,000 km (1,730,000 mi) of relatively small-diameter, low-pressure piping, which
is divided into 1,739,000 km (1,080,000 mi) of distribution main and 1,046,000 km (650,000 mi) of
services.(28,29) There are approximately 55 million
services in the distribution system. A large percentage of the mains (57 percent) and services (46 percent) are made of steel, cast iron, or copper, which
are subject to corrosion. The total annual direct cost
COST OF CORROSION IN THE UNITED STATES
13
of replacing aging infrastructure and the cost of unaccounted-for water through leaks, corrosion inhibitors, internal mortar linings, external coatings
and cathodic protection.
Electrical Utilities. The electrical utilities industry is a major provider of energy in the United States.
The total amount of electricity sold in the United
States in 1998 was 3.24 trillion GWh at a cost to
consumers of $218 billion.(35) Electricity generation
plants can be divided into seven generic types: fossil
fuel, nuclear, hydroelectric, cogeneration, geothermal, solar, and wind. The majority of electric power
in the United States is generated by fossil fuel and
nuclear supply systems.(36) The total annual direct
cost of corrosion in the electrical utilities industry in
1998 is estimated at $6.9 billion, with the largest
amounts for nuclear power at $4.2 billion and fossil
fuel at $1.9 billion, and smaller amounts for hydraulic and other power at $0.15 billion, and transmission and distribution at $0.6 billion.
FIGURE 1.4
category.
Annual cost of corrosion in the Utilities
of corrosion was estimated at approximately $5.0
billion.
Drinking Water and Sewer Systems. According
to the American Water Works Association (AWWA)
industry database, there is approximately 1.483 million km (876,000 mi) of municipal water piping in
the United States.(30) This number is not exact, since
most water utilities do not have complete records of
their piping system. The sewer system is similar in
size to the drinking water system with approximately 16,400 publicly owned treatment facilities
releasing some 155 million m3 (41 billion gal) of
wastewater per day during 1995.(31)
In March 2000, the Water Infrastructure Network
(WIN)(32) estimated the current annual cost for new
investments, maintenance, operation, and financing
of the national drinking water system at $38.5 billion
per year, and of the sewer system at $27.5 billion per
year. The WIN report was presented in response to a
1998 study(33) by AWWA and a 1997 study(34) by the
U.S. Environmental Protection Agency (EPA). Those
studies had already identified the need for major investments to maintain the aging water infrastructure.
The total annual direct cost of corrosion for the
nation’s drinking water and sewer systems was estimated at $36.0 billion. This cost consists of the cost
Telecommunications. According to the U.S. Census Bureau, the total value of shipments for communications equipment in 1999 was $84 billion.
Important corrosion cost factors are painting and
galvanizing of communication towers and shelters,
and underground corrosion of buried copper grounding beds and galvanic corrosion of the grounded
steel structures. No corrosion cost was determined
because of the lack of information on this rapidly
changing industry.
1.4.2.3
Transportation
Figure 1.5 shows the annual cost of corrosion in the
Transportation category at $29.7 billion. The Transportation category includes vehicles and equipment
used to transport people and products (i.e., automobiles, ships, aircraft).
Motor Vehicles. U.S. consumers, businesses, and
government organizations own more than 200 million registered motor vehicles. Assuming the average value of an automobile is $5,000, the total investment Americans have made in motor vehicles
can be estimated at $1 trillion. Since the 1980s, car
manufacturers have increased the corrosion resistance of vehicles by using corrosion-resistant materials, employing better manufacturing processes,
and designing corrosion-resistant vehicles. Although significant progress has been made, further
improvement can be achieved in corrosion resis-
14
DEGRADATION ECONOMICS
FIGURE 1.5
Annual cost of corrosion in the Transportation category.
tance of individual components. The total annual direct cost of corrosion is estimated at $23.4 billion,
which is broken down into the following three components: (1) increased manufacturing costs due to
corrosion engineering and the use of corrosionresistant materials ($2.56 billion per year); (2) repairs and maintenance necessitated by corrosion
($6.45 billion per year); and (3) corrosion-related
depreciation of vehicles ($14.46 billion per year).
Ships. The U.S. flag fleet consists of the Great
Lakes with 737 vessels at 100 billion ton-km (62 billion ton-mi), inland with 33,668 vessels at 473 billion ton-km (294 billion ton-mi), ocean with 7,014
vessels at 563 billion ton-km (350 billion ton-mi),
recreational with 12.3 million boats, and cruise ships
with 122 boats serving North American ports (5.4
million passengers). The total annual direct cost of
corrosion to the U.S. shipping industry is estimated
at $2.7 billion. This cost is broken down into costs
associated with new ship construction ($1.1 billion),
maintenance and repairs ($0.8 billion), and corrosion-related downtime ($0.8 billion).
Aircraft. In 1998, the combined commercial aircraft fleet operated by U.S. airlines was more than
7,000 airplanes.(37) At the start of the jet age (1950s
to 1960s), little or no attention was paid to corrosion
and corrosion control. One of the concerns is the
continued aging of the airplanes beyond the 20-year
design life. Only the most recent designs (e.g., Boeing 777 and late-version 737) have incorporated significant improvements in corrosion prevention and
control in design and manufacturing. The total annual direct cost of corrosion to the U.S. aircraft industry is estimated at $2.2 billion, which includes
the cost of design and manufacturing ($0.2 billion),
corrosion maintenance ($1.7 billion), and downtime
($0.3 billion).
Railroad Cars. In 1998, 1.3 million freight cars
and 1,962 passenger cars were operated in the
United States. Covered hoppers (28 percent) and
tanker cars (18 percent) make up the largest segment
of the freight car fleet. The type of commodities
transported range from coal (largest volume) to
chemicals, motor vehicles, farm products, food