IV524 technical analysis options strategies
Bạn đang xem bản rút gọn của tài liệu. Xem và tải ngay bản đầy đủ của tài liệu tại đây (26.25 MB, 238 trang )
TECHNICAL
ANALYSIS
OPTIONS
STRATEGI E
<50)
PROBUS PUBLISHING COMPANY
CHAPTER
1
TECHNICAL OVERVIEW
Technical analysis involves research into the demand and supply for
securities and commodities based on price studies. Technical analysts use
charts or computer programs to identify and project both short and longterm price trends. Unlike fundamental analysis, technical analysis is not
concerned with the financial position of a company or supply/demand
statistics for a commodity.
Some forms of technical analysis, classical bar charting in particular,
provide well-defined risk/ reward parameters and measuring objectives. As
the technician observes the evolution of a pattern, specific options strategies
may be far more suitable for establishing a position than a trade of outright
long or short. This is especially true in the futures markets with the propensity to gap open beyond reasonably placed protective stop-loss orders.
Because of the problems of interpretation of price, volume and open
interest on an options chart, all of the technical analysis in this book will be
performed on the chart of the underlying instrument.
PRICE PATTERNS
Because of the time decay inherent with options, charts of their price activity
do not contain reliable price patterns for the classical bar chartist. The chart
of an option that is out-of-the-money going into expiration will have a price
"tail" that approaches its intrinsically worthless value of zero. At the other
extreme, the deeper an option is in-the-money, the greater its price movements reflect that of the underlying instrument.
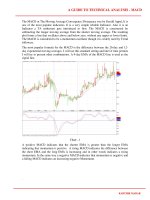
Figure 1-1 shows the bar charts of a June 70 strike price call option and
its underlying instrument, a U.S. Treasury bond futures contract. A Double
2
Chapter 1
equivalent selloff in the June 70 call option was far more severe. The low of
the selloff in the price of the call came much closer to its price low of
mid-March than the simple reaction that occurred on the T-bond chart. This
gave the option chart the look of a Head & Shoulders Bottom (see Chapter
Four). Although classic bottoming patterns formed on both charts, they were
different formations. Since the underlying instrument is the driving force
behind any option's price, technical work should be concentrated on it.
Classical bar chart price pattern recognition is aimed at locating dynamic
situations where market movement is expected and measuring objectives
can be calculated. Thus, most of the technical analysis effort in this book
attempts to identify trending or trend reversing situations as opposed to
sideways or flat markets.
The strongest and most reliable price pattern is the Head & Shoulders
Reversal. The theoretical underpinnings of this formation will be examined
in Chapter Four. This will set the stage for the actual case studies that follow
in Chapters Five, Six and Seven.
The premiere continuation pattern is the Symmetrical Triangle. The
theory behind this formation is developed in Chapter Eight. Options
strategies to trade a Triangle are studied in Chapters Nine and Ten.
Sometimes a market is simply trending—with a known direction, but
without a specific price target. Trendline analysis in conjunction with
various options strategies is explored in Chapters Eleven and Twelve.
A market undergoing a correction before continuing in the direction of
the major price trend is examined in Chapter Sixteen. This is where a
technician who is comfortable with an Elliott Wave count on a chart can earn
premium income in a net sideways market environment.
("
VOLUME
Technicians typically use volume (turnover) to measure the urgency associated with a price move. In an equity market, volume on an individual
stock (not its option) is relatively stable. Analysis is straightforward. In a
futures market, volume on an individual futures contract (not its option)
experiences an increase as it becomes the lead contract and then declines
going into expiration. This effect is damped out by using total futures
volume (all contracts).
In an options market, volume is simply the number of options contracts
traded each trading session. The analysis problem with volume of an
individual option is that an option does not necessarily exhibit a normal
volume escalation and then a severe decline as expiration approaches. Many
options expire out-of-the-monev and nr> o«^«"---~ - • •
Technical Overview
Figure 1-1
Different Price Patterns
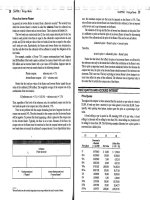
Figure 1-2 illustrates total options volume and the total volume on its
underlying instrument (soybean futures). Although a high correlation in the
two volume plots is observable, volume analysis in this book will be performed on the underlying instrument only.
OPEN INTEREST
i
Open interest (OI) in either an options market or futures market is the
summation of all unclosed purchases or sales at the end of a trading session.
The long open interest is always equal to the short open interest. The
published open interest figure represents one side of the trade only.
Open interest yields a good insight (in conjunction with volume) as to
the liquidity in a particular options series. The question is: Can open interest
changes in options be used by technicians in the same analytical fashion as
on a futures chart? The answer is no.
Open interest in a specific option, such as the XYZ June 100 call, is
influenced to an inordinate extent by the price of the underlying XYZ
instrument. Even adding the open interest of the XYZ June 100 put or
summing the open positions of all XYZ June puts and calls will not produce
a plot that can be easily analyzed.
The configuration of total open interest on an options chart is most
analogous to the configuration of open interest on a cash-settled futures
chart. There is a technique for removing the trend component of open
interest increase in a cash-settled futures contract. This must be done on the
S&P 500 futures and the popular (worldwide) Eurodollar Time Deposit
futures. But even using this technique on options does not produce satisfactory results.*
Figure 1-2 shows the total open interest plot of all the options trading on
soybean futures and the total futures open interest. A technician readily
notes the difference between the two plots. Futures open interest exhibits a
fairly stable nature. In contrast is the regular escalation and precipitous drop
in the options open interest.
PUT/CALL RATIO
The investing public trader favors buying options rather than writing options, for obvious risk reasons. The U.S. stock market is also the public
trader's favorite market. The put/call ratio in equity options is used in a
contrary sense. If put volume is too high in relation to call volume, the public
*An in-depth analysis of futures markets statistics is found in Volume and Open Interest: Cutting
Edge Strategies in the Futures Markets, Probus 1991.
Figure 1-2
Volume and Open Interest
Option and Underlying Instrument
SOYBEAN OPTIONS
Total Volume/Open Interest
SOYBEAN FUTURES
Total Volume/Open Interest
Thousands
of Bushels
-, 800.000
Chapter 1
is deemed to be very bearish. Using the theory that the masses will always
be wrong, a bullish reading results.
This tool does merit consideration in the equity options market, but it is
not of great use in options on futures. Hedging concerns of commercial users
often dominate the usage of puts or calls. In addition, there is the problem
of whether to use the number of puts to calls or the dollar value of puts to calls.
Consequently, traditional analysis of the volume on the underlying instrument will be the norm in all of the case studies.
WHEN TO ENTER A TRADE
The age-old question any trader faces is when to enter a new position. The
three most obvious choices for a classical bar chartist are:
1. In anticipation of a breakout
2. On the breakout (a close outside the formation)
3. On a price pullback toward the breakout
Suggested answers would incorporate the following:
1. Discipline is a key for any trading strategy. Technicians often see a
potential pattern developing and want to lead off—establishing an
outright long or short position prior to the breakout. This is a
dangerous practice. An options trade can often be designed with a
limited risk parameter, anticipating the breakout. The position must
be easily liquidated if it is incorrect (a breakout does not occur) or if
volume (and open interest if underlying instrument is a futures
contract) does not validate the breakout.
C
2. The options position should be easily converted to a more aggressive
directional position on the breakout. Some option strategies, by
definition, become more aggressive as the anticipated price move
occurs.
3. If a pullback to the breakout/pattern occurs, the trader should be
able to adjust the options position to an even greater aggressive
directional stance. The resulting strategy must have an identifiable
risk parameter. The specific stop-out point would normally l-e
derived from trendlines or support/resistance analysis on the chart
of the underlying instrument.
A f t e r the traditional technical analysis has boon accomplished, an options strategy can be selected to take advantage of the anticipated price
move. The position can be fine-tuned it the trader is> familiar with important
Technical Overview
options characteristics such as volatility and delta and understands how
they would change under both favorable and unfavorable price moves.
For a technical trader, however, determining the direction and expected
magnitude of the price move is paramount. Many of the nuances of options
theory are quickly overpowered if the price moves quickly toward the
expected measuring objective.
C
CHAPTER
The strategy matrix on the next several pages summarizes the content of this
book. The column labeled Technical Situation is the key. The first two
columns are standard options positions and the price environment in which
they should be used. Once a specific technical aspect on a chart has been
identified, the matrix is used to help select and implement an options
strategy. The case studies then monitor the subsequent price activity and
technical developments. Any required adjustments (follow-up activity) to
the initial options position are made and the eventual outcome noted.
After the reader has examined the individual case studies, the strategy
matrix should serve as a useful starting place or guide when a current trade
is being contemplated.
The divisional headings within the matrix subdivide it into five major
technical categories. For the reasons detailed in Chapter One, the directional
positions encompass the majority of the strategies.
The case studies beginning in Chapter Five illustrate one or more specific
technical situations. These case study chapters each begin with the relevant
row in the options strategy matrix:
Option Strategy
When to Use
Technical Situation
10
Chapter 2
Technical Analysis and Options Strategy Matrix
Directional Positions
Option Strategy
When to Use
Technical Situation
Long Call
When most bullish
En route to price pattern
measuring objective after
pullback has occurred
Synthetic Long Call
When most bullish
A gap open is likely to
exceed a normal futures
sell-stop order (report due)
Short Call
Firmly believe market is not
going up
Within Descending Right
Triangle or after Double Top
has been activated and
volatility has increased
dramatically
Long Put
When most bearish
En route to price pattern
measuring objective after
pullback has occurred
Synthetic Long Put
When most bearish
A gap open is likely to
exceed a normal futures
buy-stop order (report due)
Short Put
Firmly believe market is not
going down
Within Ascending Right Triangle or in situation where
implied volatility is too high
to justify long call position
Vertical Bull Call
Spread
Market expected to go up
somewhat
Lead off in anticipation of
upside breakout (prior to
breaking neckline of a
possible H&S Bottom)
Vertical Bear Put
Spread
Market expected to fall
somewhat
Lead off in anticipation of
downside breakout (prior to
breaking neckline of a
possible H&S Top)
Call Ratio Back
Spread
Greater probability market
will move to upside
Within Symmetrical Triangle in a bull market
Put Ratio Back
Spread
Greater probability market
will move to downside
Within Symmetrical Triangle in a bear market
Options Strategy Matrix
11
Estimating Expiration Price of Underlying Instrument
Option Strategy
When to Use
Technical Situation
Long Butterfly
Conservative trade using longterm options series
When measuring objective
can be obtained from a weekly
chart
Calendar Spread (Long
Time Spread)
Sideways market near termthen resuming major trend
In Elliott Wave II or IV. Major
trend up: calls. Major trend
down: puts (closest OTM
series used)
Large move in either direction when close to expiration
Short Butterfly
Immediate move expected
1. Converging trendlines
2. Within Symmetrical
Triangle
Vertical Credit Spread
Directional Bias
close to expiration
Minor trend change
indicator
Large move in either direction when farther from expiration
Long Straddle
Immediate move expected
1. Within Symmetrical
Triangle
2. Testing a trendline
3. Cluster of closes
4. Open interest increasing
dramatically
Flat Market
Short Straddle
Expect stagnating price
activity
Short Strangle
Market going sideways and
stagnating
Neutral Calendar Spread
Expect stagnating price
activity
1. Volume and open
interest declining
2. Triangle forming on
weekly chart
3. In Elliott Wave II or IV
4. In-between support and
resistance
Note: Often the initial options strategy will be altered as subsequent price activity is entered on the chart. This
may involve removing one-half of the losing leg of a spread at the breakout and the remaining one-half on a
pullback. Thus, a minimum of two contracts per leg is a desirable starling strategy.
CHAPTER
VERTICAL SPREADS
A vertical spread in options is probably the most classic strategy of taking a
view on expected market movement. Vertical spreads are extremely useful
to technical traders. They can be used to lead off in anticipation of a price
move. This is especially true for a classical bar chartist who is expecting a
traditional price pattern to be set off. This chapter will examine this versatile
options strategy from a theoretical standpoint and introduce risk/reward
diagrams.
A vertical spread consists of either call or put options with the same
expiration date but different strike prices. The vertical spread derived its
name because options having the same expiration date are listed in the U.S.
financial newspapers in the same vertical column. Strike prices dictate the
horizontal rows.
BULL SPREAD
A vertical bull spread is constructed by buying (long) an option with a lower
strike and selling (short) a higher strike option of the same type and
expiration. The bull spread can utilize either calls for both legs of the spread
or puts for both legs of the spread. This type of spread should be profitable
in a market in which the underlying instrument is trending higher in price.
The decision as to which strikes to select will be based on the measuring
objective obtained from the technical analysis. Liquidity considerations will
also be important because follow-up action is anticipated as the expected
price move develops. This dynamic aspect of restructuring the initial options
strategy will be covered in great detail in the various case studies.
13
14
Chapter 3
Debit Spread
,«*''
Using calls for both legs of a vertical bull spread creates a debit spread. Funds
are debited from the trader's account to pay for the spread. One of the
benefits to a nonprofessional trader using a debit spread is that the amount
of funds removed from the account represents the maximum risk. The net
debit is equal to the amount paid for (buying) the lower strike call minus the
amount received for (selling) the higher strike call.
.,
V
Even if the trader is 180 degrees off in market direction, the net debit
(and the ever-present commissions) still represents the maximum loss. Thus,
a trader is unlikely to be called for margin.* This representation of a nonprofessional trader may sound harsh, but casual participants in the serious
world of trading tend to lose much more than reasonably expected. A debit
spread provides "staying power" and a known risk parameter.
Another benefit of using call options in a vertical bull spread is that it
facilitates follow-up action as the expected bull market develops. The specific characteristics of this versatile options spread are detailed in Table 3-1.
The vertical bull call spread will be investigated in Chapter Five in conjunction with a developing Head & Shoulders Bottom price pattern.
Table 3-1
Characteristics of a Vertical Bull Call Spread
1. Long lower strike call versus short higher strike call
2. Limited risk and limited reward
3. Debit transaction
4. Breakeven = lower strike + net debit
5. Maximum profit = higher strike - lower strike - net debit
,
6. Maximum loss = net debit
7. Margin = amount paid (net debit)
Credit Spread
A vertical bull spread placed for a credit uses put options for both legs. The
lower strike remains the long leg of the spread. The net credit taken in
represents the maximum reward. The difference between the strikes minus
the credit is the maximum loss.
Credi t spreads are popular strategies for professional traders who desire
to bring funds into their (interest- bearing) accounts. The spread is placed to
* The possibility of early exercise on the short leg of a vertical spread is detailed at the end r>f
this chapter.
Vertical Spreads
15
take advantage of time decay as well as market direction. In a vertical bull
put spread, the premium received for selling the higher strike is greater than
the premium paid for buying the lower strike. If the underlying instrument
is above the higher strike at expiration, both put options will expire worthless and the trader gets to keep the credit received. This technique is covered
in detail in Chapter Fourteen.
RISK/REWARD DIAGRAMS
Since most technical analysis is graphically oriented, a technically based
options trader should be at ease with risk/reward (prof it/loss) diagrams.
For the basic options strategies presented in this book, the risk/reward
diagrams show at a glance the range of possible outcomes if the initial
options strategy is held until expiration. It should be noted, however, that
in many of the case studies, subsequent market price movement dictated
that the original position be modified. This is not a problem. A new
risk/reward diagram should be constructed.
To introduce the subject, Figure 3-1 shows the simple, positively sloped
45-degree line of an outright long position in an underlying instrument. This
would typically be long 100 shares of a stock or long 1 futures contract. The
open-ended arrows are what is important. They depict unlimited risk and
unlimited reward. Technically, the risk of a long position is not unlimited on
the short side because the future or equity can go only to zero, not below.
Figure 3-2 is the risk/reward diagram of several vertical bull call spreads
at expiration. The big differences between Figures 3-1 and 3-2 are the two
discontinuities in the lines in Figure 3-2. The bend in the lines to the
horizontal represents the beginning price at which risk or reward is maximized.
The vertical bull spread using call options always entails the purchase
of a lower strike price call and the short sale of a higher strike price call. By
varying the strikes, or the distance between the legs of the spread, different
risk/reward scenarios can be created. In Figure 3-2, the current price of the
underlying instrument is exactly at the price level of "C," which also
happens to be the price at which an option strike is listed.
The call option with the strike price at "C" is referred to as an at-themoney (ATM) option. The vertical bull call spread can be constructed by
using in-the-money (ITM), ATM or out-of-the-money (OTM) options. This
will change the strategy from least aggressive to most aggressive with
respect to the expected price up move. Measuring objectives obtained from
the price chart of the underlying and liquidity considerations will dictate
which option strikes to select. The choice of which strikes and expiration to
use will be covered in detail in Chapters Four and Five.
16
Chapter 3
Figure 3-1
V
Risk/Reward Diagram of a Long Position in the Underlying
Instrument
In looking at Figure 3-2, it is important to note that the maximum profit
in a vertical bull call spread is realized if the price of the underlying is at or
above the higher strike at expiration. The maximum loss is recorded if the
underlying is at or below the lower strike at expiration. These concepts will
become second nature very soon after any options trading program is begun.
New options traders are encouraged to plot the risk/reward strategies
of the simple spreads presented in this book. In fact, close examination of
the risk/ reward diagrams in the case studies will reveal that the same chart
paper and grid values are used to construct both the price plot of the
underlying instrument and the risk/reward diagrams. A discussion of how
to create a tabular risk/reward matrix and the resulting risk/reward
diagram is found in Chapter Five; refer to Table 5-5 and Figure 5-9.
BEAR SPREAD
A vertical bear spread is constructed by buying a higher strike and selling a
lower strike option, both of the same type and expiration. Puts can be used
Vertical Spreads
Figure 3-2
C
C
Risk/Reward Diagrams of Vertical Bull Call Spreads
at Expiration
17
for both legs of the spread or calls can be used. The vertical bear spread
should be profitable in a downtrending price market.
Debit Spread
Utilizing put options in a vertical bear spread creates a debit spread. This
strategy allows for follow-up action as the expected price down move
develops. The vertical bear put spread will be investigated in Chapter Seven
as a strategy for leading off in anticipation of a Head & Shoulders Top
forming on a chart. The important characteristics of this spread are found in
Table 3-2.
Table 3-2
Characteristics of a Vertical Bear Put Spread
1. Long higher strike put versus short lower strike put
2. Limited risk and limited reward
3. Debit transaction
4. Breakeven = higher strike - net debit
5.
Maximum profit = higher strike - lower strike - net debit
6. Maximum loss = net debit
7. Margin = amount paid (net debit)
Credit Spread
A bearish view can also be adopted by options traders desiring to write a
spread for a credit using calls for both legs of the spread. The higher strike
remains the long leg. The maximum reward is the credit received. The
maximum loss is equal to the distance between the legs of the spread
(converted to Dollars per contract) minus the net credit.
As with the credit bull spread, follow-up action from a credit bear spread
is not as advantageous as in the debit spread. This is especially true for a
trader expecting a substantial price move but desiring the liquidity of
at-the-money options. Therefore, the debit spreads (both bull and bear) will
be the predominant examples in this book. This does not mean that credit
spreads are not a powerful tool. A vertical bear spread using call options is
examined in Chapter Fourteen.
DECAY OF VERTICAL SPREADS WITH TIME
The risk/reward diagrams of vertical spreads at expiration are straightforward, but the spreads are obviously initiated at price differences off that
curve. How does the value of a debit vertical spread change over time?
Options pricing suggests the following:*
In-the-money
Bull Call Spreads
and
Bear Put Spreads
Gain in value most
sharply in last 30
market days
Out-of-the-money
Bull Call Spreads
and
Bear Put Spreads
Lose value most
sharply in last 30
market days
The movement of a spread's value toward the inevitable location somewhere on the risk/reward line at expiration is known as the decaying
process. This is shown in Figure 3-3. The conclusion is that if the anticipated
price move does not begin as soon as the trader expected (and prices remain
flat), the in-the-money spreads make time work for the spreader.
Figure 3-3
Decay of a Vertical Bull Call Spread with Time
Spread is
Out-of-the-Money
Spread is
In-the-Money
* Refer to Appendix B for an overview of a representative options pricing model.
unapier
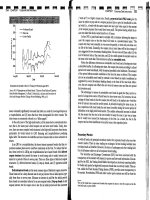
Figure 4-1
Possible Head & Shoulders Bottom
Minimum measuring
objective if formation
is activated
The technician is anticipating
a close above the neckline
on a noticeable increase
in volume
Neckline
Right
Shoulder?
Diminishing volume
on selloff for the right
shoulder is ideal.
upon a possible Head & Shoulders pattern. This is the starring node for the
decision tree in Figure 4-2. Moving down in the decision tree, a trader
encounters some of the possible paths and the trading decisions that must
be made along the way.
The uppermost figure in the decision tree, labeled decision node 1,
shows call options strike prices. They are labeled A through E and range
from an in-the-money (ITM) call at a strike price of A to an out-of-the-money
(OTM) call with a strike price of E. The call option with a strike closest to the
tick mark of the current closing price of the underlying instrument is the
at-the-money (ATM) call C.
Decision Node 1: Initiate Trade
The trading strategy begins with leading off by placing a position in anticipation that the possible Head & Shoulders Bottom will be activated. This is a
Figure 4-2
Decision Tree: Possible Head & Shoulders Bottom
24
Chapter 4
vertical bull call spread. Lower strike calls are purchased and higher strike
calls are sold.
A n approximate upside measuring objective can be obtained at this time.
This would imply placing a vertical bull call spread with the highest strike
at the measuring objective. It is suggested, however, that the closest out-ofthe-money calls be purchased and the calls one strike higher be sold. This is
for liquidity considerations in anticipation of follow-up action when the
neckline (just overhead) is penetrated.
The next lower level in the decision tree shows the two most distinct
price moves that could occur—a rally or a selloff. The market also could
move sideways or experience myriad other price gyrations.
C
Decision Node 2: Valid Breakout
A close above the neckline on a noticeable increase in volume officially
activates the H&S Bottom, This allows the technician to construct the specific
upside measuring objective. It is also the time to make any trading strategy
more directionally aggressive. For a vertical bull call spread, one-half of the
losing leg should be liquidated. This means buying back—covering—onehalf of the higher strike calls that were sold short.
It is of utmost i mportance for any trader to have a defined risk parameter.
For classical bar chartists, this is usually straightforward. Assuming there
was no possible second left shoulder on the chart, the technician would not
expect the low of the right shoulder to be taken out. Thus, the bullish outlook
would not seriously deteriorate unless a selloff to below the right shoulder
occurred.
Stop-loss orders in the options themselves are not usually recommended. A "mental" stop in the underlying instrument is the preferred
approach. This means, of course, that a trader must possess the discipline to
exit from a losing options position if the technical aspects of the underlying
instrument begin breaking down.
Decision Node 3: Failure
Any Head & Shoulders formation is destroyed when the extreme of the head
is violated, even intraday. This is the path taken in decision node 3. Any bull
strategy must be abandoned. The entire vertical bull spread should be
liquidated.
Theoretical txampie—neaa &
Making a new price low affirms that the direction of the major trend
remains downward. It does not automatically create a specific downside
measuring objective. Therefore, it is never advisable to liquidate the long
calls and stay with the short calls of the vertical spread. The position would
turn into one of unlimited risk. It is far better to exit from a losing position
and look for another more clear-cut technical situation.
Decision Node 4: Objective Met
When any classical bar charting measuring objective is met, it is prudent to
realize at least some profits. In the case of the Head & Shoulders formation,
profits on one-quarter to one-half of the position should be taken. Why only
25 percent? An H&S measuring objective is a minimum target. Although no
specific maximum objective can be calculated, quotes often move far beyond
the minimum objective.
A trader should try to follow the old adage of cutting losses and letting
profits run. This is what is being done in removing only a portion of the
winning trade. The decision to exit from the remaining open positions
should be based on usual support/resistance and volume/open interest
considerations.
Decision Node 5: Fullback
In the long run, the most optimal path through the decision tree would flow
through decision node 5. A price sell-off on declining volume back to the
neckline would prompt removal of any remaining bearish positions. All
short calls should be covered. The resulting position is simply long call
options. Note that this is the technical situation in the options strategy matrix
in Chapter Two that results in the long call strategy. This occurs "en route to
price pattern measuring objective after a pullback has occurred."
Decision Node 6: Objective Met
Similar to decision node 4, a trader should begin to take partial profits when
an objective is achieved. Removing 25 to 50 percent of all bullish positions
is suggested. But this is, as economists are wont to say, "all other things being
26
Chapter 4
equal." This is not usually the case. For example, if the underlying instrument is a futures contract, open interest changes become important. In a
futures contract, open interest declining as a price target is being achieved
is a warning signal. The percentage of profitable positions removed would
move up to 75 percent.
In general, protective mental sell-stops in the underlying instrument
would follow the market up—moving in fits and starts depending upon
where support formed on the chart.
Decision Node 7: Symmetry Destroyed
If quotes move below the right shoulder low, the symmetry of the Head &
Shoulders Bottom is destroyed. This does not automatically invalidate the
pattern. The pattern is destroyed if the low of the head is taken out. But a
trader must begin to mitigate the loss of the long call position. Removing
approximately one-half of the long calls would accomplish this.
Decision Node 8: Another Chance
Since the Head & Shoulders Bottom remains valid, the original upside
measuring objective is intact. A bullish stance should be held unless the low
of this second pullback is taken out. The decision to add to bull positions is
tricky. A close above the neckline once again would certainly revive the
bullish look of the chart. Aggressive traders can then look to increase a
bullish bias—possibly with outright longs in the underlying instrument
rather than long calls.
Decision Node 9: Pattern Destroyed
The worst path through the decision tree culminates in decision node 9; the
H&S pattern has failed. Although the H&S formation is usually highly
reliable, it does fail in up to 20 percent of the cases.
If enough premium is remaining in the long call options, they can be
liquidated. If so little premium remains, they can be held rather than paying
commissions. Maybe the trader will get lucky and a price rally will occur.
But a trader who uses the words "luck" or "hope" is in a terrible situation!
WHICH OPTIONS EXPIRATION TO USE
Timing is a critical factor for all options traders. The question of which
options expiration series to use is addressed by the time frame in which the
expected price move should occur. Price patterns generate minimum
measuring objectives but they typically do not produce a specific time
parameter of when the price target will be reached. The Head & Shoulders
formation, however, does yield a reasonable maximum time in which the
objective should be met.
A fail-safe trendline can be constructed using any H&S Top or Bottom
formation. This trendline is drawn tangent to the price extremes of the head
and right shoulder. An example is shown in Figure 4-3. A penetration (even
intraday) of the fail-safe trendline is often used by technicians as a signal to
liquidate outright long or short positions (i.e., positions with unlimited risk).
Classical bar chartists realize that a price move beyond the extreme price in
the head would officially destroy the H&S pattern. So it is possible that an
Figure 4-3
Intersection of Objective Price and Fail-Safe Trendline
28
Chapter 4
H&S formation can work even if the fail-safe trendline is broken, as long as
the head is not taken out.
Figure 4-3 shows the intersection of the price height measuring objective
and the fail-safe trendline. Moving down to the time scale, a date is obtained.
The assumption is made that the minimum measuring objective will be
achieved without violating the fail-safe trendline. This is a reasonable assumption. Hence, an options expiration at (or slightly later than) the derived
date would be used.
Historical observation has shown that the price move away from a Head
& Shoulders formation often accelerates. For this reason, the intersection
date derived in Figure 4-3 is indeed a maximum. The measuring objective
would be expected to be reached much sooner than this maximum date.