Corporate finance chapter 010 risk management
Bạn đang xem bản rút gọn của tài liệu. Xem và tải ngay bản đầy đủ của tài liệu tại đây (165.44 KB, 10 trang )
Chapter 10: Risk
Management
Objective
•Risk and Financial Decision Making
•Conceptual Framework for Risk
1
Management
•Efficient Allocation of
Risk-Bearing
10.1 What is Risk?
10.2 Risk and Economic Decisions
10.3 The Risk Management Process
10.4 The Three Dimensions of Risk Transfer
10.5 Risk Transfer and Economic Efficiency
10.6 Institutions for Risk Management
10.7 Portfolio Theory: Quantitative Analysis for
Optimal Risk Management
10.8 Probability Distributions of Returns
10.9 Standard Deviation as a Measure of Risk
2
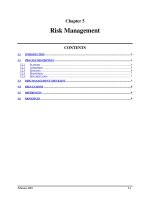
Standard Deviations of Portfolios
0.20
Standare Deviation
0.19
σ = 0.2000
0.18
σ = 0.1421
0.17
0.16
0.15
0.14
0.13
0
1
2
3
4
5
6
Portfolio Size
σ* = 0.1342
Theoretical Minimum
3
7
8
9
10
Equation for Homogeneous
Diversification with n Stocks
σ
port
= σ stock
1 n( n − 1)
+
ρ
2
n
n
4
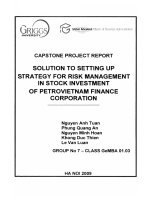
Returns on GENCO & RISCO
State of Return on Return on ProbEconomy RISCO
GENCO
ability
Strong
50%
30%
0.20
Normal
10%
10%
0.60
Weak
-30%
-10%
0.20
5
Probability Distributions of Returns of Genco and Risco
0.6
0.5
0.4
Probability
0.3
0.2
0.1
0
50%
Genco
30%
Risco
10%
-10%
Return
6
-30%
Equations: Mean
µ r = E [ r ] = P1r1 + P2 r2 + P3 r3 + ...Pn rn
= P ⋅r
n
= ∑ Pi ri
i =1
µ rGENCO = 0.2 × 0.3 + 0.6 × 0.10 + 0.2 × (−0.10)
µ rGENCO = 0.10 = 10%
Also :
µ rRISCO = 10%
7
σr
Equations: Standard
Deviation
= E [( r − E [ r ] ) ]
2
= P1 ( r1 − µ r ) + P2 ( r2 − µ r ) + ... + Pn ( rn − µ r )
2
=
n
∑ Pi ( ri − µ r )
2
2
2
i =1
σ rGENCO = 0.2 × ( 0.30 − 0.10 ) + 0.6 × ( 0.10 − 0.10 ) + 0.2 × (−0.10 − 0.10) 2
2
2
σ rGENCO = 0.016 = 0.1265
Also :
σ rRISCO = 0.2530
8
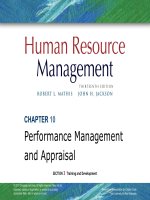
Distribution of Returns on Two Stocks
3.5
Probability Density
3.0
2.5
NORMCO
2.0
VOLCO
1.5
1.0
0.5
0.0
-100%
-50%
0%
Return
50%
9
100%
Two More Return Densities.
1.8
1.6
1.4
Probability Density.
VOLCO
ODDCO
1.2
1.0
0.8
0.6
0.4
0.2
-100.00%
-50.00%
0.0
0.00%
50.00%
Return.
10
100.00%