Marcro micro econmiy david begg chapter 027
Bạn đang xem bản rút gọn của tài liệu. Xem và tải ngay bản đầy đủ của tài liệu tại đây (163.58 KB, 20 trang )
Chapter 27
Unemployment
David Begg, Stanley Fischer and Rudiger Dornbusch, Economics,
6th Edition, McGraw-Hill, 2000
Power Point presentation by Peter Smith
Some key terms
■
Unemployment rate:
–
■
Labour force
–
■
the percentage of the labour force without a job
but registered as being willing and available for
work
those people holding a job or registered as being
willing and available for work
Participation rate
–
the percentage of the population of working age
declaring themselves to be in the labour force
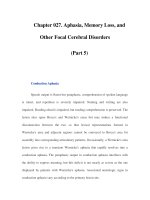
27.2
Unemployment in the UK, 1950-99
14
12
% p.a.
10
8
6
4
2
0
Source: Economic Trends Annual Supplement, Labour Market Trends
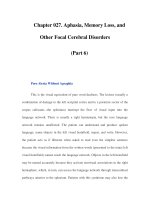
27.3
Unemployment (%) in selected countries
14
12
10
%
8
6
4
2
0
1972
UK
1982
Ireland
France
1999
EU
USA
27.4
Labour market flows
It is tempting to see the labour market in static terms
Working
Unemployed
Out of the
labour force
but...
27.5
Labour market flows
New hires
Recalls
Working
Job-losers
Lay-offs
Quits
Discouraged
workers
Retiring
Temporarily
leaving
Taking
a job
Unemployed
Out of the
labour force
Re-entrants
New entrants
27.6
More on labour market flows
The size of these flows is surprisingly
high
■ In 1999 unemployment in the UK
began at 1.29 million
■ During the year:
■
–
–
3.14 million became unemployed
but 3.3 million left the ranks of the
unemployed
27.7
The composition of unemployment
■ Different
groups in society are
more vulnerable to
unemployment, varying by:
age
– gender
– region
– ethnic origin
–
27.8
Types of unemployment
■
Frictional
–
■
the irreducible minimum level of unemployment in a
dynamic society
■
people between jobs
■
the ‘almost unemployable’
Structural
–
unemployment arising from a mismatch of skills and job
opportunities when the pattern of demand and
production changes
■
it takes time for ex-coal miners to retrain as international
bankers
27.9
Types of unemployment (2)
■
■
Demand-deficient unemployment
–
occurs when output is below full capacity
–
‘Keynesian’ unemployment occurs in the
transitional period before wages and prices have
fully adjusted
Classical unemployment
–
created when the wage is deliberately maintained
above the level at which labour supply and labour
demand schedules intersect
27.10
A ‘modern’ view of unemployment
A similar categorization is retained, but
an important distinction is to be noted
between:
■ Voluntary unemployment
■
–
■
when a worker chooses not to accept a job at
the going wage rate
Involuntary unemployment
–
when a worker would be willing to accept a
job at the going wage but cannot get an offer.
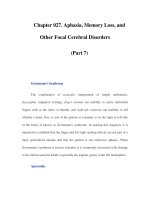
27.11
The natural rate of unemployment
Real wage
AJ
w*
E
F
N* N1
Number of workers
LF
LD: labour demand
LF: size of labour force
AJ: the number of workers
prepared to accept jobs
AJ is to the left of LF
because some members
of the labour force are
between jobs, others are
LD waiting for better offers.
Equilibrium is at w*, N*.
The distance EF is the
natural rate of unemployment.
27.12
The natural rate of unemployment
■
The natural rate of unemployment is
the rate of unemployment when the
labour market is in equilibrium.
■
This is entirely voluntary.
■
It includes:
–
frictional unemployment
–
structural unemployment
27.13
Real wage
Classical unemployment
w2
w*
AJ
A B
C
LF
Suppose that union power
succeeds in maintaining a
real wage of w2.
Equilibrium is at A
and unemployment is AC,
of which BC is voluntary
LD and AB is involuntary
N2 N* N1
Number of workers
To the extent that this
unemployment reflects a
conscious decision by
unions to restrict employment,
it is voluntary unemployment.
27.14
UK unemployment 1956-95
12
10
8
% 6
4
2
0
56-59
60-8
69-73
Actual rate
74-80
81-87
88-90
91-95
Natural rate
27.15
Supply-side economics
■
entails the use of microeconomic
incentives to alter
–
–
–
■
the level of full employment
the level of potential output
the natural rate of unemployment
In the long run the performance of the
economy can only be changed only by
affecting the level of full employment and
the corresponding level of potential output.
27.16
Real wage
Tax cuts and unemployment
w1
w2
w3
AJ
A
E
B
N1 N2
LF
With an income tax, the
gross wage paid by firms (w1)
is higher than the take-home
net pay of workers (w3).
Equilibrium is at N1
F
AB is the amount of tax
C
Unemployment is BC
Without tax, equilibrium
LD is at E.
Unemployment is now EF.
Number of workers
EF is less than BC because of the relative slopes of LF & AJ
but the differences may not be substantial.
27.17
Other supply-side policies
■
Trade union reform
–
■
reducing the power of trade unions may limit distortions in the
labour market
Other labour supply policies
–
training and retraining measures
–
improving the efficiency of the labour market
■
■
such measures may affect frictional and structural unemployment
Investment
–
higher investment may increase the demand for labour
■
may be achieved via tax incentives or low interest rates
27.18
Hysteresis
■
The idea that a (short-run) fall in
labour demand may lead to a
permanent fall in labour supply
■
This could help to explain high and
persistent unemployment in Europe
in the 1980s
27.19
Hysteresis (continued)
■
Four channels:
–
Insider-outsider distinction
■
–
Discouraged workers
■
–
people stop looking for jobs
Search and mismatch
■
–
only those in work take part in wage bargaining & they protect
their own positions
firms and workers get used to low search
capital stock
■
low levels of investment in recession lead to permanently low
capital stock levels
27.20