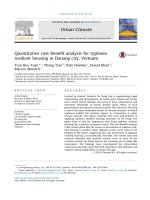
suggesting measurement system analysis for metkraft ltd
Bạn đang xem bản rút gọn của tài liệu. Xem và tải ngay bản đầy đủ của tài liệu tại đây (1.79 MB, 60 trang )
1
HO CHI MINH CITY OPEN UNIVERSITY
UNIVERSITÉ LIBRE DE BRUXELLES
SOLVAY BRUSSELS SCHOOL OF
ECONOMICS & MANAGEMENT
MBQPM5
NGUYEN NHAT VU
SUGGESTING
MEASUREMENT SYSTEM ANALYSIS
FOR METKRAFT LTD.
MASTER FINAL PROJECT
MASTER IN BUSINESS QUALITY AND PERFORMANCE MANAGEMENT
Ho Chi Minh City
(2016)
1
STATEMENT OF AUTHENTICATION
To the Jury and Readers,
I have read and understood the Regulations of the Master of Business Quality
& Performance Management program offered by Solway Brussels School of
Economics and Management (SBSEM), Universite’ Libre De Bruxelles (ULB)
at Ho Chi Minh City Open University (HCMCOU). I have produced this work
without any help other than that which my Tutor has explained is acceptable
within the Regulations of the MBQPM program. I have acknowledged all
source materials in the work itself.
Respectfully,
Student: Nguyen Nhat Vu
Ho Chi Minh City, dated 10 April 2016
2
PREFACE AND ACKNOWLEDGEMENTS
Peter Drucker, a management thinker, is often quoted as saying “You can’t manage
what you can’t measure” or “If you can't measure it, you can't improve it.” Yes,
measurement plays an important part in daily life and obviously it is vital in terms of
business quality. As a quality officer of METKRAFT LTD, my key concern is how
capable our measuring system is. A capable system which produces accurate and
reliable measurements will help ensure we do not deliver bad products to our
customers just because we fail to know they are not good. With better insights into
business quality and performance management, obtained so far through this
academic and professional training program offered by Solway Brussels School of
Economics and Management, I have set out for myself and quality team the
expectation to complete this MSA (Measuring System Analysis) work item. This will
provide us highlights of areas of weakness of the measurement system that we are
to focus improving from this year of 2016.
For this report to be successfully presented in completion of my study of the Master
in Business Quality & Performance Management program, I would like to express
my special thanks to Professor Jacque Martin for his guidance and support during
my preparation. I would like to thank Professor Jacque Martin again and the rest
professors for your excellence in delivering MBQBM5 classes as well as the
administrative staff from Ho Chi Minh City Open University for all your valuable
knowledge transfer and helpfulness.
My thanks go to authors and originators of the information I have quoted and
referenced in this writing. I would like to acknowledge the referencing of such
information for which I myself have not been able to consult authors for permission.
However, I can confirm that the information is intended for no more than just
references and should not the call mark of this writing. As far as you go through, I
will have acknowledged all source materials in this writing itself.
Last but not least, I would like to sincerely thank the Management of METKRAFT
LTD for this international business studying opportunity with Solway Brussels
School of Economics and Management and to my quality team as well as all other
company colleagues for your valued support that allows the completion of this
academic report.
Yours respectfully,
Student: Nguyen Nhat Vu
Ho Chi Minh City, dated 10 April 2016
3
4
TABLE OF CONTENTS
No.
Contents
Pages
(-)
(-)
STATEMENT OF AUTHENTICATION
PREFACE AND ACKNOWLEDGEMENTS
1
2
(-)
3
(-)
ACADEMIC TUTOR COMMENTS AND APPROVAL
SIGNATURE
TABLE OF CONTENTS
4
(-)
LIST OF TABLES AND CHARTS
5
(-)
(-)
(-)
LIST OF ABBREVIATIONS
PART I: ABOUT COMPANY & KEY PROCESS
6
7-16
1.
2.
3.
(-)
1.
2.
3.
4.
5.
(-)
(-)
1.
2.
CHAPTER 1: AN INTRODUCTION TO METKRAFT LTD
Company Profile
Organization Chart
Process Map
CHAPTER 2: METKRAFT’S KEY PROCESS
Identification of Key Process
Fulfilment of Key Process Identity Card
Measurement process Flowchart
Measurement process Identity Card
FMECA of Measurement Process
PART II: ABOUT MEASUREMENT & MSA REPORT
CHATER 1: ABOUT MEASUREMENT
Reliability of Measurement
Variation in Measurement Process
7-9
7
8
9
10-16
10
11
12
13
14-16
17-41
17-19
17
17
3.
(-)
1.
2.
3.
(-)
(-)
i.
ii.
iii.
iv.
v.
Measurement System Analysis
CHAPTER 2: METKRAFT MSA REPORT
Scope and Objectives
Gages R&R% Results
Comments & Recommendations
REFERENCES
APPENDICES
Risk Priority Number (RPN)
Grid of Severity Evaluation Criteria Ranking
Grid of Occurrence Evaluation Criteria Ranking
Grid of Detection Evaluation Criteria Ranking
List of Measuring Instruments
18-19
20-41
20
21-39
40-41
42
43-47
44
45
46
47
48-59
5
LIST OF TABLES & CHARTS
No
Description
Pages
1.
Organization Chart
8
2.
Process Map
9
3.
Fulfilment of Key Process Identity Card
11
4.
Measurement Process Flowchart
12
5.
Measurement Process Identity Card
13
6.
FMECA of Measurement Process
7.
Variation in the Measurement Process - SWIPE
17
8.
Gage R&R% charts - Example
21
9.
Gage R&R% data table - Example
22
10.
Gage #1 – Report For Readings (HRC) - Bevel Hardness
24
11.
Gage #2 – Report For Readings (HRC) - Induction Hardness
25
12.
Gage #3 – Report For Readings (mm) - Length
26
13.
Gage #4 – Report For Readings (mm) - Width
27
14.
Gage #5 – Report For Readings (mm) - Thickness
28
15.
Gage #6 – Report For Readings (mm) - Depth of Holes
29
16.
Gage #7 – Report For Readings (mm) - Hole to Hole
30
17.
Gage #8 – Report For Readings (mm) - Hole Diameter
31
18.
Gage #9 – Report For Readings (mm) - Hole to Side
32
19.
Gage #10 – Report For Readings (mm) - Hole to Side
33
20.
Gage #11 – Report For Readings (mm) - Inside Diameter
34
21.
Gage #12 – Report For Readings (mm) - Outside Diameter
35
22.
Gage #13 – Report For Readings (degree) - Bevel Angle - 1
36
23.
Gage #14 – Report For Readings (degree) - Bevel Angle - 2
37
24.
Gage #15 – Report For Readings (RMS) - Surface Finish
38
25.
Gages R&R% Results Summary
39
26.
Risk Priority Number (RPN)
44
27.
Grid of Severity Evaluation Criteria Ranking
45
28.
Grid of Occurrence Evaluation Criteria Ranking
46
29.
Grid of Detection Evaluation Criteria Ranking
47
30.
List of Measuring Instruments
14-16
48-59
6
LIST OF ABBREVIATIONS
01.
CNC
:
Computer Numeral Control
02.
CpK, Cpk
:
Process Capability Index
03.
ERP:
:
Enterprise Resources Planning
04.
FMECA
:
Failure Mode-Effect-Criticality Analysis
05.
Gage R&R%
:
Gage Repeatability & Reproducibility %
06.
HRC
:
Hardness Rockwell C Level
07.
KPI
:
Key Performance Indicator
08.
METKRAFT
:
MEKKRAFT LTD.
09.
MSA
:
Measurement System Analysis
10.
PPM
:
Part per million
11.
RMS
:
Root Mean Square
12.
RPN
:
Risk Priority Number
13.
SWIPE
:
Standard-Workpiece-InstrumentProcedure/People-Environment
14.
Var
:
Variation
15.
Var Comp
:
Variation component
7
PART 1:
ABOUT COMPANY AND KEY PROCESS
CHAPER 1: AN INTRODUCTION TO METKRAFT LTD
1.
Company Profile:
Name:
Founded:
Headcount:
Location:
Industry:
Activities:
METKRAFT LTD
1995
300
Tan Thuan EPZ, Dist.7, Ho Chi Minh City
Mechanical manufacturing
Manufacture of industrial precision knives and blades and wear
components
METKRAFT (former: Z.C. International Ltd., Vietnam) was established by
USA- based Zenith Cutter Co. in 1995. METKRAFT had been producing
industrial knives and blades branded “Zenith Cutter” for the States and North
America markets. Zenith Cutter Co. as well as its subsidy METKTAFT was
acquired in 2011 by the Fisher Barton Group. The Fisher Barton Group,
operating globally, specializes in high precision engineering products and
services. Since 01 Jan 2015, METKRAFT has been independent of Zenith
Cutter Co. and become a new member company of Fisher Barton Group.
METKRAFT is expanding globally and intensively in Asia markets. The
company is embracing its vision to “Become a Leading Premium Industrial
Blades and Wear Components Manufacturer in Asia” in the next 10 years with
the mission to “Continuously Discover Innovative Products and Services and
Foster a Creative and Energetic Working Environment for Employees”.
To succeed in the strategy, METKRAFT is going to leverage all its competitive
advantages such as its having operated in Vietnam for 20 years, having
produced high quality and well branded products, being the first mover with
innovative products into the emerging market and inheriting a wide range of
technological innovations and industrial expertise owned by all the Fisher
Barton Group member companies. Also, the company is re-aligning its
resources and processes to meet needs arising from the new and challenging
business context and the increasingly competitive business environment.
8
2.
Organization Chart:
9
3.
Process Map:
10
CHAPTER 2:
METKRAFT’S KEY PROCESS
1.
Identification of Key Process – MEASUREMENT PROCESS:
The measurement process of METKRAFT comprises quality inspection activities
that take place from the time raw steel material arrives at the factory, through
production processes, and up to before finished products are received into finished
goods warehouse. METKRAFT considers measurement process to be its Key
Process for the following reasons:
•
METKRAFT manufactures precision engineering products. Effectiveness of the
measurement process ensures METKRAFT complies with high precision
product requirements from its customers.
•
Quality comes first in its Quality Policy. Continuing to provide quality products
and services is to ensure METKRAFT fulfills its mission to become an Asia’s
leading manufacturer of premium industrial knives and wear components in the
next ten years. To so achieve, METKRAFT needs to maintain an effective and
reliable measuring system.
•
Any quality issue with products that have been delivered to METKRAFT’s
customers will mean financial losses and risk industrial brand image and
reputation of itself and the entire corporation.
•
Any measuring errors from one production process can cause a delay in
subsequent ones, which will again end up in increased production cost or the
failure to deliver on time. “Non-quality cost is high”.
•
Failure to catch discrepancies at critical points or of critical features of the
products, which could be undetectable through the rest of the flow, will pose
not only underperforming product problems but safety risks to users.
11
2.
Fulfilling Key Process Identity Card:
12
3.
Measurement Process Flow Chart
13
4.
Measurement Process Identity Card
14
15
16
17
PART II:
ABOUT MEASUREMENT AND METKRAFT’S MSA REPORT
CHATER 1:
ABOUT MEASUREMENT
1.
Reliability of Measurement
Reliability is a prerequisite to measurements. Measurements generate data, which
is then analysed and compared with requirements or specifications so that an
appropriate conclusion can be drawn, whether what has been measured is or is not
accepted. However, measurement data that is not reliable also means conclusions
then decisions made on such data cannot be reliable either. Actions taken from
unreliable decisions thereby will contribute greatly to manufacturers’ cost of quality.
Characteristics that make measurement data reliable includes:
Accuracy: The closeness of the agreement between the result of a
measurement and a true value of the measurement.
Precision: The closeness of the agreement between the results of successive
measurements of the same measurement carried out under the same
conditions of measurement. Precision is also called Repeatability.
Reproducibility: The closeness of the agreement between the results of
measurements of the same measurement carried out under changed
conditions of measurement.
2.
Variation in Measurement Processes
Any measurement process bears in its variation that can be as illustrated in SWIPE
diagram:
18
Please refer to quoted explanation in italics (***) about these five factors given
below:
Standard. There are different levels of standard in the traceability chain in
order to provide measurement traceability. Each of these standards, in turn,
introduces some variation. Factors affecting the standard refer to this
variation.
Work piece. No work piece is absolutely stable. There is always an inherent
instability in any material or substance. However small the instability might
be, this gives rise to variation in the measurement process.
Instrument. All measuring instruments have a stated accuracy or
uncertainty. No instrument can measure the true value of the parameter.
Thus, the accuracy or uncertainty of the measuring instrument contributes to
the variation in the measurement.
Person and procedure. Factors affecting person and procedure stem from
the fact that no two human beings’ visual judgement is identical. Also,
different methods of measurement—the procedure— would give rise to
variation.
Environment. The environment plays an important role in any process of
measurement. It might be possible to correct the effect of a few
environmental conditions, such as temperature and height above mean sea
level, to some extent. There are, however, quite a few environmental
conditions for which there is no correction factor. Environmental conditions
would, therefore, give rise to some variation in every measurement process.
Considering the first letter of each factor (shown in bold in the above figure),
these factors are collectively known as SWIPE. Total variation due to SWIPE
is also known as “uncertainty in measurement”, which quantifies the
reliability of the measurement data. The smaller the uncertainty, the more
reliable the data.
3.
Measurement System Analysis
Measurement System Analysis (MSA), or Gage R&R%, is a method in estimating
variation in measurement processes. A Gage R&R% analyses the system and
calculate the gage repeatability and reproducibility. The Gage R&R% is one in
which operators perform measurements (trial) on samples using the same
measuring instrument. In a Gage R&R%, the number of each of appraisers,
samples, or trials must be >1 and the minimum value for appraisers times samples
times trials is 45.
Software tools such as Minitab is ideal as a “revolutionary” tool in processing Gage
R&R% input data to identify and quantify the following:
19
•
•
•
Repeatability, for instrument variation
Reproducibility, for appraiser or operator variation
Part-to-part, for process variation
Through analysing the gage results of the instrument, the software tool can find out
whether the variation in the measured data is due to variation in the product (Partto-part) or the measurement system (Repeatability and Reproducibility). Following
are conclusions commonly drawn in industries based the variation analysis:
•
If gage repeatability and reproducibility value is less than 10 per cent, the
measurement system is acceptable.
•
If repeatability and reproducibility is between 10 per cent and 30 per cent, the
measurement system may be accepted depending on the importance of the
parameter being measured.
•
If gauge repeatability and reproducibility is above 30 per cent, the
measurement system needs improvement.
•
If repeatability is larger than reproducibility, the instrument needs maintenance
or replacement.
•
If reproducibility is larger than repeatability, the appraiser or operator needs
better training and/or the instrument needs recalibration.
[(***): Reference, page 42]
20
CHATER 2:
METKRAFT’S MSA REPORT
1.
Scope and Objectives:
a.
Scope:
This MSA gages involve the use of “Instruments” (measuring tools or equipment)
that are classified as in-use category in METKRAFT. In-use instruments are those
that hold manufacturer’s design tolerance or tolerance that METKRAFT has specific
acceptance to, which can be observed through its calibration process. However,
these exclude go-no-go gages (for not producing variable data for Gages R&R) used
in replacement of reading-type tools for productivity purpose; the ultra sound unit
used to detect internal steel lamination; and high-tech/high precision equipment that
is not widely provided for use by operators or inspectors on the shop floor but limited
specialized officers mostly to verify measurements taken by the rest instruments.
These high precision equipment exclusives list include the chemical composition
analyser, the microstructure magnifier, the CMM and optical units. (See Appendix
IV: List of Measuring Instruments):
•
“Parts” or products that are taken randomly out of production lots and at times
convenient for measurements for these gages R&R%.
•
“Operators” including workers who make parts/run machines or quality
inspectors at inspection stages;
•
Inspection criteria representative of METKRAFT manufacturing processes and
product characteristics and can be measured with tools and equipment
commonly used by company teams for these gages % R&R.
•
Gages R&R% charts produced by Minitab software tool and findings from
these graphics; and:
b.
Objective:
•
The MSA gages provide an overview of the capability of existing measurement
system through performance of representative inspection criteria and types of
instruments at METKRAFT LTD, and:
•
An illustration of a method of how measurement system data can be looked at
and in a way that areas of weakness can be recognized, which is being
proposed for implementation at METKRAFT LTD as a tool needed for analysis
for continuous improvement of the measurement system.
21
2.
Gages R&R% Results
2.1. Gages R&R% Proceedings
•
15 gages were conducted as for representative inspection criteria and
applicable types of instruments at METKRAFT LTD.
•
For one gage, 15 sample parts were randomly drawn from related working
process and measured referencing relevant process specification.
•
Each sample was measured by 2 operators using the same instrument for two
times (trials) each.
•
Gage samples were prepared by an independent “organizer” for each gage so
that neither of operators had history of previous trial result of a sample or knew
which sample he or she was measuring.
•
Readings of all trials by both operators were collected and processed with the
help of Minitab software to get to the Gage #s results.
•
Reading R&R% results from Minitab software output, please refer to notes on
each of the 15 gage results on the next pages:
2.2. Gage R&R% Example
Gage R&R% charts - Example
(1)
(2)
(4)
(5)
(3)
(6)
22
Explanations:
(1)
(2)
(3)
(4)
(5)
(6)
Graph featuring components of variation: Total G&R%, Repeatability%,
Reproducibility& and Part-to-part%. With this graph, we are looking at
columns colored for % Contribution and % Study Var.
Sample range chart comparing readings by two operators Van Bung and
Van Cuong (total 15 readings each to each half of chart). Chart indicates
Cuong’s measurement range is of less variation than Bung’s.
Sample mean chart comparing readings by two operators Van Bung and
Van Cuong (total 15 readings each to each half of chart). Chart indicates
both Cuong’s measurements and Bung’s are equally varies compared with
the mean value.
Reading by part chart featuring all measurements by the 2 operators for
each part and shows trend of measurement variation as connecting
average values of all measurements for each of the 15 samples.
Reading by operator chart featuring a comparison of overall variation in
measurement ranges and means between the two operators in the gage.
This also shows Cuong’s measurements are more consistent as the box
plot is closer to mean.
Operator interaction chart featuring average measurement value by each
operator on each sample and trend lines as connecting the 15 averages
to compare trends of averages between the two operators. Averagely,
both operator’s measurements are quite close or consistent.
Gage R&R% data table - Example:
23
Explanations:
•
Compared with established target of 31.23% is at an acceptable level. In other words, the measurement
process is fairly reliable, yet needs improvement.
•
While Total Gage R&R (Repeatability + Reproducibility) contributes only
9.75% to total gage variation, Part-to-part contribution accounts for
90.25%: This shows total variation is mainly due to process instability.
Process capability needs improvement.
•
With Repeatability (30.92%) > Reproducibility (4.38%), the indication is
that the measuring instrument needs maintenance.
2.3. Gages R&R% Results
(Please turn to following pages)
24
Gage # 1
Total Gage R&R (87.98%) is
unacceptable. Variation due
to measurement contributes
77.4% of total variations,
with part-to-part variation @
22.6% only.
Repeatability (87.98%) >
Reproducibility (0%) =>
Instrument needs
maintenance/replacement.