Elementary statistics 8th edition neil WeiSS Par 1
Bạn đang xem bản rút gọn của tài liệu. Xem và tải ngay bản đầy đủ của tài liệu tại đây (29.42 MB, 315 trang )
Elementary
STATISTICS
8TH EDITION
This page intentionally left blank
Elementary
STATISTICS
8TH EDITION
Neil A. Weiss, Ph.D.
School of Mathematical and Statistical Sciences
Arizona State University
Biographies by Carol A. Weiss
Addison-Wesley
Boston Columbus Indianapolis New York San Francisco Upper Saddle River
Amsterdam Cape Town Dubai London Madrid Milan Munich Paris Montreal Toronto
Delhi Mexico City Sao Paulo Sydney Hong Kong Seoul Singapore Taipei Tokyo
On the cover: The cheetah (Acinonyx jubatus) is the world’s fastest land animal, capable of speeds between 70 and 75 mph. A cheetah can go from 0 to 60 mph in only 3 seconds. Adult cheetahs range in weight
from about 80 to 140 lb, in total body length from about 3.5 to 4.5 ft, and in height at the shoulder from
about 2 to 3 ft. They use their extraordinary eyesight, rather than scent, to spot prey, usually antelopes and
hares. Hunting is done by first stalking and then chasing, with roughly half of chases resulting in capture.
Cover photograph: A cheetah at Masai Mara National Reserve, Kenya. Tom Brakefield/Corbis
Editor in Chief: Deirdre Lynch
Acquisitions Editor: Marianne Stepanian
Senior Content Editor: Joanne Dill
Associate Content Editors: Leah Goldberg, Dana Jones
Bettez
Senior Managing Editor: Karen Wernholm
Associate Managing Editor: Tamela Ambush
Senior Production Project Manager: Sheila Spinney
Senior Designer: Barbara T. Atkinson
Digital Assets Manager: Marianne Groth
Senior Media Producer: Christine Stavrou
Software Development: Edward Chappell, Marty Wright
Marketing Manager: Alex Gay
Marketing Coordinator: Kathleen DeChavez
Senior Author Support/Technology Specialist: Joe Vetere
Rights and Permissions Advisor: Michael Joyce
Image Manager: Rachel Youdelman
Senior Prepress Supervisor: Caroline Fell
Manufacturing Manager: Evelyn Beaton
Senior Manufacturing Buyer: Carol Melville
Senior Media Buyer: Ginny Michaud
Cover and Text Design: Rokusek Design, Inc.
Production Coordination, Composition, and
Illustrations: Aptara Corporation
For permission to use copyrighted material, grateful acknowledgment is made to the copyright holders on page C-1, which is hereby made part of this copyright page.
Many of the designations used by manufacturers and sellers to distinguish their products are claimed
as trademarks. Where those designations appear in this book, and Pearson was aware of a trademark
claim, the designations have been printed in initial caps or all caps.
Library of Congress Cataloging-in-Publication Data
Weiss, N. A. (Neil A.)
Elementary statistics / Neil A. Weiss; biographies by Carol A. Weiss. – 8th ed.
p. cm.
Includes indexes.
ISBN 978-0-321-69123-1
1. Statistics–Textbooks. I. Title.
QA276.12.W445 2012
519.5–dc22
2010003341
Copyright C 2012, 2008, 2005, 2002, 1999, 1996, 1993, 1989 Pearson Education, Inc. All rights
reserved. No part of this publication may be reproduced, stored in a retrieval system, or transmitted, in
any form or by any means, electronic, mechanical, photocopying, recording, or otherwise, without the
prior written permission of the publisher. Printed in the United States of America. For information on
obtaining permission for use of material in this work, please submit a written request to Pearson Education, Inc., Rights and Contracts Department, 501 Boylston Street, Suite 900, Boston, MA 02116,
fax your request to 617-671-3447, or e-mail at />1 2 3 4 5 6 7 8 9 10—WC—14 13 12 11 10
ISBN-13: 978-0-321-69123-1
ISBN-10: 0-321-69123-7
To my father
and the memory
of my mother
About the Author
Neil A. Weiss received his Ph.D. from UCLA and subsequently accepted an assistant
professor position at Arizona State University (ASU), where he was ultimately promoted to the rank of full professor. Dr. Weiss has taught statistics, probability, and
mathematics—from the freshman level to the advanced graduate level—for more than
30 years. In recognition of his excellence in teaching, he received the Dean’s Quality Teaching Award from the ASU College of Liberal Arts and Sciences. Dr. Weiss’s
comprehensive knowledge and experience ensures that his texts are mathematically
and statistically accurate, as well as pedagogically sound.
In addition to his numerous research publications, Dr. Weiss is the author of A
Course in Probability (Addison-Wesley, 2006). He has also authored or coauthored
books in finite mathematics, statistics, and real analysis, and is currently working on
a new book on applied regression analysis and the analysis of variance. His texts—
well known for their precision, readability, and pedagogical excellence—are used
worldwide.
Dr. Weiss is a pioneer of the integration of statistical software into textbooks
and the classroom, first providing such integration in the book Introductory Statistics
(Addison-Wesley, 1982). Weiss and Addison-Wesley continue that pioneering spirit to
this day with the inclusion of some of the most comprehensive Web sites in the field.
In his spare time, Dr. Weiss enjoys walking, studying and practicing meditation,
and playing hold’em poker. He is married and has two sons.
vi
Contents
Preface xi
Supplements xviii
Technology Resources xix
Data Sources xxi
PART I
Introduction
C H A P T E R 1 The Nature of Statistics
Case Study: Greatest American Screen Legends
1.1 Statistics Basics
1.2 Simple Random Sampling
∗ 1.3
Other Sampling Designs
∗ 1.4
Experimental Designs
Chapter in Review 27, Review Problems 27, Focusing on Data Analysis 30,
Case Study Discussion 31, Biography 31
P A R T II
Descriptive Statistics
C H A P T E R 2 Organizing Data
Case Study: 25 Highest Paid Women
2.1 Variables and Data
2.2 Organizing Qualitative Data
2.3 Organizing Quantitative Data
2.4 Distribution Shapes
∗ 2.5
Misleading Graphs
Chapter in Review 82, Review Problems 83, Focusing on Data Analysis 87,
Case Study Discussion 87, Biography 88
C H A P T E R 3 Descriptive Measures
Case Study: U.S. Presidential Election
3.1 Measures of Center
3.2 Measures of Variation
3.3 The Five-Number Summary; Boxplots
3.4 Descriptive Measures for Populations; Use of Samples
Chapter in Review 138, Review Problems 139, Focusing on Data Analysis 141,
Case Study Discussion 142, Biography 142
∗ Indicates
1
2
2
3
10
16
22
33
34
34
35
39
50
71
79
89
89
90
101
115
127
optional material.
vii
viii
CONTENTS
C H A P T E R 4 Descriptive Methods in Regression and Correlation
Case Study: Shoe Size and Height
4.1 Linear Equations with One Independent Variable
4.2 The Regression Equation
4.3 The Coefficient of Determination
4.4 Linear Correlation
Chapter in Review 178, Review Problems 179, Focusing on Data Analysis 181,
Case Study Discussion 181, Biography 181
P A R T III
Probability, Random Variables,
and Sampling Distributions
C H A P T E R 5 Probability and Random Variables
Case Study: Texas Hold’em
5.1 Probability Basics
5.2 Events
5.3 Some Rules of Probability
∗ 5.4
Discrete Random Variables and Probability Distributions
∗ 5.5
The Mean and Standard Deviation of a Discrete Random Variable
∗ 5.6
The Binomial Distribution
Chapter in Review 236, Review Problems 237, Focusing on Data Analysis 240,
Case Study Discussion 240, Biography 240
C H A P T E R 6 The Normal Distribution
Case Study: Chest Sizes of Scottish Militiamen
6.1 Introducing Normally Distributed Variables
6.2 Areas Under the Standard Normal Curve
6.3 Working with Normally Distributed Variables
6.4 Assessing Normality; Normal Probability Plots
Chapter in Review 274, Review Problems 275, Focusing on Data Analysis 276,
Case Study Discussion 277, Biography 277
C H A P T E R 7 The Sampling Distribution of the Sample Mean
Case Study: The Chesapeake and Ohio Freight Study
7.1 Sampling Error; the Need for Sampling Distributions
7.2 The Mean and Standard Deviation of the Sample Mean
7.3 The Sampling Distribution of the Sample Mean
Chapter in Review 299, Review Problems 299, Focusing on Data Analysis 302,
Case Study Discussion 302, Biography 302
P A R T IV
Inferential Statistics
C H A P T E R 8 Confidence Intervals for One Population Mean
Case Study: The “Chips Ahoy! 1,000 Chips Challenge”
8.1 Estimating a Population Mean
8.2 Confidence Intervals for One Population Mean When σ Is Known
∗ Indicates
optional material.
143
143
144
149
163
170
183
184
184
185
193
201
208
216
222
242
242
243
252
258
267
278
278
279
285
291
303
304
304
305
311
CONTENTS
ix
8.3 Margin of Error
8.4 Confidence Intervals for One Population Mean When σ Is Unknown
Chapter in Review 335, Review Problems 336, Focusing on Data Analysis 338,
Case Study Discussion 339, Biography 339
319
324
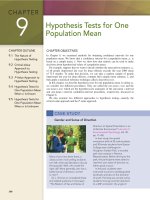
C H A P T E R 9 Hypothesis Tests for One Population Mean
Case Study: Gender and Sense of Direction
9.1 The Nature of Hypothesis Testing
9.2 Critical-Value Approach to Hypothesis Testing
9.3 P-Value Approach to Hypothesis Testing
9.4 Hypothesis Tests for One Population Mean When σ Is Known
9.5 Hypothesis Tests for One Population Mean When σ Is Unknown
Chapter in Review 382, Review Problems 383, Focusing on Data Analysis 387,
Case Study Discussion 387, Biography 388
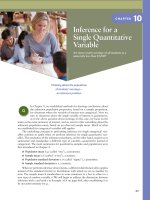
C H A P T E R 10 Inferences for Two Population Means
Case Study: HRT and Cholesterol
10.1 The Sampling Distribution of the Difference between Two Sample
Means for Independent Samples
10.2 Inferences for Two Population Means, Using Independent Samples:
Standard Deviations Assumed Equal
10.3 Inferences for Two Population Means, Using Independent Samples:
Standard Deviations Not Assumed Equal
10.4 Inferences for Two Population Means, Using Paired Samples
Chapter in Review 436, Review Problems 436, Focusing on Data Analysis 440,
Case Study Discussion 440, Biography 441
C H A P T E R 11 Inferences for Population Proportions
Case Study: Healthcare in the United States
11.1 Confidence Intervals for One Population Proportion
11.2 Hypothesis Tests for One Population Proportion
11.3 Inferences for Two Population Proportions
Chapter in Review 473, Review Problems 474, Focusing on Data Analysis 476,
Case Study Discussion 476, Biography 476
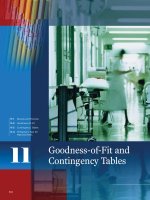
C H A P T E R 12 Chi-Square Procedures
Case Study: Eye and Hair Color
12.1 The Chi-Square Distribution
12.2 Chi-Square Goodness-of-Fit Test
12.3 Contingency Tables; Association
12.4 Chi-Square Independence Test
12.5 Chi-Square Homogeneity Test
Chapter in Review 519, Review Problems 520, Focusing on Data Analysis 523,
Case Study Discussion 523, Biography 523
C H A P T E R 13 Analysis of Variance (ANOVA)
Case Study: Partial Ceramic Crowns
13.1 The F-Distribution
340
340
341
348
354
361
372
389
389
390
396
409
422
442
442
443
455
460
478
478
479
480
490
501
511
524
524
525
x
CONTENTS
13.2 One-Way ANOVA: The Logic
13.3 One-Way ANOVA: The Procedure
Chapter in Review 547, Review Problems 547, Focusing on Data Analysis 548,
Case Study Discussion 549, Biography 549
527
533
C H A P T E R 14 Inferential Methods in Regression and Correlation
550
Case Study: Shoe Size and Height
14.1 The Regression Model; Analysis of Residuals
14.2 Inferences for the Slope of the Population Regression Line
14.3 Estimation and Prediction
14.4 Inferences in Correlation
Chapter in Review 584, Review Problems 585, Focusing on Data Analysis 587,
Case Study Discussion 587, Biography 588
550
551
562
569
578
Appendixes
A p p e n d i x A Statistical Tables
A p p e n d i x B Answers to Selected Exercises
Index
Photo Credits
WeissStats CD (brief contents)
Note: See the WeissStats CD ReadMe file for detailed contents.
Applets
Data Sets
DDXL (Excel Add-In)
Detailed t and Chi-square Tables
Focus Database
Formulas and Appendix A Tables
Further Topics in Probability
JMP Concept Discovery Modules
Minitab Macros
Technology Basics
TI Programs
A-1
A-27
I-1
C-1
Preface
Using and understanding statistics and statistical procedures have become required
skills in virtually every profession and academic discipline. The purpose of this book
is to help students master basic statistical concepts and techniques and to provide reallife opportunities for applying them.
Audience and Approach
Elementary Statistics is intended for a one-quarter or one-semester course. Instructors
can easily fit the text to the pace and depth they prefer. Introductory high school algebra
is a sufficient prerequisite.
Although mathematically and statistically sound (the author has also written books
at the senior and graduate levels), the approach does not require students to examine
complex concepts. Rather, the material is presented in a natural and intuitive way.
Simply stated, students will find this book’s presentation of introductory statistics easy
to understand.
About This Book
Elementary Statistics presents the fundamentals of statistics, featuring data production and data analysis. Data exploration is emphasized as an integral prelude to
inference.
This edition of Elementary Statistics continues the book’s tradition of being on the
cutting edge of statistical pedagogy, technology, and data analysis. It includes hundreds
of new and updated exercises with real data from journals, magazines, newspapers, and
Web sites.
The following Guidelines for Assessment and Instruction in Statistics Education
(GAISE), funded and endorsed by the American Statistical Association are supported
and adhered to in Elementary Statistics:
r Emphasize statistical literacy and develop statistical thinking.
r Use real data.
r Stress conceptual understanding rather than mere knowledge of procedures.
r Foster active learning in the classroom.
r Use technology for developing conceptual understanding and analyzing data.
r Use assessments to improve and evaluate student learning.
Changes in the Eighth Edition
The goal for this edition was to make the book even more flexible and user-friendly
(especially in the treatment of hypothesis testing), to provide modern alternatives to
some of the classic procedures, to expand the use of technology for developing understanding and analyzing data, and to refurbish the exercises. Several important revisions
are as follows.
xi
xii
PREFACE
New! New Case Studies. More than half of the chapter-opening case studies have been
replaced.
New! New and Revised Exercises. This edition contains more than 2000 high-quality exercises, which far exceeds what is found in typical introductory statistics books.
Over 25% of the exercises are new, updated, or modified. Wherever appropriate,
routine exercises with simple data have been added to allow students to practice
fundamentals.
Revised! Reorganization of Introduction to Hypothesis Testing. The introduction to hypothesis testing, found in Chapter 9, has been reworked, reorganized, and streamlined.
P-values are introduced much earlier. Users now have the option to omit the material
on critical values or omit the material on P-values, although doing the latter would
impact the use of technology.
Revised! Revision of Organizing Data Material. The presentation of organizing data, found
in Chapter 2, has been revised. The material on grouping and graphing qualitative
data is now contained in one section and that for quantitative data in another section.
In addition, the presentation and pedagogy in this chapter have been made consistent
with the other chapters by providing step-by-step procedures for performing required
statistical analyses.
New! Density Curves. A brief discussion of density curves has been included at the beginning of Chapter 6, thus providing a presentation of continuous distributions corresponding to that given in Chapter 5 for discrete distributions.
New! Plus-Four Confidence Intervals for Proportions. Plus-four confidence-interval procedures for one and two population proportions have been added, providing a more
accurate alternative to the classic normal-approximation procedures.
New! Chi-Square Homogeneity Test. A new section incorporates the chi-square homogeneity test, in addition to the existing chi-square goodness-of-fit test and chi-square
independence test.
New! Course Management Notes. New course management notes (CMN) have been produced to aid instructors in designing their courses and preparing their syllabi. The
CMN are located directly after the preface in the Instructor’s Edition of the book
and can also be accessed from the Instructor Resource Center (IRC) located at
www.pearsonhighered.com/irc.
Note: See the Technology section of this preface for a discussion of technology additions, revisions, and improvements.
Hallmark Features and Approach
Chapter-Opening Features. Each chapter begins with a general description of the
chapter, an explanation of how the chapter relates to the text as a whole, and a chapter
outline. A classic or contemporary case study highlights the real-world relevance of
the material.
End-of-Chapter Features. Each chapter ends with features that are useful for review,
summary, and further practice.
r Chapter Reviews. Each chapter review includes chapter objectives, a list of key
terms with page references, and review problems to help students review and study
the chapter. Items related to optional materials are marked with asterisks, unless the
entire chapter is optional.
PREFACE
xiii
r Focusing on Data Analysis. This feature lets students work with large data sets,
practice using technology, and discover the many methods of exploring and analyzing data. For details, refer to the Focusing on Data Analysis section on page 30 of
Chapter 1.
r Case Study Discussion. At the end of each chapter, the chapter-opening case study
is reviewed and discussed in light of the chapter’s major points, and then problems
are presented for students to solve.
r Biographical Sketches. Each chapter ends with a brief biography of a famous statistician. Besides being of general interest, these biographies teach students about the
development of the science of statistics.
Formula/Table Card. The book’s detachable formula/table card (FTC) contains most
of the formulas and many of the tables that appear in the text. The FTC is helpful
for quick-reference purposes; many instructors also find it convenient for use with
examinations.
Procedure Boxes and Procedure Index. To help students learn statistical procedures,
easy-to-follow, step-by-step methods for carrying them out have been developed. Each
step is highlighted and presented again within the illustrating example. This approach
shows how the procedure is applied and helps students master its steps. A Procedure
Index (located near the front of the book) provides a quick and easy way to find the
right procedure for performing any statistical analysis.
WeissStats CD. This PC- and Mac-compatible CD, included with every new copy of
the book, contains a wealth of resources. Its ReadMe file presents a complete contents
list. The contents in brief are presented at the end of the text Contents.
ASA/MAA–Guidelines Compliant. Elementary Statistics follows American Statistical Association (ASA) and Mathematical Association of America (MAA) guidelines,
which stress the interpretation of statistical results, the contemporary applications of
statistics, and the importance of critical thinking.
Populations, Variables, and Data. Through the book’s consistent and proper use of
the terms population, variable, and data, statistical concepts are made clearer and more
unified. This strategy is essential for the proper understanding of statistics.
Data Analysis and Exploration. Data analysis is emphasized, both for exploratory
purposes and to check assumptions required for inference. Recognizing that not all
readers have access to technology, the book provides ample opportunity to analyze
and explore data without the use of a computer or statistical calculator.
Parallel Critical-Value/P-Value Approaches. Through a parallel presentation, the
book offers complete flexibility in the coverage of the critical-value and P-value approaches to hypothesis testing. Instructors can concentrate on either approach, or they
can cover and compare both approaches. The dual procedures, which provide both the
critical-value and P-value approaches to a hypothesis-testing method, are combined
in a side-by-side, easy-to-use format.
Interpretation
Interpretations. This feature presents the meaning and significance of statistical results in everyday language and highlights the importance of interpreting answers and
results.
You Try It! This feature, which follows most examples, allows students to immediately check their understanding by asking them to work a similar exercise.
What Does It Mean? This margin feature states in “plain English” the meanings of
definitions, formulas, key facts, and some discussions—thus facilitating students’ understanding of the formal language of statistics.
xiv
PREFACE
Examples and Exercises
Real-World Examples. Every concept discussed in the text is illustrated by at least
one detailed example. Based on real-life situations, these examples are interesting as
well as illustrative.
Real-World Exercises. Constructed from an extensive variety of articles in newspapers, magazines, statistical abstracts, journals, and Web sites, the exercises provide
current, real-world applications whose sources are explicitly cited. Section exercise
sets are divided into the following three categories:
r Understanding the Concepts and Skills exercises help students master the concepts
and skills explicitly discussed in the section. These exercises can be done with or
without the use of a statistical technology, at the instructor’s discretion. At the request of users, routine exercises on statistical inferences have been added that allow
students to practice fundamentals.
r Working with Large Data Sets exercises are intended to be done with a statistical technology and let students apply and interpret the computing and statistical
capabilities of Minitab R , Excel R , the TI-83/84 Plus R , or any other statistical technology.
r Extending the Concepts and Skills exercises invite students to extend their skills
by examining material not necessarily covered in the text. These exercises include
many critical-thinking problems.
Notes: An exercise number set in cyan indicates that the exercise belongs to a group of
exercises with common instructions. Also, exercises related to optional materials are
marked with asterisks, unless the entire section is optional.
Data Sets. In most examples and many exercises, both raw data and summary statistics
are presented. This practice gives a more realistic view of statistics and lets students
solve problems by computer or statistical calculator. More than 700 data sets are included, many of which are new or updated. All data sets are available in multiple
formats on the WeissStats CD, which accompanies new copies of the book. Data sets
are also available online at www.pearsonhighered.com/neilweiss.
Technology
Parallel Presentation. The book’s technology coverage is completely flexible and
includes options for use of Minitab, Excel, and the TI-83/84 Plus. Instructors can concentrate on one technology or cover and compare two or more technologies.
Updated! The Technology Center. This in-text, statistical-technology presentation discusses
three of the most popular applications—Minitab, Excel, and the TI-83/84 Plus graphing calculators—and includes step-by-step instructions for the implementation of each
of these applications. The Technology Centers are integrated as optional material and
reflect the latest software releases.
Updated! Technology Appendixes. The appendixes for Excel, Minitab, and the TI-83/84 Plus
have been updated to correspond to the latest versions of these three statistical technologies. New to this edition is a technology appendix for SPSS R , an IBM R Company.† These appendixes introduce the four statistical technologies, explain how to
input data, and discuss how to perform other basic tasks. They are entitled Getting
Started with . . . and are located in the Technology Basics folder on the WeissStats CD.
† SPSS was acquired by IBM in October 2009.
PREFACE
xv
Computer Simulations. Computer simulations, appearing in both the text and the
exercises, serve as pedagogical aids for understanding complex concepts such as sampling distributions.
New! Interactive StatCrunch Reports. New to this edition are 54 StatCrunch Reports,
each corresponding to a statistical analysis covered in the book. These interactive reports, keyed to the book with StatCrunch icons, explain how to use StatCrunch online statistical software to solve problems previously solved by hand in the book. Go
to www.statcrunch.com, choose Explore ▼ Groups, and search “Weiss Elementary
Statistics 8/e” to access the StatCrunch Reports. Note: Accessing these reports requires
a MyStatLab or StatCrunch account.
New! Java Applets. New to this edition are 19 Java applets, custom written for Elementary
Statistics and keyed to the book with applet icons. This new feature gives students
additional interactive activities for the purpose of clarifying statistical concepts in an
interesting and fun way. The applets are available on the WeissStats CD.
Organization
Elementary Statistics offers considerable flexibility in choosing material to cover. The
following flowchart indicates different options by showing the interdependence among
chapters; the prerequisites for a given chapter consist of all chapters that have a path
that leads to that chapter.
Chapter 1
Chapter 2
Chapter 3
Chapter 4
The Nature of
Statistics
Organizing
Data
Descriptive
Measures
Descriptive
Methods
in Regression
and Correlation
Chapter 5
Chapter 6
Chapter 7
Chapter 8
Probability and
Random
Variables
The Normal
Distribution
The Sampling
Distribution of the
Sample Mean
Confidence
Intervals for One
Population Mean
Chapter 9
Hypothesis Tests
for One
Population Mean
Chapter 10
Chapter 11
Chapter 12
Chapter 14
Inferences for
Two Population
Means
Inferences for
Population
Proportions
Chi-Square
Procedures
Inferential
Methods
in Regression
and Correlation
Chapter 13
Analysis of
Variance
(ANOVA)
Optional sections can be identified by consulting the
table of contents. Instructors should refer to the
Course Management Notes for syllabus planning,
further options on coverage, and additional topics.
xvi
PREFACE
Acknowledgments
For this and the previous few editions of the book, it is our pleasure to thank the following reviewers, whose comments and suggestions resulted in significant improvements:
James Albert
Bowling Green State University
Jann-Huei Jinn
Grand Valley State University
John F. Beyers, II
University of Maryland, University
College
Thomas Kline
University of Northern Iowa
Yvonne Brown
Pima Community College
Beth Chance
California Polytechnic State
University
Brant Deppa
Winona State University
Carol DeVille
Louisiana Tech University
Jacqueline Fesq
Raritan Valley Community College
Richard Gilman
Holy Cross College
Donna Gorton
Butler Community College
Christopher Lacke
Rowan University
Sheila Lawrence
Rutgers University
Tze-San Lee
Western Illinois University
Ennis Donice McCune
Stephen F. Austin State University
Jackie Miller
The Ohio State University
Luis F. Moreno
Broome Community College
Bernard J. Morzuch
University of Massachusetts,
Amherst
Steven E. Rigdon
Southern Illinois University,
Edwardsville
Kevin M. Riordan
South Suburban College
Sharon Ross
Georgia Perimeter College
Edward Rothman
University of Michigan
George W. Schultz
St. Petersburg College
Arvind Shah
University of South Alabama
Cid Srinivasan
University of Kentucky, Lexington
W. Ed Stephens
McNeese State University
Kathy Taylor
Clackamas Community College
David Groggel
Miami University
Dennis M. O’Brien
University of Wisconsin,
La Crosse
Joel Haack
University of Northern Iowa
Dwight M. Olson
John Carroll University
Bernard Hall
Newbury College
JoAnn Paderi
Lourdes College
Jane Harvill
Baylor University
Melissa Pedone
Valencia Community College
Susan Herring
Sonoma State University
Alan Polansky
Northern Illinois University
Lance Hemlow
Raritan Valley Community College
Cathy D. Poliak
Northern Illinois University
David Holmes
The College of New Jersey
Kimberley A. Polly
Indiana University
Dawn White
California State University,
Bakersfield
Lorraine Hughes
Mississippi State University
Geetha Ramachandran
California State University
Marlene Will
Spalding University
Michael Hughes
Miami University
B. Madhu Rao
Bowling Green State University
Matthew Wood
University of Missouri, Columbia
Satish Iyengar
University of Pittsburgh
Gina F. Reed
Gainesville College
Nicholas A. Zaino Jr.
University of Rochester
Bill Vaughters
Valencia Community College
Roumen Vesselinov
University of South Carolina
Brani Vidakovic
Georgia Institute of Technology
Jackie Vogel
Austin Peay State University
Donald Waldman
University of Colorado, Boulder
Daniel Weiner
Boston University
PREFACE
xvii
Our thanks are also extended to Michael Driscoll for his help in selecting the statisticians for the biographical sketches and Fuchun Huang, Charles Kaufman, Sharon
Lohr, Richard Marchand, Kathy Prewitt, Walter Reid, and Bill Steed, with whom we
have had several illuminating discussions. Thanks also go to Matthew Hassett and
Ronald Jacobowitz for their many helpful comments and suggestions.
Several other people provided useful input and resources. They include Thomas A.
Ryan, Jr., Webster West, William Feldman, Frank Crosswhite, Lawrence W.
Harding, Jr., George McManus, Gregory Weiss, Jeanne Sholl, R. B. Campbell, Linda
Holderman, Mia Stephens, Howard Blaut, Rick Hanna, Alison Stern-Dunyak, Dale
Phibrick, Christine Sarris, and Maureen Quinn. Our sincere thanks go to all of them
for their help in making this a better book.
We express our appreciation to Larry Griffey for his formula/table card. We are
grateful to the following people for preparing the technology manuals to accompany
the book: Dennis Young (Minitab Manual), Susan Herring (TI-83/84 Plus Manual and
SPSS Manual), and Mark Dummeldinger (Excel Manual). Our gratitude also goes to
Toni Garcia for writing the Instructor’s Solutions Manual and the Student’s Solutions
Manual.
We express our appreciation to Dennis Young for his collaboration on numerous
statistical and pedagogical issues. For checking the accuracy of the entire text, we
extend our gratitude to Susan Herring. We also thank Dave Bregenzer, Mark Fridline,
Kim Polly, Gary Williams, and Mike Zwilling for their accuracy check of the answers
to the exercises.
We are also grateful to David Lund and Patricia Lee for obtaining the database
for the Focusing on Data Analysis sections. Our thanks are extended to the following
people for their research in finding myriad interesting statistical studies and data for
the examples, exercises, and case studies: Toni Garcia, Traci Gust, David Lund, Jelena
Milovanovic, and Gregory Weiss.
Many thanks go to Christine Stavrou for directing the development and construction of the WeissStats CD and the Weiss Web site and to Cindy Bowles and Carol
Weiss for constructing the data files. Our appreciation also goes to our software editors, Edward Chappell and Marty Wright.
We are grateful to Kelly Ricci of Aptara Corporation, who, along with Marianne
Stepanian, Sheila Spinney, Joanne Dill, Dana Jones Bettez, and Leah Goldberg of
Pearson Education, coordinated the development and production of the book. We also
thank our copyeditor, Philip Koplin, and our proofreaders, Cindy Bowles and Carol
Weiss.
To Barbara T. Atkinson (Pearson Education) and Rokusek Design, Inc., we express our thanks for awesome interior and cover designs. Our sincere thanks also go
to all the people at Aptara for a terrific job of composition and illustration. We thank
Regalle Jaramillo for her photo research.
Without the help of many people at Pearson Education, this book and its numerous
ancillaries would not have been possible; to all of them go our heartfelt thanks. We give
special thanks to Greg Tobin, Deirdre Lynch, Marianne Stepanian, and to the following
other people at Pearson Education: Tamela Ambush, Alex Gay, Kathleen DeChavez,
Joe Vetere, Caroline Fell, Carol Melville, Ginny Michaud, and Evelyn Beaton.
Finally, we convey our appreciation to Carol A. Weiss. Apart from writing the text,
she was involved in every aspect of development and production. Moreover, Carol did
a superb job of researching and writing the biographies.
N.A.W.
Supplements
Student Supplements
Student’s Edition
r This version of the text includes the answers to the odd-
numbered Understanding the Concepts and Skills exercises. (The Instructor’s Edition contains the answers to
all of those exercises.)
r ISBN: 0-321-69123-7 / 978-0-321-69123-1
Technology Manuals
r Excel Manual, written by Mark Dummeldinger.
ISBN: 0-321-69150-4 / 978-0-321-69150-7
r Minitab Manual, written by Dennis Young.
ISBN: 0-321-69148-2 / 978-0-321-69148-4
r TI-83/84 Plus Manual, written by Susan Herring.
ISBN: 0-321-69149-0 / 978-0-321-69149-1
r SPSS Manual, written by Susan Herring.
Available for download within MyStatLab or at
www.pearsonhighered.com/irc.
Student’s Solutions Manual
r Written by Toni Garcia, this supplement contains de-
tailed, worked-out solutions to the odd-numbered section
exercises (Understanding the Concepts and Skills, Working with Large Data Sets, and Extending the Concepts and
Skills) and all Review Problems.
r ISBN: 0-321-69141-5 / 978-0-321-69141-5
Weiss Web Site
r The Web site includes all data sets from the book in mul-
tiple file formats, the Formula/Table card, and more.
r URL: www.pearsonhighered.com/neilweiss.
Instructor Supplements
Instructor’s Edition
r This version of the text includes the answers to all of the
Understanding the Concepts and Skills exercises. (The
Student’s Edition contains the answers to only the oddnumbered ones.)
r ISBN: 0-321-69142-3 / 978-0-321-69142-2
xviii
Instructor’s Solutions Manual
r Written by Toni Garcia, this supplement contains de-
tailed, worked-out solutions to all of the section exercises
(Understanding the Concepts and Skills, Working with
Large Data Sets, and Extending the Concepts and Skills),
the Review Problems, the Focusing on Data Analysis
exercises, and the Case Study Discussion exercises.
r ISBN: 0-321-69144-X / 978-0-321-69144-6
Online Test Bank
r Written by Michael Butros, this supplement provides
three examinations for each chapter of the text.
r Answer keys are included.
r Available for download within MyStatLab or at
www.pearsonhighered.com/irc.
TestGen R
TestGen (www.pearsoned.com/testgen) enables instructors
to build, edit, print, and administer tests using a computerized bank of questions developed to cover all the objectives of the text. TestGen is algorithmically based, allowing
instructors to create multiple but equivalent versions of the
same question or test with the click of a button. Instructors
can also modify test bank questions or add new questions.
The software and testbank are available for download from
Pearson Education’s online catalog.
PowerPoint Lecture Presentation
r Classroom presentation slides are geared specifically to
the sequence of this textbook.
r These PowerPoint slides are available within MyStatLab
or at www.pearsonhighered.com/irc.
Pearson Math Adjunct Support Center
The Pearson Math Adjunct Support Center, which is located at www.pearsontutorservices.com/math-adjunct.html,
is staffed by qualified instructors with more than 100 years
of combined experience at both the community college and
university levels. Assistance is provided for faculty in the
following areas:
r Suggested syllabus consultation
r Tips on using materials packed with your book
r Book-specific content assistance
r Teaching suggestions, including advice on classroom
strategies
Technology Resources
The Student Edition of Minitab R
The Student Edition of Minitab is a condensed version of
the Professional Release of Minitab statistical software. It
offers the full range of statistical methods and graphical
capabilities, along with worksheets that can include up to
10,000 data points. Individual copies of the software can be
bundled with the text (ISBN: 978-0-321-11313-9 / 0-32111313-6) (CD ONLY).
JMP R Student Edition
JMP Student Edition is an easy-to-use, streamlined version
of JMP desktop statistical discovery software from SAS Institute Inc. and is available for bundling with the text (ISBN:
978-0-321-67212-4 / 0-321-67212-7).
IBM R SPSS R Statistics Student Version
SPSS, a statistical and data management software package,
is also available for bundling with the text (ISBN: 978-0321-67537-8 / 0-321-67537-1).
MathXL R for Statistics Online Course
(access code required)
MathXL for Statistics is a powerful online homework, tutorial, and assessment system that accompanies Pearson
textbooks in statistics. With MathXL for Statistics, instructors can:
r Create, edit, and assign online homework and tests using
algorithmically generated exercises correlated at the objective level to the textbook.
r Create and assign their own online exercises and import
TestGen tests for added flexibility.
r Maintain records of all student work, tracked in MathXL’s
online gradebook.
With MathXL for Statistics, students can:
r Take chapter tests in MathXL and receive personalized
study plans and/or personalized homework assignments
based on their test results.
r Use the study plan and/or the homework to link directly
to tutorial exercises for the objectives they need to study.
r Access supplemental animations directly from selected
exercises.
MathXL for Statistics is available to qualified adopters. For
more information, visit the Web site www.mathxl.com or
contact a Pearson representative.
MyStatLabTM Online Course
(access code required)
MyStatLab (part of the MyMathLab R and MathXL product
family) is a text-specific, easily customizable online course
that integrates interactive multimedia instruction with textbook content. MyStatLab gives instructors the tools they
need to deliver all or a portion of the course online, whether
students are in a lab or working from home. MyStatLab
provides a rich and flexible set of course materials, featuring free-response tutorial exercises for unlimited practice and mastery. Students can also use online tools, such
as animations and a multimedia textbook, to independently
improve their understanding and performance. Instructors
can use MyStatLab’s homework and test managers to select
and assign online exercises correlated directly to the textbook, as well as media related to that textbook, and they
can also create and assign their own online exercises and
import TestGen R tests for added flexibility. MyStatLab’s
online gradebook—designed specifically for mathematics
and statistics—automatically tracks students’ homework and
test results and gives instructors control over how to calculate final grades. Instructors can also add offline (paperand-pencil) grades to the gradebook. MyStatLab includes
access to StatCrunch, an online statistical software package that allows users to perform complex analyses, share
data sets, and generate compelling reports of their data.
MyStatLab also includes access to the Pearson Tutor Center (www.pearsontutorservices.com). The Tutor Center is
staffed by qualified mathematics instructors who provide
textbook-specific tutoring for students via toll-free phone,
fax, email, and interactive Web sessions. MyStatLab is available to qualified adopters. For more information, visit the
Web site www.mystatlab.com or contact a Pearson representative.
(continued )
xix
xx
Technology Resources
StatCrunch R
StatCrunch is an online statistical software Web site that
allows users to perform complex analyses, share data sets,
and generate compelling reports of their data. Developed by
Webster West, Texas A&M, StatCrunch already has more
than 12,000 data sets available for students to analyze, covering almost any topic of interest. Interactive graphics are
embedded to help users understand statistical concepts and
are available for export to enrich reports with visual representations of data. Additional features include:
r A full range of numerical and graphical methods that al-
low users to analyze and gain insights from any data set.
r Flexible upload options that allow users to work with their
.txt or Excel R files, both online and offline.
r Reporting options that help users create a wide variety of
visually appealing representations of their data.
StatCrunch is available to qualified adopters. For more information, visit the Web site www.statcrunch.com or contact a
Pearson representative.
ActivStats R
ActivStats, developed by Paul Velleman and Data Description, Inc., is an award-winning multimedia introduction to statistics and a comprehensive learning tool that
works in conjunction with the book. It complements this
text with interactive features such as videos of realworld stories, teaching applets, and animated expositions
of major statistics topics. It also contains tutorials for
learning a variety of statistics software, including Data
Desk, R Excel, JMP, Minitab, and SPSS. ActivStats, ISBN:
978-0-321-50014-4 / 0-321-50014-8. For additional information, contact a Pearson representative or visit the Web site
www.pearsonhighered.com/activstats.
Data Sources
A Handbook of Small Data Sets
A. C. Nielsen Company
AAA Daily Fuel Gauge Report
AAA Foundation for Traffic Safety
AAMC Faculty Roster
AAUP Annual Report on the Economic
Status of the Profession
ABC Global Kids Study
ABCNEWS Poll
ABCNews.com
Academic Libraries
Accident Facts
ACT High School Profile Report
ACT, Inc.
Acta Opthalmologica
Advances in Cancer Research
AHA Hospital Statistics
Air Travel Consumer Report
Alcohol Consumption and Related
Problems: Alcohol and Health
Monograph 1
All About Diabetes
Alzheimer’s Care Quarterly
American Association of University
Professors
American Automobile Manufacturers
Association
American Bar Foundation
American Community Survey
American Council of Life Insurers
American Demographics
American Diabetes Association
American Elasmobranch Society
American Express Retail Index
American Film Institute
American Hospital Association
American Housing Survey for the United
States
American Industrial Hygiene Association
Journal
American Journal of Clinical
Nutrition
American Journal of Obstetrics and
Gynecology
American Journal of Political Science
American Laboratory
American Medical Association
American Psychiatric Association
American Scientist
American Statistical Association
American Wedding Study
America’s Families and Living
Arrangements
America’s Network Telecom Investor
Supplement
Amstat News
Amusement Business
An Aging World: 2001
Analytical Chemistry
Analytical Services Division Transport
Statistics
Aneki.com
Animal Behaviour
Annals of Epidemiology
Annals of Internal Medicine
Annals of the Association of American
Geographers
Appetite
Aquaculture
Arbitron Inc.
Archives of Physical Medicine and
Rehabilitation
Arizona Chapter of the American Lung
Association
Arizona Department of Revenue
Arizona Republic
Arizona Residential Property Valuation
System
Arizona State University
Arizona State University Enrollment
Summary
Arthritis Today
Asian Import
Associated Press
Associated Press/Yahoo News
Association of American Medical Colleges
Auckland University of Technology
Australian Journal of Rural Health
Auto Trader
Avis Rent-A-Car
BARRON’S
Beer Institute
Beer Institute Annual Report
Behavior Research Center
Behavioral Ecology and Sociobiology
Behavioral Risk Factor Surveillance System
Summary Prevalence Report
Bell Systems Technical Journal
Biological Conservation
Biomaterials
Biometrics
Biometrika
BioScience
Board of Governors of the Federal Reserve
System
Boston Athletic Association
Boston Globe
Boyce Thompson Southwestern Arboretum
Brewer’s Almanac
Bride’s Magazine
British Journal of Educational Psychology
British Journal of Haematology
British Medical Journal
Brittain Associates
Brokerage Report
Bureau of Crime Statistics and Research of
Australia
Bureau of Economic Analysis
Bureau of Justice Statistics
Bureau of Justice Statistics Special Report
Bureau of Labor Statistics
Bureau of Transportation Statistics
Business Times
Cable News Network
California Agriculture
California Nurses Association
California Wild: Natural Sciences for
Thinking Animals
Carnegie Mellon University
Cellular Telecommunications & Internet
Association
Census of Agriculture
Centers for Disease Control and Prevention
Central Intelligence Agency
Chance
Characteristics of New Housing
Chatham College
Chesapeake Biological Laboratory
Climates of the World
Climatography of the United States
CNBC
CNN/Opinion Research Corporation
CNN/USA TODAY
CNN/USA TODAY/ Gallup Poll
CNNMoney.com
CNNPolitics.com
Coleman & Associates, Inc.
College Bound Seniors
College Entrance Examination Board
College of Public Programs at Arizona State
University
Comerica Auto Affordability Index
Comerica Bank
xxi
xxii
DATA SOURCES
Communications Industry Forecast & Report
Comparative Climatic Data
Compendium of Federal Justice Statistics
Conde Nast Bridal Group
Congressional Directory
Conservation Biology
Consumer Expenditure Survey
Consumer Profile
Consumer Reports
Contributions to Boyce Thompson Institute
Controlling Road Rage: A Literature Review
and Pilot Study
Crime in the United States
Current Housing Reports
Current Population Reports
Current Population Survey
CyberStats
Daily Racing Form
Dallas Mavericks Roster
Data from the National Health Interview
Survey
Dave Leip’s Atlas of U.S. Presidential
Elections
Deep Sea Research Part I: Oceanographic
Research Papers
Demographic Profiles
Demography
Department of Information Resources and
Communications
Department of Obstetrics and Gynecology at
the University of New Mexico Health
Sciences Center
Desert Samaritan Hospital
Diet for a New America
Dietary Guidelines for Americans
Dietary Reference Intakes
Digest of Education Statistics
Directions Research Inc.
Discover
Dow Jones & Company
Dow Jones Industrial Average Historical
Performance
Early Medieval Europe
Ecology
Economic Development Corporation Report
Economics and Statistics Administration
Edinburgh Medical and Surgical Journal
Education Research Service
Educational Research
Educational Resource Service
Educational Testing Service
Election Center 2008
Employment and Earnings
Energy Information Administration
Environmental Geology Journal
Environmental Pollution (Series A)
Equilar Inc.
ESPN
Europe-Asia Studies
Everyday Health Network
Experimental Agriculture
Family Planning Perspectives
Fatality Analysis Reporting System (FARS)
Federal Bureau of Investigation
Federal Bureau of Prisons
Federal Communications Commission
Federal Election Commission
Federal Highway Administration
Federal Reserve System
Federation of State Medical Boards
Financial Planning
Florida Department of Environmental
Protection
Florida Museum of Natural History
Florida State Center for Health Statistics
Food Consumption, Prices, and
Expenditures
Food Marketing Institute
Footwear News
Forbes
Forest Mensuration
Forrester Research
Fortune Magazine
Fuel Economy Guide
Gallup, Inc.
Gallup Poll
Geography
Georgia State University
giants.com
Global Financial Data
Global Source Marketing
Golf Digest
Golf Laboratories, Inc.
Governors’ Political Affiliations & Terms of
Office
Graduating Student and Alumni Survey
Handbook of Biological Statistics
Hanna Properties
Harris Interactive
Harris Poll
Harvard University
Health, United States
High Speed Services for Internet
Access
Higher Education Research Institute
Highway Statistics
Hilton Hotels Corporation
Hirslanden Clinic
Historical Income Tables
HIV/AIDS Surveillance Report
Hospital Statistics
Human Biology
Hydrobiologia
Indiana University School of Medicine
Industry Research
Information Please Almanac
Information Today, Inc.
Injury Prevention
Inside MS
Institute of Medicine of the National
Academy of Sciences
Internal Revenue Service
International Classifications of Diseases
International Communications Research
International Data Base
International Shark Attack File
International Waterpower & Dam
Construction Handbook
Interpreting Your GRE Scores
Iowa Agriculture Experiment Station
Japan Automobile Manufacturer’s
Association
Japan Statistics Bureau
Japan’s Motor Vehicle Statistics, Total
Exports by Year
JiWire, Inc.
Joint Committee on Printing
Journal of Abnormal Psychology
Journal of Advertising Research
Journal of American College Health
Journal of Anatomy
Journal of Applied Ecology
Journal of Bone and Joint Surgery
Journal of Chemical Ecology
Journal of Chronic Diseases
Journal of Clinical Endocrinology &
Metabolism
Journal of Clinical Oncology
Journal of College Science Teaching
Journal of Dentistry
Journal of Early Adolescence
Journal of Environmental Psychology
Journal of Environmental Science and
Health
Journal of Family Violence
Journal of Geography
Journal of Herpetology
Journal of Human Evolution
Journal of Nutrition
Journal of Organizational Behavior
Journal of Paleontology
Journal of Pediatrics
Journal of Prosthetic Dentistry
Journal of Real Estate and Economics
Journal of Statistics Education
Journal of Sustainable Tourism
Journal of the American College of
Cardiology
Journal of the American Geriatrics Society
Journal of the American Medical
Association
Journal of the American Public Health
Association
Journal of the Royal Statistical Society
Journal of Tropical Ecology
Journal of Zoology, London
Kansas City Star
Kelley Blue Book
Land Economics
Lawlink
Le Moyne College’s Center for Peace and
Global Studies
Leonard Martin Movie Guide
Life Insurers Fact Book
Literary Digest
Los Angeles Dodgers
Los Angeles Times
losangeles.dodgers.mlb.com
Main Economic Indicators
DATA SOURCES
Major League Baseball
Manufactured Housing Statistics
Marine Ecology Progress Series
Mediamark Research, Inc.
Median Sales Price of Existing
Single-Family Homes for Metropolitan
Areas
Medical Biology and Etruscan Origins
Medical College of Wisconsin Eye Institute
Medical Principles and Practice
Merck Manual
Minitab Inc.
Mohan Meakin Breweries Ltd.
Money Stock Measures
Monitoring the Future
Monthly Labor Review
Monthly Tornado Statistics
Morbidity and Mortality Weekly Report
Morrison Planetarium
Motor Vehicle Facts and Figures
Motor Vehicle Manufacturers Association of
the United States
National Aeronautics and Space
Administration
National Association of Colleges and
Employers
National Association of Realtors
National Association of State Racing
Commissioners
National Basketball Association
National Cancer Institute
National Center for Education Statistics
National Center for Health Statistics
National Collegiate Athletic Association
National Corrections Reporting Program
National Football League
National Geographic
National Geographic Traveler
National Governors Association
National Health and Nutrition Examination
Survey
National Health Interview Survey
National Highway Traffic Safety
Administration
National Household Survey on Drug Abuse
National Household Travel Survey, Summary
of Travel Trends
National Institute of Aging
National Institute of Child Health and
Human Development Neonatal Research
Network
National Institute of Mental Health
National Institute on Drug Abuse
National Low Income Housing Coalition
National Mortgage News
National Nurses Organizing Committee
National Oceanic and Atmospheric
Administration
National Safety Council
National Science Foundation
National Sporting Goods Association
National Survey of Salaries and Wages in
Public Schools
National Survey on Drug Use and Health
National Transportation Statistics
National Vital Statistics Reports
Nature
NCAA.com
New Car Ratings and Review
New England Journal of Medicine
New England Patriots Roster
New Scientist
New York Giants
New York Times
New York Times/CBS News
News
News Generation, Inc.
Newsweek
Newsweek, Inc
Nielsen Company
Nielsen Media Research
Nielsen Ratings
Nielsen Report on Television
Nielsen’s Three Screen Report
NOAA Technical Memorandum
Nutrition
Obstetrics & Gynecology
OECD Health Data
OECD in Figures
Office of Aviation Enforcement and
Proceedings
Official Presidential General Election
Results
Oil-price.net
O’Neil Associates
Opinion Dynamics Poll
Opinion Research Corporation
Organization for Economic Cooperation and
Development
Origin of Species
Osteoporosis International
Out of Reach
Parade Magazine
Payless ShoeSource
Pediatrics Journal
Pew Forum on Religion and Public Life
Pew Internet & American Life
Philadelphia Phillies
phillies.mlb.com
Philosophical Magazine
Phoenix Gazette
Physician Characteristics and Distribution
in the US
Physician Specialty Data
Plant Disease, An International Journal of
Applied Plant Pathology
PLOS Biology
Pollstar
Popular Mechanics
Population-at-Risk Rates and Selected
Crime Indicators
Preventative Medicine
pricewatch.com
Prison Statistics
Proceedings of the 6th Berkeley Symposium
on Mathematics and Statistics, VI
xxiii
Proceedings of the National Academy of
Science
Proceedings of the Royal Society of London
Profile of Jail Inmates
Psychology of Addictive Behaviors
Public Citizen Health Research Group
Public Citizen’s Health Research Group
Newsletter
Quality Engineering
Quinnipiac University Poll
R. R. Bowker Company
Radio Facts and Figures
Reader’s Digest/Gallup Survey
Recording Industry Association of America,
Inc
Regional Markets, Vol. 2/Households
Research Quarterly for Exercise and Sport
Research Resources, Inc.
Residential Energy Consumption Survey:
Consumption and Expenditures
Response Insurance
Richard’s Heating and Cooling
Robson Communities, Inc.
Roper Starch Worldwide, Inc.
Rubber Age
Runner’s World
Salary Survey
Scarborough Research
Schulman Ronca & Bucuvalas Public Affairs
Science
Science and Engineering Indicators
Science News
Scientific American
Scientific Computing & Automation
Scottish Executive
Semi-annual Wireless Survey
Sexually Transmitted Disease Surveillance
Signs of Progress
Snell, Perry and Associates
Social Forces
Sourcebook of Criminal Justice Statistics
South Carolina Budget and Control Board
South Carolina Statistical Abstract
Sports Illustrated
SportsCenturyRetrospective
Stanford Revision of the Binet–Simon
Intelligence Scale
Statistical Abstract of the United States
Statistical Report
Statistical Summary of Students and Staff
Statistical Yearbook
Statistics Norway
Statistics of Income, Individual Income Tax
Returns
Stockholm Transit District
Storm Prediction Center
Substance Abuse and Mental Health
Services Administration
Survey of Consumer Finances
Survey of Current Business
Survey of Graduate Science Engineering
Students and Postdoctorates
TalkBack Live
xxiv
DATA SOURCES
Tampa Bay Rays
tampabay.rays.mlb.com
Teaching Issues and Experiments in
Ecology
Technometrics
TELENATION/Market Facts, Inc.
Television Bureau of Advertising, Inc.
Tempe Daily News
Texas Comptroller of Public Accounts
The AMATYC Review
The American Freshman
The American Statistician
The Bowker Annual Library and Book Trade
Almanac
The Business Journal
The Design and Analysis of Factorial
Experiments
The Detection of Psychiatric Illness by
Questionnaire
The Earth: Structure, Composition and
Evolution
The Economic Journal
The History of Statistics
The Journal of Arachnology
The Lancet
The Lawyer Statistical Report
The Lobster Almanac
The Marathon: Physiological, Medical,
Epidemiological, and Psychological
Studies
The Methods of Statistics
The Open University
The Washington Post
Thoroughbred Times
Time Spent Viewing
Time Style and Design
TIMS
TNS Intersearch
Today in the Sky
TopTenReviews, Inc.
Toyota
Trade & Environment Database (TED) Case
Studies
Travel + Leisure Golf
Trends in Television
Tropical Biodiversity
U.S. Agricultural Trade Update
U.S. Air Force Academy
U.S. Census Bureau
U.S. Citizenship and Immigration Services
U.S. Coast Guard
U.S. Congress, Joint Committee on
Printing
U.S. Department of Agriculture
U.S. Department of Commerce
U.S. Department of Education
U.S. Department of Energy
U.S. Department of Health and Human
Services
U.S. Department of Housing and Urban
Development
U.S. Department of Justice
U.S. Energy Information Administration
U.S. Environmental Protection Agency
U.S. Geological Survey
U.S. News & World Report
U.S. Postal Service
U.S. Public Health Service
U.S. Religious Landscape Survey
U.S. Women’s Open
Universal Sports
University of Colorado Health Sciences
Center
University of Delaware
University of Helsinki
University of Malaysia
University of Maryland
University of Nevada, Las Vegas
University of New Mexico Health Sciences
Center
Urban Studies
USA TODAY
USA TODAY Online
USA TODAY/Gallup
Utah Behavioral Risk Factor Surveillance
System (BRFSS) Local Health District
Report
Utah Department of Health
Vegetarian Journal
Vegetarian Resource Group
VentureOne Corporation
Veronis Suhler Stevenson
Vital and Health Statistics
Vital Statistics of the United States
Wall Street Journal
Washington University School of Medicine
Weekly Retail Gasoline and Diesel Prices
Western Journal of Medicine
Wichita Eagle
Wikipedia
Women and Cardiovascular Disease
Hospitalizations
Women Physicians Congress
Women’s Health Initiative
WONDER database
World Almanac
World Factbook
World Series Overview
Year-End Shipment Statistics
Zogby International
Zogby International Poll