2016 agent mineral update
Bạn đang xem bản rút gọn của tài liệu. Xem và tải ngay bản đầy đủ của tài liệu tại đây (1.49 MB, 33 trang )
Mineral Supplementation
of the Cow Herd
Dr. Jeff Lehmkuhler
Extension Beef Cattle Specialist
University of Kentucky
Is she copper deficient?
Need more than White Salt
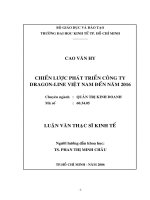
ADG of Steers Grazing in Flint Hills Kansas
1.9
1.8
1.7
1.6
1.5
1.4
1.3
White Salt
Mineral
Min/Promin
Barnhardt et al., 2007 KS Beef Report
Hypocalcemia (Milk Fever)
• Normal blood Ca 8.5-10 mg/dL
• Affect 5% of US Dairy Cows
• Subclinical (5.5-8 mg/dL) in 50%
of older dairy cows
•
Reduces rumen motility
• Abomasal displacement
•
Reduces muscle contractions
• Teat Sphincter = Mastitis
•
Impairs immune cell responsiveness
Source: J.P. Goff 2008 The Vet Journal
Hypocalcemia (Milk Fever)
•
Parathyroid Hormone (PTH) binds to receptor in presence of Mg
• cAMP - bone Ca resorption & renal
1,25-dihydroxyvitamin D production
•
Alkalosis disrupts binding site
• High cation intake (K, Na, Ca, Mg)
• Lowers blood H+, higher pH
•
Hypomagnesemia limits cAMP production
Source: J.P. Goff 2008 The Vet Journal
Hypomagnesemia (Grass Tetany)
• Normal blood Mg 1.8-2.4 mg/dL
• Clinical 0.9-1.15 mg/dL
• Blood <0.65 mg/dL Mg increases risk
of milk fever
•
Trans-aconitic acid forms tricarballylate in rumen complexing Mg lowering
absorption
•
Active transport when low [Mg]
• High [K] reduces absorption
• Foregut (rumen) is main site of
absorption
• Dependent on rumen fluid [Mg]
•
Passive transport requires 4x higher rumen [ ] than blood
• Close-up diet [Mg] 0.35-0.4%
• Solubility of Mg reduced in high
rumen pH (>6.5)
Source: J.P. Goff 2008 The Vet Journal
PEM – Brainers & Sulfur Toxicity
• PEM damage to grey matter
• Thiamine def, Pb, Water
deprivation, & Sulfur
•
Sulfur toxicity issues sub-clinical
• Reduced DMI, ADG, Rumen
motility
• Binds Cu reducing absorption
• Lowers Se digestibility
• Dietary Sulfur Max
• 0.3% grain-based
• Inhibits Se incorporation into
enzymes
• 0.5% forage-based
• Reduces Mn & Cu retention
• Water less than 600 mg/L
sulfate
• Oxidative stress lowering immune
function
Source: Drewnoski et al., 2014 JAS
Inhalation of H2S leads to PEM
Source: Drewnoski et al., 2014 JAS
Sulfur Sources
• Water – springs
• Forages – generally not excessively high
• Can see accumulation in some forages when sulfate fertilizers used
• Feeds / Supplements
• Molasses
• Corn Coproducts – Corn Gluten & Distillers products
• Condensed Solubles, Syrup, Fermentation Extracts
Calcium – Cheap and Problematic
• Calcium
• Higher in Legumes than grasses
• Short in Ca for corn-based diets = includes Corn coproduct
feeds (DDGS, CGF, etc…)
• Stocker mineral will not work for finishing cattle
• Need an additional 0.75-1% added limestone
Urinary Calculi
• Primarily see:
• Struvite, Silica & Magnesium, Phosphorus, Calcium Carbonate uroliths
• Struvite – magnesium ammonium phosphate
• Bladder bacteria cleave ammonia from urea – raises urine pH
• High urine pH leads to formation of mineralized compound (stone)
• Primarily seen in cattle on high grain rations & Abrupt Water
Restriction
Stone Prevention Through Diet
Manipulation
• Dietary Ca:P ratio near 2:1
• Corn, Corn Gluten Feed, Distillers Grains, Syrup, etc… High in P, low in Ca
• Stocker mineral too low in Ca
• Acidify urine by adding ammonium chloride (common in sheep diet)
• Not palatable, Will reduce intake if not mixed thoroughly (0.5-1% DM)
• Add 1-2% salt (DM basis) to encourage urination
• Ensure ample water access
• Avoid Excessive Mg & P
Micro Requirements vs. Fescue
(ppm or mg/kg)
Req
Fescue*
Cu
10
6
Se
.1-.3
.06
Zn
30
19
Mn
40
119
Co
.1
.2
Fe
50
100
*CHAPA, 1996
Mineral Availability from Forage
%
Ca
50-68
Forage Test = 10 ppm
Mg
10-45
Req’t = 10 ppm
P
65-70
Cu
5-15
Se
28-32
Absorbed = 1.5 ppm
Fe
30-70
Deficient = 8.5 ppm
Mn
3-4
Avail, % = 15%
Intake free-choice mineral
120
100
80
Target intake
60
40
20
0
t
Aug-Sep
July-Aug
ly
June-Ju
e
May-Jun
ay
April-M
ril
Mar- Ap
r
Feb-Ma
Jan-Feb
Dec-Jan
c
Nov-De
Oct-Nov
t
Sept-Oc
t
Aug-Sep
Mix
Patterson et al., 2013 Biol Trace Element Res
Takes Time to Replenish Stores
Reproduction Revisited
From: Ferguson and Sklan. Ed. Pfeffer & Hristov, 2006
Authors Conclude: “…dietary P does not seem to have a
major impact on reproduction until dietary
concentrations are below 0.10%.”
Forage P Levels
P, %
Min
Mean
Max
Tennessee
0.13
0.36
0.55
West Virginia
0.10
0.34
0.59
Wisconsin
0.08
0.25
0.48
Kentucky
0.11
0.29
0.57
• On average, Forage [P] exceed requirement: ~ 0.25% of DM
• 3-4% Phos Mineral OK & Lower Cost
• BUT several samples below & require supplementation
Phosphorus Levels in KY Hay ‘09
Forage Phos, % for KY Hay Samples ‘09
% Phos
0.6
0.5
0.4
0.3
0.2
0.1
0
1,300 lb Cow 20 lb Peak, 23 lb DMI
67% = or Above Req’t
UK IRM Mineral
Based on 0.23% P
Key Minerals
• Copper
• Selenium
• Zinc
•
Others Important
•
Complete mineral product
•
Monitor Intake
• Magnesium
• Calcium
• Salt
Importance in Fertility
• Multiple minerals known to be involved in
reproduction / fertility
• Phosphorus, Copper (Cu), Selenium (Se)
• Deficiency & Excessive Intakes can be problematic
• Argue that TRACE mineral more frequently
deficient in Southeast (Cu, Se, Zn)
Potential Impact on Male Fertility
Proof Minerals Important for
Male Fertility?
• 1951 Thomas & Moss fed Molybdenum and found no
spermatogenesis & testes damage
• 2014 Rowe et al. fed observed ~ 10% improvement for
motile sperm numbers w/ ORGANIC trace mineral
feeding
• 2014 Reis et al. fed diets with 540, 1300, 3800 or 6300
ppm of Mn - > 540 ppm reduced sperm integrity
Selenium & Spermatogenesis
SEPP1
ApoER2
SEPP1
+ Se
Boitani & Puglisi, 2009
Phospholipid Hydroperoxide
Glutathione Peroxidase (PHGPx)
Testosterone
PHGPx
Selenium
PHGPx
Reduce Oxidative Stress
Structural Protein Sperm Midpiece
Sperm chromatin condensation
Boitani & Puglisi, 2009