Removal of phenol from aqueous solutions by adsorption onto organomodified
Bạn đang xem bản rút gọn của tài liệu. Xem và tải ngay bản đầy đủ của tài liệu tại đây (1.12 MB, 10 trang )
Journal of Hazardous Materials 172 (2009) 353–362
Contents lists available at ScienceDirect
Journal of Hazardous Materials
journal homepage: www.elsevier.com/locate/jhazmat
Removal of phenol from aqueous solutions by adsorption onto organomodified
Tirebolu bentonite: Equilibrium, kinetic and thermodynamic study
Hasan Basri Senturk a , Duygu Ozdes a , Ali Gundogdu a , Celal Duran a , Mustafa Soylak b,∗
a
b
Department of Chemistry, Karadeniz Technical University, Faculty of Arts & Sciences, 61080 Trabzon, Turkey
Department of Chemistry, Erciyes University, Faculty of Arts & Sciences, 38039 Kayseri, Turkey
a r t i c l e
i n f o
Article history:
Received 23 April 2009
Received in revised form 26 June 2009
Accepted 3 July 2009
Available online 14 July 2009
Keywords:
Removal
Phenol
Adsorption
Organobentonite
Cetyl trimethylammonium bromide
Spectrophotometric determination
a b s t r a c t
A natural bentonite modified with a cationic surfactant, cetyl trimethylammonium bromide (CTAB),
was used as an adsorbent for removal of phenol from aqueous solutions. The natural and modified bentonites (organobentonite) were characterized with some instrumental techniques (FTIR, XRD
and SEM). Adsorption studies were performed in a batch system, and the effects of various experimental parameters such as solution pH, contact time, initial phenol concentration, organobentonite
concentration, and temperature, etc. were evaluated upon the phenol adsorption onto organobentonite. Maximum phenol removal was observed at pH 9.0. Equilibrium was attained after contact
of 1 h only. The adsorption isotherms were described by Langmuir and Freundlich isotherm models, and both model fitted well. The monolayer adsorption capacity of organobentonite was found to
be 333 mg g−1 . Desorption of phenol from the loaded adsorbent was achieved by using 20% acetone
solution. The kinetic studies indicated that the adsorption process was best described by the pseudosecond-order kinetics (R2 > 0.99). Thermodynamic parameters including the Gibbs free energy ( G◦ ),
enthalpy ( H◦ ), and entropy ( S◦ ) were also calculated. These parameters indicated that adsorption
of phenol onto organobentonite was feasible, spontaneous and exothermic in the temperature range of
0–40 ◦ C.
© 2009 Elsevier B.V. All rights reserved.
1. Introduction
As a result of rapid development of chemical and petrochemical
industries, the surface and ground waters are polluted by various organic and inorganic chemicals such as phenolic compounds,
dyes and heavy metals. Phenol and its derivatives are considered
as noxious pollutants, because they are toxic and harmful to living organisms even at low concentrations [1]. Phenols are being
discharged into the waters from various industrial processes such
as oil refineries, petrochemical plants, ceramic plants, coal conversion processes and phenolic resin industries [2]. The utilization of
phenol-contaminated waters causes protein degeneration, tissue
erosion, paralysis of the central nervous system and also damages
the kidney, liver and pancreas in human bodies [3]. According to the
recommendation of World Health Organization (WHO), the permissible concentration of phenolic contents in potable waters is
1 g L−1 [4] and the regulations by the Environmental Protection
Agency (EPA), call for lowering phenol content in wastewaters less
than 1 mg L−1 [5]. Therefore, removal of phenols from waters and
∗ Corresponding author. Tel.: +90 352 4374933; fax: +90 352 4374933.
E-mail addresses: , (M. Soylak).
0304-3894/$ – see front matter © 2009 Elsevier B.V. All rights reserved.
doi:10.1016/j.jhazmat.2009.07.019
wastewaters is an important issue in order to protect public health
and environment.
The traditional methods such as adsorption, chemical oxidation,
precipitation, distillation, solvent extraction, ion exchange, membrane processes, and reverse osmosis, etc. have been widely used
for removal of phenols from aqueous solutions [6]. Among them,
removal of phenols by adsorption is the most powerful separation and purification method because this technique has significant
advantages including high efficiency, easy handling, high selectivity, lower operating cost, easy regeneration of adsorbent, and
minimized the production of chemical or biological sludge [7].
Adsorption process is strongly affected by the chemistry and surface
morphology of the adsorbent. Therefore, new adsorbents, which are
economical, easily available, having strong affinity and high loading
capacity have been required. A number of adsorbents such as activated carbon, [8], red mud [9] and rubber seed coat [10], etc. have
been used for phenol removal. Adsorption of phenol onto activated
carbons is a well-known process because activated carbon has a
large surface area and high adsorption capacity. However, its high
cost and the difficulties in recovering of activated carbon particles
from treated water, limit its use as an adsorbent. In recent years,
clay minerals have been widely used as adsorbents for the removal
of toxic metals and organic pollutants from aqueous solutions due
354
H.B. Senturk et al. / Journal of Hazardous Materials 172 (2009) 353–362
to their low cost, large specific surface area, chemical and mechanical stability, layered structure and high cation exchange capacity
[2,11–19].
Bentonite is a member of 2:1 clay minerals (meaning that
it has two tetrahedral sheets sandwiching a central octahedral
sheet) which consists essentially of clay minerals of montmorillonite group. Bentonite is characterized by an Al octahedral sheet
between two Si tetrahedral sheets. It has a negative surface charge
created by the isomorphous substitution of Al3+ for Si4+ in tetrahedral layer and Mg2+ for Al3+ in octahedral layer. The bentonite
surface is hydrophilic in nature because inorganic cations, such
as Na+ and Ca2+ , are strongly hydrated in presence of water. As a
result, the adsorption efficiency of natural bentonite for organic
molecules is very low [20,21]. The adsorption properties of bentonite can be improved by the modification of clay mineral surface
with a cationic surfactant. The cationic surfactants, known as quaternary amine salts, are in the form of (CH3 )3 NR+ , where R is an alkyl
hydrocarbon chain. Replacement of inorganic exchangeable cations
with cationic surfactants, converts the hydrophilic silicate surface
of clay minerals to a hydrophobic surface and the obtained complex
is referred as organoclay. It is generally accepted that adsorption of
hydrophilic long-chain quaternary ammonium cations onto clays
occurs according to the ion-exchange mechanism [22]. As a result
organoclay complex is an excellent adsorbent for the removal of
phenolic compounds, other organic contaminants and also heavy
metals from aqueous solutions.
The objective of this study was to investigate the adsorption
potential of bentonite for removal of phenol from aqueous solutions. The natural bentonite was obtained from Tirebolu-Giresun
region of Turkey, and modified with a cationic surfactant, cetyl
trimethylammonium bromide (CTAB), in order to increase the
adsorption capacity. The structures of natural and organobentonite
were characterized by using a variety of instrumental techniques
including Fourier transform infrared (FTIR) spectroscopy, X-ray
diffraction (XRD) and scanning electron microscopy (SEM). Also the
surface area, cation exchange capacity and pH of the bentonite samples were estimated. The effects of experimental parameters such as
initial pH of the solution, contact time, initial phenol concentration,
organobentonite concentration, etc. were studied. The adsorption
mechanisms of phenol onto organobentonite were evaluated in
terms of thermodynamics and kinetics. The adsorption isotherms
were described by using Langmuir and Freundlich isotherm
models.
2. Materials and methods
2.1. Preparation of organobentonite
The bentonite, which is a type of clay mineral, was used as an
adsorbent for removal of phenol from aqueous solutions in the
present study. Ca–bentonite samples were sieved to 0.15 mm of
particle size before use. A known amount of Ca–bentonite was
added to 1 M of Na2 CO3 solution and stirred for 3 h at 800 rpm.
In order to dissolve the CaCO3 , the concentrated HCl solution was
added into the suspension drop-by-drop. The solid particles were
separated from the mixture by filtration using Whatmann No. 42
filter paper and washed five times with deionized water until it
was chloride free. This was checked by the addition of AgNO3
after washing with deionized water to make sure that no precipitate is formed, which is the evidence of chloride existence.
And then the obtained solid was dried at 110 ◦ C for one day and
designated as Na–bentonite. The Na–bentonite was modified with
a cationic surfactant, cetyl trimethylammonium bromide (CTAB),
CH3 (CH2 )15 N+ (CH3 )3 Br− . The cationic surfactant can be adsorbed
onto negatively charged clay surfaces and is not influenced by
the pH of the solution because it is a quaternary ammonium salt
[23]. The CTAB consists of a 16-carbon chain tail group attached
to a trimethyl quaternary amine head group with a permanent +1
charge. For modification process: 200 mL of 4% of CTAB solution
was contacted with 20 g Na–bentonite by stirring on a mechanical shaker for 24 h. Then the bentonite was separated from the
solution by filtration and washed twice with deionized water and
then dried at 70 ◦ C. This bentonite is designated as organobentonite
(CH3 (CH2 )15 N+ (CH3 )3 –Al2 O3 4SiO2 H2 O) [24].
2.2. Characterization
The physical and chemical characteristics of the adsorbents
are important in order to estimate the adsorbate binding mechanism of the adsorbent surface. Hence the structures of natural and
organobentonite were characterized by using several techniques
including FTIR Spectroscopy, XRD and SEM. Also the surface area,
cation exchange capacity (CEC) and pH of the bentonite samples
were estimated by using several analytical methods.
The IR spectra of the natural bentonite, organobentonite and
phenol loaded organobentonite were obtained to determine the
surface functional groups by using PerkinElmer 1600 FTIR spectrophotometer in the range of 4000–400 cm−1 .
The mineralogical compositions of the natural and organobentonite samples were determined from the XRD patterns of the
samples taken on a Rigaku D–Max III automated diffractometer
using Ni filtered Cu K␣ radiation.
SEM analyses were applied on the natural bentonite, organobentonite and also phenol loaded organobentonite by JSM 6400
Scanning Microscope apparatus in order to disclose the surface
texture and morphology of the adsorbent.
The surface areas of the natural and organobentonite were calculated according to Sears’ method [25] as follows: 0.5 g of clay
sample was mixed with 50 mL of 0.1 M HCl solution and 10.0 g of
NaCl salt. The mixture had a pH value of 3.0, and titrated with standard 0.1 M NaOH solution in a thermostatic bath at 298 ± 0.5 K from
pH 4.0 to 9.0. The surface area was calculated from the following
equation:
S(m2 /g) = 32V − 25
(1)
where S is the surface area, and V is the volume (mL) of NaOH
solution required to raise the pH from 4.0 to 9.0.
The CEC of the natural bentonite was calculated by using
bisethylenediamine copper (II) ([Cu(en)2 ]2+ ) complex method
[26,27] 50 mL of 1 M copper(II) chloride (CuCl2 ) solution was mixed
with 102 mL of 1 M ethylenediamine (C2 H8 N2 ) solution. The slight
excess of the amine ensures complete formation of the complex.
The solution was diluted with deionized water to 1 L to give a 0.05 M
solution of the complex. 0.5 g of a dry clay sample was mixed with
5 mL of the complex solution in a 100 mL flask, diluted with deionized water to 25 mL and the mixture was shaken for 30 min in a
thermostatic water bath and then centrifuged. The concentration
of the complex remaining in the supernatant was determined by
iodometric method. For this, 5 mL of the supernatant was mixed
with 5 mL of 0.1 M HCl solution to destroy the [Cu(en)2 ]2+ complex
and about 1 g of KI salt was added to this solution. The mixture was
titrated with 0.02 M Na2 S2 O3 solution with starch as indicator. The
CEC was calculated from the following formula:
CEC(meg/100 g) =
MSV (x − y)
1000m
(2)
where M is the molar mass of Cu-complex, S is the concentration of
thio solution, V is the volume (mL) of complex taken for iodometric
titration, m is the mass of adsorbent (g) taken, x is the volume (mL)
of Na2 S2 O3 solution required for blank titration (without adding the
adsorbent) and y is the volume (mL) of Na2 S2 O3 solution required
for the titration (with the clay adsorbent).
H.B. Senturk et al. / Journal of Hazardous Materials 172 (2009) 353–362
355
The pH values of the natural and organobentonite were measured as follows: 0.1 g of samples was mixed with 10 mL of
deionized water and shaken for 24 h at 30 ◦ C. After filtration, the
pH of solutions was determined by a pH meter.
2.3. Adsorption experiments
All chemicals used in this work were of analytical reagent
grade and were used without further purification. Deionized water
was used for all dilutions. All glassware and plastics were soaked
in 10% (v/v) nitric acid solution for one day before use, and
then cleaned repeatedly with deionized water. A stock solution
of 5000 mg L−1 phenol was prepared by dissolving 5.00 g of phenol (Merck, Darmstadt, Germany) in 1 L of deionized water. The
required concentration of phenol solutions were prepared by diluting the appropriate volumes of the stock solution. The pH of the
solutions was adjusted to 9.0 by addition of 0.1 M HCl or 0.1 M
NaOH solutions. The adsorption of phenol onto organobentonite
was investigated through a batch process. For adsorption experiments, 10 mL of phenol solution in the concentration range of
100–1000 mg L−1 was transferred into a polyethylene centrifuge
tube. Then 100 mg of organobentonite (10 g L−1 suspension) was
added to the solution, and then the mixture was agitated on a
mechanical shaker (Edmund Bühler GmbH) at 400 rpm for 1.0 h.
After reaching equilibrium, the suspension was filtered through
0.45 m of nitrocellulose membrane (Sartorius Stedim Biotech.
GmbH), and the filtrate was analyzed for residual phenol concentration using a double beam UV–vis spectrophotometer (Unicam
UV-2) at 508 nm by the 4-aminoantipyrene method [28]. All experiments were conducted in triplicate, and the averages of the
results were submitted for data analysis. The amount of the phenol adsorbed by the organobentonite was calculated as following
equation:
Removal (%) =
qe =
Co − Ce
× 100
Co
Co − Ce
ms
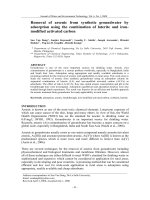
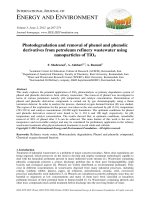
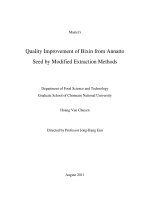
Fig. 1. FTIR spectra of (a) natural bentonite, (b) organobentonite and (c) phenol
loaded organobentonite.
(3)
(4)
Co (mg L−1 ) is the initial concentration of phenol solution, Ce
(mg L−1 ) is the equilibrium concentration of phenol in aqueous
solution, and ms (g L−1 ) is the organobentonite concentration; qe
(mg g−1 ) is amount of calculated phenol adsorption onto 1.0 g of
organobentonite.
3. Results and discussion
3.1. Characterization
The chemical composition of bentonite has been defined as:
66.2% SiO2 , 13.7% Al2 O3 , 1.4% Fe2 O3 , 3.0% MgO, 1.7% CaO, 0.4% Na2 O,
0.7% K2 O, 0.2% TiO2 , 0.1% MnO, and 12.0% loss of ignition by using
Inductively Coupled Plasma Atomic Emission Spectrometric (ICPAES) method [29].
The FTIR spectra of natural bentonite, organobentonite and phenol loaded organobentonite are depicted in Fig. 1(a), (b) and (c)
respectively, in order to compare the differences among three kinds
of bentonite. The broad bands observed at 3400–3600 cm−1 are
due to the O–H stretching vibration of the silanol (Si–OH) groups
and HO–H vibration of the water adsorbed silica surface [30]. Also
the adsorption band near 1640 cm−1 is due to the H–O–H bending vibration, and the broad band near 1000 cm−1 is related to the
stretch vibrations of Si–O groups. For organobentonite, two peaks
appear at 2920–2850 cm−1 which represent the stretching vibration of –CH3 and –CH2 , respectively, and the band near 1460 cm−1 is
related to the –CH2 deformation peak [31]. These peaks support the
modification of bentonite with CTAB. Also it is important to notice
that the band intensities decreased in the FTIR spectrum of phenol
loaded organobentonite because the functional groups, especially
those of CTAB, of the organobentonite surface have been occupied
with phenol.
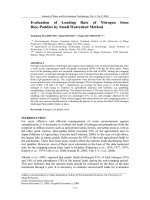
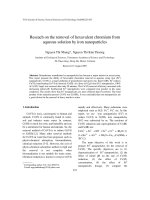
The XRD patterns of organobentonite and natural bentonite
are shown in Fig. 2(a) and (b), respectively. XRD measurements
have shown that the natural bentonite is mainly composed of
saponite, halloysite, palygorskite and muscovite. On the other hand
the organobentonite is composed of illite, nacrite and montmorillonite. From the results, modification of bentonite minerals by an
organic compound introduces some changes into the crystal structure of bentonite minerals.
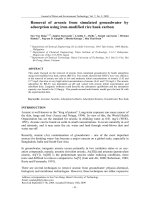
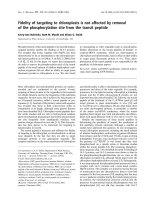
The SEM micrographs of natural bentonite, organobentonite and
phenol loaded organobentonite are shown in Fig. 3(a)–(c). The
surface morphology of bentonite changed slightly by the modification with CTAB. The organabentonite has considerable numbers
of heterogeneous pores where there is a good possibility for phenol
trapped and adsorbed. The structure of organobentonite changed
upon phenol adsorption and exhibited a tendency to form agglomerates.
The surface area of natural bentonite changed from 32.6
to 26.2 m2 g−1 after the modification resulting in organobentonite. The CEC of the natural bentonite was found to be
33.0 meg/100 g. The pH of the natural bentonite and organobentonite was determined as 7.10 and 6.45, respectively, indicating
that the natural bentonite has negative charge in aqueous solution
and the level of surface negative charges decreases by modification.
356
H.B. Senturk et al. / Journal of Hazardous Materials 172 (2009) 353–362
Fig. 2. XRD spectrum of (a) organobentonite and (b) natural bentonite.
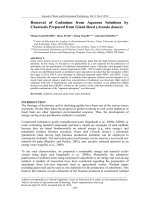
3.2. Effect of pH
The surface charge of the adsorbent and the ionization degree of
the adsorbate are strongly affected by the pH of the aqueous solutions, hence the uptake of phenol by the adsorbent depends on the
solution pH. In order to evaluate the effect of pH on the adsorption of phenol onto organobentonite, the adsorption experiments
were carried out with initial phenol concentration of 110 mg L−1 and
organobentonite concentration of 10 g L−1 by varying the pH of the
solutions over a range of 1–11 (Fig. 4). The uptake of phenol by the
organobentonite is almost constant in the pH range of 1–9. However
when the pH value exceeds 9, the adsorption of phenol decreases
abruptly. Phenol as a weak acid compound with pKa value of 9.8
is dissociated at pH > pKa [32]. At higher pH values, the ionization
degree of phenol and the quantity of OH– ions increase thereby the
diffusion of phenolic ions are hindered, and the electrostatic repulsion between the negatively charged surface sites of the adsorbent
and phenolat ions increases. As a result, the removal of phenol is
greater at lower pH compared to the higher pH. Similar results were
reported by Nayak and Singh [33]. From the experimental results,
pH 9.0 was selected as an optimum pH value.
3.3. Effect of contact time and adsorption kinetics
The adsorption of phenol onto organobentonite was studied as a
function of contact time in order to decide whether the equilibrium
was reached. For this, 100 mg L−1 of phenol solutions at pH 9.0 were
contacted with 10 g L−1 of organobentonite suspensions. The sam-
Fig. 3. SEM of (a) natural bentonite, (b) organobentonite and (c) phenol loaded
organobentonite (magnification: 500 folds).
ples were taken at different periods of time and analyzed for their
phenol concentration (Fig. 5(a)). The phenol adsorption rate is high
at the beginning of the experiment because initially the adsorption sites are more available and phenol ions are easily adsorbed
on these sites. The equilibrium can be reached within 60 min, and
thus, further adsorption experiments were carried out for a contact
time of 60 min. The adsorption kinetics is one the most important
data in order to understand the mechanism of the adsorption and to
H.B. Senturk et al. / Journal of Hazardous Materials 172 (2009) 353–362
357
The pseudo-first-order equation can be written as follows [34]:
ln(qe − qt ) = ln qe − k1 t
(mg g−1 )
(5)
(mg g−1 )
where qe
and qt
are the amounts of phenol
adsorbed at equilibrium and at time t, respectively, k1 (min−1 ) is the
pseudo-first-order rate constant. A straight line of ln(qe − qt ) versus
t suggests the applicability of this kinetic model, and qe and k1 can
be determined from the intercept and slope of the plot, respectively.
The pseudo-second-order model is in the following form [35]:
1
t
t
=
+
qt
qe
k2 q2e
(6)
where k2 (g mg−1 min−1 ) is the rate constant of the second-order
equation. The plot of t/qt versus t should give a straight line if
pseudo-second-order kinetic model is applicable and qe and k2 can
be determined from slope and intercept of the plot, respectively.
The intraparticle diffusion equation is expressed as [36]:
qt = kid t 1/2 + c
Fig. 4. Effect of pH on phenol uptake by organobentonite (initial phenol conc.:
110 mg L−1 , organobentonite conc.: 10 g L−1 , contact time: 60 min).
assess the performance of the adsorbents. Different kinetic models
including the pseudo-first-order, pseudo-second-order and intraparticle diffusion models were applied for the experimental data to
predict the adsorption kinetics.
(mg g−1
(7)
min−1/2 )
where kid
is the rate constant of intraparticle diffusion model. The values of kid and c can be determined from the
slope and intercept of the straight line of qt versus t1/2 , respectively.
For evaluating the kinetics of phenol–organobentonite interactions, the pseudo-first-order, pseudo-second-order and intraparticle diffusion models were used to fit the experimental data. The
pseudo-first-order rate constant k1 and the value of qe cal were
calculated from the plot of ln(qe − qt ) versus t, and the results are
given in Table 1. The correlation coefficient (R2 ) is relatively too
low which may be indicative of a bad correlation. In addition, qe cal
determined from the model is not in a good agreement with the
experimental value of qe exp . Therefore, the adsorption of phenol
onto organobentonite is not suitable for the first-order reaction.
From Table 1, the value of c obtained from intraparticle diffusion
model is not zero, and the correlation coefficient is not satisfactory
thereby intraparticle diffusion may not be the controlling factor in
determining the kinetics of the process. The linear plot of t/qt versus
t for the pseudo-second-order kinetic model is shown in Fig. 5(b).
The pseudo-second-order rate constant k2 and the value of qe cal
were determined from the model and the results are presented in
Table 1. The value of correlation coefficient is very high (R2 > 0.999)
and the calculated qe cal value is closer to the experimental qe exp
value. In the view of these results, the pseudo-second-order kinetic
model provided a good correlation for the adsorption of phenol onto
organobentonite in contrast to the pseudo-first-order and intraparticle diffusion model.
3.4. Effect of initial phenol concentration and adsorption
isotherms
Adsorption isotherms are useful for understanding the mechanism of the adsorption. Although several isotherm equations are
available due to their simplicity, two well-known models, Langmuir
and Freundlich isotherm models were chosen in this study for evaluating the relationship between the amount of phenol adsorbed
onto organobentonite and its equilibrium concentration in aqueous
solution.
The Langmuir model assumes that adsorption takes place at
specific homogeneous sites on the surface of the adsorbent and
also, when a site is occupied by an adsorbate molecule, no further adsorption can take place at this site. The linear form of the
Langmuir isotherm model can be presented as [37]:
Ce
Ce
1
=
+
qe
qmax
bqmax
Fig. 5. (a) Effect of contact time on phenol uptake and (b) pseudo-second-order
kinetic model (pH: 9.0, initial phenol conc.: 100 mg L−1 , organobentonite conc.:
10 g L−1 ).
(8)
where qe (mg g−1 ) is the amount of the phenol adsorbed per unit
mass of adsorbent, Ce (mg L−1 ) is the equilibrium phenol concentra-
358
H.B. Senturk et al. / Journal of Hazardous Materials 172 (2009) 353–362
Table 1
Parameters of pseudo-first-order, pseudo-second-order and intraparticle diffusion models.
Exp. qe (mg g−1 )
Pseudo-first-order
−1
k1 (min
−0.0128
5.96
)
qe (mg g
1.01
Pseudo-second-order
−1
)
2
R
k2 (g mg
0.7426
0.116
−1
min
1
1 + bCo
(9)
where Co (mg L−1 ) is the initial amount of adsorbate and b (L mg−1 )
is the Langmuir constant described above. The RL parameter is considered as more reliable indicator of the adsorption. There are four
probabilities for the RL value:
•
•
•
•
)
Intraparticle diffusion
qe (mg g
5.97
tion in the solution, qmax (mg g−1 ) is the Langmuir constant related
to the maximum monolayer adsorption capacity, and b (L mg−1 ) is
the constant related the free energy or net enthalpy of adsorption.
The linear plot of Ce /qe versus Ce indicates that adsorption obeys the
Langmuir model, and the constants qmax and b are obtained from
the slope and intercept of the linear plot, respectively.
The essential features of the Langmuir isotherm model can be
expressed in terms of ‘RL ’ a dimensionless constant, separation factor or equilibrium parameter, which is defined by the following
equation [38]:
RL =
−1
for favorable adsorption 0 < RL < 1,
for unfavorable adsorption RL > 1,
for linear adsorption RL = 1 and
for irreversible adsorption RL = 0.
−1
)
R
kid (mg g−1 min−1 )
C (mg g−1 )
R2
0.9999
0.158
3.505
0.4049
2
phenol concentration and approached zero with increase in the Co
value, indicated that the organobentonite is a suitable adsorbent
for adsorption of phenol from aqueous solutions. The values of Freundlich constants, Kf and 1/n were obtained from the linear plot of
ln qe versus ln Ce (Fig. 6(b)) and found to be 0.099 and 0.946 respectively, with correlation coefficient (R2 ) of 0.999. The Freundlich
constant 1/n was smaller than unity indicated that the adsorption
process was favorable under studied conditions. From the results,
the adsorption pattern of phenol onto organobentonite was well fitted with both Langmuir and Freundlich isotherm model. This may
be due to both homogeneous and heterogeneous distribution of
active sites on the surface of the organobentonite.
3.5. Effect of organobentonite concentration
The effects of organobentonite concentration on the removal
of phenol from aqueous solutions were investigated by using
seven different organobentonite concentrations in the range of
1–25 g L−1 and initial phenol concentration of 110 mg L−1 at pH
The Freundlich isotherm model is valid for multilayer adsorption
on a heterogeneous adsorbent surface with sites that have different
energies of adsorption. The Freundlich model in linear form [39]:
ln qe = ln Kf +
1
ln Ce
n
(10)
where Kf (mg g−1 ) is the constant related to the adsorption capacity
and n is the empirical parameter related to the intensity of adsorption. The value of n varies with the heterogeneity of the adsorbent
and for favorable adsorption process the value of n should be less
than 10 and higher than unity. The values of Kf and 1/n are determined from the intercept and slope of linear plot of ln qe versus
ln Ce , respectively.
In order to investigate the effect of initial phenol concentration on the adsorption process, the experiments were carried out
with initial phenol concentration in the range of 100–1000 mg L−1
at constant values of pH (9.0), organobentonite concentration
(10 g L−1 ) and contact time (60 min). After reaching equilibrium,
the phenol concentration in filtrate for each system was measured
by UV–vis spectrometry. The equilibrium concentration of phenol
increased from 4.8 to 45.0 mg g−1 in the light of the results whereas
adsorption percentage decreased from 48% to 4.5% with increasing
the initial phenol concentration from 100 to 1000 mg L−1 . The initial phenol concentration acts as a driving force to overcome mass
transfer resistance for phenol transport between the solution and
the surface of the organobentonite. On the other hand, at higher
concentrations, phenol present in solution cannot interact with the
active binding sites of the organobentonite due to the saturation of
these sites [40].
The equilibrium data obtained from the adsorption of phenol
onto organobentonite were fitted both the Langmuir and Freundlich isotherm models. The values of Langmuir constants, qmax
and b obtained from the equation of linear plot of Ce /qe versus
Ce (Fig. 6(a)) were found to be 333.0 mg g−1 and 2.4 × 10⁻⁴ L mg−1
respectively, with correlation coefficient (R2 ) of 0.992. The RL values
ranged from 0.820 to 0.978 between 100 and 1000 mg L−1 of initial
Fig. 6. (a) Langmuir isotherm model and (b) Freundlich isotherm model.
H.B. Senturk et al. / Journal of Hazardous Materials 172 (2009) 353–362
359
Fig. 7. Effect of organobentonite concentration on phenol uptake (pH: 9.0, initial
phenol conc.: 110 mg L−1 , contact time: 60 min).
9.0. As the organobentonite concentration was increased from 1
to 25 g L−1 , the equilibrium adsorption capacity of organobentonite
(qe ), decreased from 6.0 to 2.6 mg g−1 , whereas, the phenol removal
efficiency increased from 5.5% to 58.5% (Fig. 7). The increase in
adsorption percentage of phenol was probably due to the increased
more availability of active adsorption sites with the increase in
organobentonite concentration [40]. The decrease in equilibrium
adsorption capacity of organobentonite for phenol uptake could
be attributed to two reasons. First, the organobentonite particles
aggregated with increasing the adsorbent concentration hence total
surface area of the adsorbent decreased and diffusion path length
of phenol increased. Secondly, the increase in organobentonite concentration at constant concentration and volume of phenol lead to
unsaturation adsorption sites [41], so the equilibrium adsorption
capacity of organobentonite decreased.
3.6. Effect of temperature and thermodynamic parameters of
adsorption
The effect of temperature on the removal efficiency was investigated in the temperature range of 0–40 ◦ C. In order to control the
temperature of the solutions, a cryostat (Nüve BD 402, temperature range: −10 to +40 ◦ C) was used for all thermodynamic studies.
The experiments were carried out with organobentonite concentration of 10 g L−1 and initial phenol concentration of 105 mg L−1
at pH 9.0. The uptake of phenol by organobentonite decreased
from 6.2 mg g−1 (59% removal) to 5.2 mg g−1 (49.5% removal) when
increasing the temperature from 0 to 40 ◦ C, indicating that phenol
uptake was favored at lower temperatures (Fig. 8(a)). The decrease
in adsorption with the rise of temperature may be due to the weakening of adsorptive forces between the active sites of the adsorbent
and adsorbate species and also between the vicinal molecules of the
adsorbed phase [42–44]. Similar results were obtained by Hameed
[45] with adsorption of 2,4,6-trichlorophenol by activated clay.
The feasibility of the adsorption process was evaluated by the
thermodynamic parameters including free energy change ( G◦ ),
enthalpy ( H◦ ), and entropy ( S◦ ). G◦ was calculated from the
following equation:
G◦ = −RT ln Kd
(11)
where R is the universal gas constant (8.314 J mol−1 K−1 ), T is the
temperature (K), and Kd is the distribution coefficient. The Kd value
was calculated using following equation:
qe
Kd =
Ce
(12)
where qe and Ce are the equilibrium concentration of phenol on
adsorbent (mg L−1 ) and in the solution (mg L−1 ), respectively. The
Fig. 8. (a) Effect of temperature on phenol uptake and (b) the plot between ln Kd versus 1/T for obtaining the thermodynamic parameters (pH: 9.0, initial phenol conc.:
105 mg L−1 , organobentonite conc.: 10 g L−1 , contact time: 60 min).
enthalpy change ( H◦ ), and entropy change ( S◦ ) of adsorption
were estimated from the following equation:
G◦ =
H ◦ − T S◦
(13)
This equation can be written as:
ln Kd =
S◦
H◦
−
R
RT
(14)
The thermodynamic parameters of H◦ and S◦ were obtained
from the slope and intercept of the plot between ln Kd versus 1/T,
respectively (Fig. 8(b)). The values of G◦ , H◦ , and S◦ for the
adsorption of phenol onto organobentonite at different temperatures are given in Table 2. The negative values of G◦ in the
temperature range of 0–30 ◦ C indicated that the adsorption process
was feasible and spontaneous. In addition, the decrease in the magnitude of G◦ to higher temperatures showed the diminishing of
the spontaneous of the process so the adsorption was not favorable
at higher temperatures. The negative value of H◦ confirmed the
exothermic nature of adsorption which was also supported by the
Table 2
Thermodynamic parameters of the phenol adsorption onto organobentonite at different temperatures.
T (◦ C)
0
10
20
30
40
a
G◦ (kJ mol−1 )
−0.83
−0.59
−0.37
−0.19
0.05
Measured between 273 and 313 K.
S◦ (J mol−1 K−1 )a
−21.57
H◦ (kJ mol−1 )a
−6.70
360
H.B. Senturk et al. / Journal of Hazardous Materials 172 (2009) 353–362
Fig. 9. Effect of ionic strength on the phenol uptake (pH: 9.0, initial phenol conc.:
110 mg L−1 , organobentonite conc.: 10 g L−1 , contact time: 60 min).
decrease in value of phenol uptake with the rise in temperature.
The negative value of S◦ suggested the decreased randomness
at the solid/liquid interface during the adsorption of phenol onto
organobentonite.
Fig. 10. Reuse of the organobentonite without regeneration (pH: 9.0, initial phenol
conc.: 105 mg L−1 , organobentonite conc.: 10 g L−1 , contact time: 60 min).
tity of phenol uptake decreased compared to the first three cycles.
From the results, already used organobentonite can be applied to
fresh phenol solutions and can be used at least five times without
regeneration. Similar results were reported in the literatures [46].
3.9. Desorption of phenol
3.7. Effect of ionic strength
Industrial wastewaters and natural waters contain many types
of electrolyte that have significant effects on the adsorption process so it is important to evaluate the effects of ionic strength on
the removal of phenol from aqueous solutions. In present study,
NaCl, NaNO3 and Na2 SO4 were selected as model salts to investigate
their influence on the adsorption of phenol onto organobentonite.
Adsorption studies were carried out by adding various concentrations (in the range of 0.01–0.20 M) of NaCl, Na2 SO4 and NaNO3
solutions individually, in 110 mg L−1 of phenol solutions containing
10 g L−1 of organobentonite. The present adsorption process was
applied to these solutions. The increase in the salt concentration
resulted in a decrease of phenol adsorption onto organobentonite
(Fig. 9). As the concentration of salts increased from 0 to 0.20 M,
the amount of phenol uptake decreased from 4.9 to 4.75, 4.45 and
2.4 mg g−1 and the percentage removal efficiency decreased from
44.5% to 43.2%, 44.5% and 21.8% for NaCl, Na2 SO4 and NaNO3 salts,
respectively. These results can be explained: the active sites of the
adsorbent may be blocked in the presence of these salts so phenol molecules are hindered to bind the surface of the adsorbent.
And also the decrease in adsorption with increased ionic strength
may be due to the decrease in hydrophobic nature of the dissociated phenol molecules at pH 9.0. From the results, the NaNO3 salt
exhibited a higher inhibition of phenol adsorption compared to the
NaCl and Na2 SO4 salts.
It is very important to regenerate the spent adsorbent for keeping the adsorption process costs down [47–49]. Regeneration of
organobentonite can be succeeded by washing the phenol loaded
organobentonite with a suitable desorbing solution that must be
cheap, effective, non-polluting and non-damaging to the adsorbent.
For this, desorption of phenol from loaded organobentonite was
carried out with deionized water at pH 2.0, 0.1 M of NaOH, 20% acetone, and 20% ethanol solutions, individually. First step: 10 g L−1
of organobentonite suspension was equilibrated with 10 mL of
100 mg L−1 initial phenol solution at pH 9.0. After reaching the equilibrium, the organobentonite was separated by filtration then the
equilibrium concentration of phenol in the filtrate was determined
by UV–vis spectrometry. Second step: phenol loaded organobentonite was washed with deionized water for three times, and then
dried in air for one day. The loaded adsorbent was treated 10 mL
of deionized water at pH 2.0, 0.1 M of NaOH, 20% acetone and
20% ethanol solutions, individually by agitating at 400 rpm for
60 min.
Among the desorbing solutions used in the present study, 20%
acetone solution was identified as the best eluent because of its
3.8. Applicability of the organobentonite without regeneration
The organobentonite was tested for its reusability without
regeneration. The tests were performed by using an initial phenol
concentration of 105 mg L−1 at pH 9.0 with 10 g L−1 of organobentonite suspension. After shaking for 60 min, the phenol loaded
organobentonite was separated, dried in air for one day, and then
treated with another 105 mg L−1 phenol solution. The process was
repeated for five times. The largest amount of phenol adsorbed
(56.2% removal) was with fresh organobentonite (first cycle), and
each its subsequent loading the adsorption capacity of organobentonite was decreased (Fig. 10). After cycles 4 and 5, the newly
adsorbed amount of phenols were 2.5 mg g−1 (23.8% removal) and
1.7 mg g−1 (16.2% removal), respectively indicated that the quan-
Fig. 11. Desorption of phenols by different desorbing agents.
H.B. Senturk et al. / Journal of Hazardous Materials 172 (2009) 353–362
96.6% desorption efficiency. On the other hand 20% ethanol solution, deionized water at pH 2.0 and 0.1 M of NaOH solution has
90.0%, 56.7%, 49.3% desorption efficiencies, respectively (Fig. 11).
4. Conclusions
The clay minerals are one of the most promising adsorbent
due to their low cost, easy availability, high specific surface area,
and chemical and mechanical stability. A member of clay minerals,
the natural bentonite which was obtained from Tirebolu-Giresun
region of Turkey, was modified with CTAB in order to increase its
adsorption capacity, and used as an adsorbent for removal of phenol
from aqueous solutions.
After the natural bentonite, organobentonite and phenol loaded
bentonite were characterized with the FTIR spectroscopy, XRD
and SEM, the phenol removal performance of the organobentonite
which exhibited higher adsorption capacity was investigated in the
light of equilibrium, kinetics and thermodynamics parameters.
The maximum phenol removal was achieved at pH 9.0. The
kinetic studies indicated that the adsorption process was extremely
fast (equilibrium time is 60 min). The kinetics of phenol adsorption onto organobentonite followed by pseudo-second-order
model. When the organobentonite concentration was increased,
the equilibrium adsorption capacity (mg g−1 ) of organobentonite
decreased, whereas the percent removal efficiency increased. The
straight lines obtained for the Langmuir and Freundlich isotherm
models obey to fit to the experimental equilibrium data indicating
that disclosing of heterogeneous and homogeneous distribution in
the active sites on the surface. The monolayer adsorption capacity of organobentonite was found to be 333 mg g−1 from Langmuir
model equations. The adsorption of phenol onto organobentonite
decreased when increasing the temperature. The negative G◦ values indicated that the adsorption of phenol onto organobentonite
was feasible and spontaneous. The negative value of H◦ confirmed
the exothermic nature of adsorption. The negative value of S◦
suggested the decreased randomness at the solid/liquid interface
during the adsorption of phenol onto organobentonite. As the concentration of NaCl, Na2 SO4 and NaNO3 salts increased, the amount
of phenol uptake decreased. The organobentonite can be used at
least five times for further adsorption process without regeneration. For desorption of phenol, 20% acetone solution was considered
as the best desorbing solution.
The experimental results indicated that the organobentonite can
be successfully used for removal of phenol from aqueous solutions.
The present adsorption system using modified bentonite may be
considered as a replacement strategy for existing conventional systems.
Acknowledgements
Authors wish to thank Unit of Scientific Research Project of
Karadeniz Technical University Project no: 2004.111.002.1 for financially supporting this research. Authors are also thankful Mr.
I˙ brahim Alp for providing the clay minerals.
References
[1] F.A. Banat, V. Al-Bashir, S. Al-Asheh, O. Hayajneh, Adsorption of phenol by bentonite, Environ. Pollut. 107 (2000) 391–398.
[2] J. Huang, X. Wang, Q. Jin, Y. Liu, Y. Wang, Removal of phenol from aqueous
solution by adsorption onto OTMAC-modified attapulgite, J. Environ. Manage.
84 (2007) 229–236.
[3] A. Knop, L.A. Pilato, Phenolic Resins-Chemistry. Applications and Performance,
Springer-Verlag, 1985.
[4] WHO (World Health Organization), Guidelines for Drinking Water Quality (vol.
II): Health Criteria and Supporting Information, World Health Organization,
Geneva, Switzerland, 1984.
361
[5] N.N. Dutta, S. Brothakur, R. Baruaha, A novel process for recovery of phenol
from alkaline wastewater: laboratory study and predesign cost estimate, Water
Environ. Res. 70 (1998) 4–9.
[6] G. Buscaa, S. Berardinelli, C. Resini, L. Arrighi, Technologies for the removal of
phenol from fluid streams: a short review of recent developments, J. Hazard.
Mater. 160 (2008) 265–288.
[7] N. Ahalya, T.V. Ramachandra, R.D. Kanamadi, Biosorption of heavy metals, Res.
J. Chem. Environ. 7 (2003) 71–78.
[8] S. Mukherjee, S. Kumar, A.K. Misra, M. Fan, Removal of phenols from water
environment by activated carbon, bagasse ash and wood charcoal, Chem. Eng.
J. 129 (2007) 133–142.
[9] A. Tor, Y. Cengeloglu, M.E. Aydin, M. Ersoz, Removal of phenol from aqueous phase by using neutralized red mud, J. Colloid Interface Sci. 300 (2006)
498–503.
[10] S. Rengaraj, S. Moon, R. Sivabalan, B. Arabindoo, V. Murugesan, Removal of phenol from aqueous solution and resin manufacturing industry wastewater using
an agricultural waste: rubber seed coat, J. Hazard. Mater. 89 (2002) 185–196.
[11] K.G. Bhattacharyya, S.S. Gupta, Adsorption of a few heavy metals on natural
and modified kaolinite and montmorillonite: a review, Adv. Colloid Interface
Sci. 140 (2008) 114–131.
[12] A. Aworn, P. Thiravetyan, W. Nakbanpote, Preparation of CO2 activated carbon
from corncob for monoethylene glycol adsorption, Colloids Surf. 333A (2009)
19–25.
[13] S.B. Choi, J.K. Park, Metal recovery by aged beads prepared using cell-suspension
from the waste of beer fermentation broth, Korean J. Chem. Eng. 26 (2009)
457–461.
[14] E. Eren, Removal of lead ions by Unye (Turkey) bentonite in iron, magnesium
oxide-coated forms, J. Hazard. Mater. 165 (2009) 63–70.
[15] C. Fei, C. Hongzhang, Absorption of ethanol by steam-exploded corn stalk, Bioresour. Technol. 100 (2009) 1315–1318.
[16] C. Quintelas, Z. Rocha, B. Silva, B. Fonseca, B.H. Figueiredo, T. Tavares, Removal of
Cd(II), Cr(VI), Fe(III), Ni(II) from aqueous solutions by an E. coli biofilm supported
on kaolin, Chem. Eng. J. 149 (2009) 319–324.
[17] G. Sheng, S. Wang, J. Hu, Y. Lu, J. Li, Y. Dong, X. Wang, Adsorption of Pb(II) on
diatomite as affected via aqueous solution chemistry and temperature, Colloid
Surf. 339A (2009) 159–166.
[18] J. Wang, F. Xu, W.-J. Xie, Z.-J. Mei, Q.-Z. Zhang, W.-M. Cai, The enhanced adsorption of dibenzothiophene onto cerium/nickel-exchanged zeolite Y, J. Hazard.
Mater. 163 (2009) 538–543.
[19] S. Wang, Y. Dong, M. He, L. Chen, X. Yu, Characterization of GMZ bentonite and
its application in the adsorption of Pb(II) from aqueous solutions, Appl. Clay
Sci. 43 (2009) 164–171.
[20] N. Yilmaz, H. Yilmaz, S. Yapar, Removal of phenol using TDTAB- and HDTABbentonites, Energy Sources 29 (2007) 67–77.
[21] Q. Zhou, H.P. He, J.X. Zhu, W. Shen, R.L. Frost, P. Yuan, Mechanism
of p-nitrophenol adsorption from aqueous solution by HDTMA+ -pillared
montmorillonite—implications for water purification, J. Hazard. Mater. 154
(2008) 1025–1032.
[22] T.S. Anirudhan, M. Ramachandran, Adsorptive removal of tannin from aqueous
solutions by cationic surfactant-modified bentonite clay, J. Colloid Interface Sci.
299 (2006) 116–124.
[23] Z. Rawajfih, N. Nsour, Characteristics of phenol and chlorinated phenols sorption onto surfactant-modified bentonite, J. Colloid Interface Sci. 298 (2006)
39–49.
[24] S. Al-Asheh, F. Banat, L. Abu-Aitah, Adsorption of phenol using different types
of activated bentonites, Sep. Purif. Technol. 33 (2003) 1–10.
[25] G. Sears, Determination of specific surface area of colloidal silica by titration
with sodium hydroxide, Anal. Chem. 28 (1956) 1981–1983.
[26] F. Bergaya, M. Vayer, CEC of clays: measurement by adsorption of a copper
ethylenediamine complex, Appl. Clay Sci. 12 (1997) 275–280.
[27] K.G. Bhattacharyya, S.S. Gupta, Influence of acid activation on adsorption of
Ni(II) and Cu(II) on kaolinite and montmorillonite: kinetic and thermodynamic
study, Chem. Eng. J. 136 (2008) 1–13.
[28] A.E. Greenberg, L.S. Clesceri, A.D. Eaton (Eds.), Standard Methods for the Examination of Water and Wastewater, 17th ed., American Public Health Association
(APHA), Washington, DC, 1989.
[29] E. Abdioglu, M. Arslan, H. Kolayli, S. Kadir, Tirebolu (Giresun) bentonitlerinin
jeolojik, mineralojik ve jeokimyasal özellikleri, in: 12. National Clay Symposium, September 5–9, Van, Turkey, 2005, pp. 80–100 (in Turkish).
[30] A. Sari, M. Tuzen, M. Soylak, Adsorption of Pb(II) and Cr(III) from aqueous solution on Celtek clay, J. Hazard. Mater. 144 (2007) 41–46.
[31] E. Eren, Removal of copper ions by modified Unye clay, Turkey, J. Hazard. Mater.
159 (2008) 235–244.
[32] N. Thinakaran, P. Baskaralingam, M. Pulikesi, P. Panneerselvam, S. Sivanesan,
Removal of acid Violet 17 from aqueous solutions by adsorption onto activated carbon prepared from sunflower seed hull, J. Hazard. Mater. 151 (2008)
316–322.
[33] P.S. Nayak, B.K. Singh, Removal of phenol from aqueous solutions by sorption
on low cost clay, Desalination 207 (2007) 71–79.
[34] S. Lagergren, About the theory of so-called adsorption of soluble substance,
Kung Sven, Veten. Hand 24 (1898) 1–39.
[35] Y.S. Ho, G. McKay, Kinetic models for the sorption of dye from aqueous solution
by wood, J. Environ. Sci. Health Part B: Process Saf. Environ. Prot. 76 (1998)
183–191.
[36] W.J. Weber Jr., J.C. Morriss, Kinetics of adsorption on carbon from solution, J.
Sanitary Eng. Div. Am. Soc. Civ. Eng. 89 (1963) 31–60.
362
H.B. Senturk et al. / Journal of Hazardous Materials 172 (2009) 353–362
[37] I. Langmuir, The adsorption of gases on plane surfaces of glass, mica and platinum, J. Am. Chem. Soc. 40 (1918) 1361–1403.
[38] K.R. Hall, L.C. Eagleton, A. Acrivos, T. Vermeulen, Pore- and solid-diffusion kinetics in fixed-bed adsorption under constant-pattern conditions, Ind. Eng. Chem.
Fundam. 5 (1966) 212–223.
[39] H.M.F. Freundlich, Über die adsorption in lösungen, Z. Phys. Chem. 57 (1906)
385–470.
[40] V.C. Srivastava, M.M. Swamy, I.D. Mall, B. Prasad, I.M. Mishra, Adsorptive
removal of phenol by bagasse fly ash and activated carbon: equilibrium, kinetics
and thermodynamics, Colloids Surf. A 272 (2006) 89–104.
[41] Y. Huang, X. Ma, G. Liang, H. Yan, Adsorption of phenol with modified rectorite
from aqueous solution, Chem. Eng. J. 141 (2008) 1–8.
[42] K.K. Panday, G. Prasad, V.N. Singh, Use of wallastonite for the treatment of Cu(II)
rich effluents, Water Air Soil Pollut. 27 (1986) 287–296.
[43] H.-J. Park, C.-K. Na, Adsorption characteristics of anionic nutrients onto the PPg-AA-Am non-woven fabric prepared by photoinduced graft and subsequent
chemical modification, J. Hazard. Mater. 166 (2009) 1201–1209.
[44] J.P. Mota, S. Lyubchik, Recent Advances in Adsorption Processes for Environmental Protection and Security, Springer, New York, 2008.
[45] B.H. Hameed, Equilibrium and kinetics studies of 2,4,6-trichlorophenol adsorption onto activated clay, Colloid Surf. A: Physicochem. Eng. Aspects 307 (2007)
45–52.
[46] D. Ozdes, A. Gundogdu, B. Kemer, C. Duran, H.B. Senturk, M. Soylak, Removal of
Pb(II) ions from aqueous solution by a waste mud from copper mine industry:
equilibrium, kinetic and thermodynamic study, J. Hazard. Mater. 166 (2009)
1480–1487.
[47] T.-H.M. Havelcova, J. Mizera, I. Sykorovˇıa, M. Pekar, Sorption of metal ions on
lignite and the derived humic substances, J. Hazard. Mater. 161 (2009) 559–564.
[48] T.-H. Wang, M.-H. Li, S.-P. Teng, Bridging the gap between batch and column
experiments: a case study of Cs adsorption on granite, J. Hazard. Mater. 161
(2009) 409–415.
[49] H. El Bakouri, J. Usero, J. Morillo, A. Ouassini, Adsorptive features of acid-treated
olive stones for drin pesticides: equilibrium, kinetic and thermodynamic modeling studies, Bioresour. Technol. 100 (2009) 4147–4155.