Bài nghiệm thu cá nhân môn Tài chính doanh nghiệp (Tiếng Anh)
Bạn đang xem bản rút gọn của tài liệu. Xem và tải ngay bản đầy đủ của tài liệu tại đây (915.31 KB, 15 trang )
Corporate Finance
INDIVIDUAL ASSIGNMENT
Student:
Roll number:
Class:
Lecturer:
E-mail:
STUDY ON: LETUS CORPORATION
Table contents
Table contents ........................................................................................................................................ 1
Introduction to the Telus Corporation .......................................................................................... 2
I.
Analysis of the company ............................................................................................................ 2
II.
1.
Current situation........................................................................................................................ 2
2.
Telus Corporation’s recent years performance ........................................................................ 4
Analysis of the Telus’s stock ...................................................................................................... 6
III.
1.
Stock price over times ................................................................................................................ 6
2.
Stock valuation ........................................................................................................................... 7
a.
Estimation of required of return.............................................................................................. 7
b.
Assumption of the growth rate of dividend .............................................................................. 7
c.
The intrinsic value of the stock................................................................................................ 9
d.
Conclusion ............................................................................................................................ 10
References ............................................................................................................................................ 10
Appendices ........................................................................................................................................... 11
Appendix 1 ........................................................................................................................................ 11
Appendix 2 ........................................................................................................................................ 12
Appendix 3 ........................................................................................................................................ 14
1
I.
Introduction to the Telus Corporation
Telus Corporation (Symbol TU), established in 1993 in Burnaby, Canada, is a national
telecommunications company that provides a wide range of telecommunications products and
services including wireless, data, Internet protocol (IP), voice, and television
The company operates through 2 segments: Wireless and Wireline.
-
The wireless segments provides digital personal communications, equipment sales, and
wireless internet services
-
The wireline segment offers voice local and voice long distance services, data services,
which include television, and managed and legacy data services, as well as internet,
enhanced data, and hosting services, and other telecommunications services
Over its history, Telus has been delivering innovative telecommunications solutions to
Canadian and become the second largest telecommunication company in Canada.
Telus’s strategic intent is to unleash the power of the Internet to deliver the best solutions to
Canadians at home, in the workplace and on the move.
Some recent important projects:
-
February 7, 2012, new innovation from Telus – Optick TV – become the first service in
the world to enable the customers to control both live and recorded TV using hand
gestures and voice commands
-
February 9, 2012, Telus launched 4G LTE wireless network which went live in 14
metropolitan areas across Canada.
II. Analysis of the company
1.
Current situation
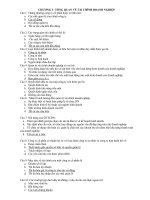
The table following partly shows the position of Telus Corporation in comparison with its
competitors as well as the whole wireless communication industry (figure of October 6, 2012)
2
()
3
The figures, particularly the rank in the second tables partly show us Telus has a quite high
position in the industry. Some typical figures can be addressed like P/E = 16.61, ranked
40/200, dividend yield (annual) of 3.90%, ranked 11/200. Revenue of Telus (10.67 billion
dollars) is much higher than the industry in general (2.52 billion dollars), even though it’s
lower than some of its competitors such as BCE (10.16 billion dollars) or RCI (12.58 billion
dollars)
2.
Telus Corporation’s recent years performance
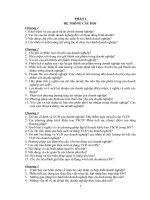
The table, and the corresponding graph, below shows main figures (Revenue and Net income)
in the Income statement of Letus
()
Overall, Telus Corporation has witnessed a growth recent years. Evidently, both revenue and
net income of the corporation have increased, even though the rate of growth tends to be
smaller. Particularly, look at the graph for Net income it’s clear that Telus’s net income grows
quite stably through years.
In the next table, I compute some typical financial ratios for Telus Corporation during three
years, 2008, 2009 and 1010
4
(The detail figures are in the Balance Sheet, Income Statement and Cash Flow of Telus for
2008, 2009, and 2010 that are in enclosed in Appendices)
Ratios
Formula
2010
2009
2008
Current ratios
Current assets
Current liabilitie s
0.35
0.38
0.51
Total assets turnover
Net sales
Total assets
0.5
0.5
0.48
Total debt ratios
Total debt
Total asset
0.58
0.61
0.6
Net profit margin
Net income
Net sales
10.61%
10.43%
10.84%
Equity multiplier
Total assets
Total equity
2.39
2.54
2.5
5.31%
5.22%
5.20%
12.69%
13.26%
13.00%
DuPont
system
ROA
ROE
Net profit margin *
Total asset turnover
ROE ROA *
Equity multiplier
These financial ratios enable us to evaluate the performance of Telus Corporation in recent
years.
Look at the table above, we can see some positive sign such as the increase in total assets
turnover, net profit margin and ROA. Together with that, Telus seems less likely to use debt
financing its assets (0.61 in 2009, fall to 0.58 in 2010).
The equity multiplier and ROE, in contrast, tend to reduce in this period. ROE, from 13% in
2008, increase a little in 2009 but then fall to 12.69% in 2010. ROE is equal ROA multi
equity plier, so, as ROA increases, the decrease of ROE is a result of decrease in equity
5
multiplier. As under DuPont system, maximizing ROE is considered as an appropriate goal
for a firm, this seems to be a negative sign. As in the global economic downturn, this slight
negative sign is understandable.
Conclusion:
Telus Corporation is less likely to use debt financing its assets, which reduce
equity multiplier and ROE a little bit. However, overall the Corporation still witness a constant
growth through years (quite constant increase in Net income)
III. Analysis of the Telus’s stock
1.
Stock price over times
6
()
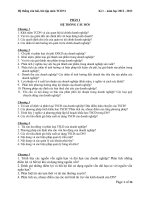
The first graph shows the price of common stock of Telus from 2008 until now. As you can
see, in 2008-2009, because of the global economic recession, the price of Telus felt sharply
($31.15 in December, 2009). But soon after, from 2009 until now, the price increase
constantly. And the second picture is the price and some information for TU share of stock in
the trading day 5/10/2012. The price reaches $64.27 per share of stock
2.
Stock valuation
Now, I get today, Saturday, October 6, 2012 as the time zero to calculate the present intrinsic
value of share of stock for TU
a.
Estimation of required of return
The required rate of return, or the expected return is computed by the equation:
E ( R) Rrf [ E ( Rm ) Rrf ]
-
for the Telus Corporation is 0.6 ( />
-
Expected return E(Rm) is the average value of the U.S stock market, 12.5%
-
Risk free (Rrf) is the expected return for US government treasury 30-year bond. As I
suppose the time zero is today, Saturday, October 6, 2012, I get the value of risk free for
October 5, 2012. So, risk free Rrf = 2.96 ()
E ( R) Rrf [ E ( Rm ) Rrf ]
0.0296 0.6 *[0.125 0.0296]
0.08684 or 8.68%
b.
Assumption of the growth rate of dividend
7
The dividend of the Corporation recent years is shown in the graph below
As it’s shown in the table and in the graph, especially the red line in the table, dividend of
Telus Corporation had decreased a little in 2008, but quickly rise again in later year, until the
end of 2011, dividend was $0.57
Generally, the dividend increase but the growth rate is not constant: 3.08% in 2008; 10.34%
in 2009; 15.63% in 2010 and 11.17% in 2011(Based on dividend in September each year).
I expect the dividend and growth rate for the next four year would be like below.
And, after four year of fast growing, Telus will experience a constant growth rate of 7.51%
8
c.
The intrinsic value of the stock
Now, let’s sum up all of assumptions that have been made.
Firstly, I computed the required rate of return for TU stock is 8.68%
I also expected dividends for next four year of fast-growing before it constantly grows at rate
of 7.51%
Year
Dividend
Growth rate
2008
2009
2010
2011
2012
0.422
0.435
0.48
0.555
0.617
3.08
10.34
15.63
11.17
9
2103
2014
2015
2016
2017
0.689
0.761
0.834
0.905
0.973
11.67
10.45
9.59
8.51
7.51
(Constantly grow from 2017 at 7.51%)
The price for TU stock at the end of the fourth year would be:
P4 P2016
D2017
0.973
$83.18 per share of stock
R g 2017 0.0868 0.0751
Finally, I can calculate the present intrinsic value of TU share of stock (at the day 6/10/2012)
D2013
D2014
D2015
D2016
P2016
(1 R) (1 R) 2 (1 R)3 (1 R) 4 (1 R) 4
0.689
0.761
0.834
0.905
83.18
2
3
4
(1 0.0868) (1 0.0868) (1 0.0868) (1 0.0868) (1 0.0868) 4
$62.20
P0 P2012
d.
Conclusion
The present intrinsic value of TU is $62.20 per share of stock
The
quoted
price
for
TU
stock
is
actually
$64.27
()
So, the stock of Telus Corporation (TU) is being over-valued.
We should sell the TU stock at the moment.
References
Book:
Fundamentals of Corporate Finance, 2nd edition
10
per
share
of
stock
Websites:
/> />
Appendices
Appendix 1
Balance sheet of Telus Corporation for 2008, 2009 and 2010
(Currency in thousand USD)
Dec 30, 2009
Dec 30, 2008
25,000
43,000
3,273
-
-
8,183
Net Receivables
973,000
710,000
810,935
Inventory
283,000
270,000
272,494
Other Current Assets
113,000
105,000
180,026
1,390,000
1,127,000
1,274,911
37,000
41,000
-
Property Plant and Equipment
7,722,000
7,729,000
5,987,501
Goodwill
3,572,000
3,572,000
3,245,378
Intangible Assets
5,134,000
5,148,000
5,460,516
-
-
-
1,744,000
1,602,000
600,632
-
-
-
Period Ending
Dec 30, 2010
Assets
Current Assets
Cash And Cash Equivalents
Short Term Investments
Total Current Assets
Long Term Investments
Accumulated Amortization
Other Assets
Deferred Long Term Asset Charges
11
Total Assets
19,599,000
19,219,000
16,568,938
Liabilities
Current Liabilities
Accounts Payable
2,676,000
2,685,000
2,436,897
Short/Current Long Term Debt
1,162,000
144,000
64,646
111,000
135,000
-
Total Current Liabilities
3,949,000
2,964,000
2,501,543
Long Term Debt
5,313,000
6,090,000
5,217,481
Other Liabilities
638,000
1,271,000
1,027,785
1,498,000
1,319,000
1,181,625
22,000
21,000
18,821
-
-
-
11,420,000
11,665,000
9,947,255
Other Current Liabilities
Deferred Long Term Liability Charges
Minority Interest
Negative Goodwill
Total Liabilities
Stockholders' Equity
Misc Stocks Options Warrants
-
-
-
Redeemable Preferred Stock
-
-
-
Preferred Stock
-
-
-
Common Stock
-
-
6,620,865
Retained Earnings
-
-
265,129
Treasury Stock
-
-
-
Capital Surplus
-
-
161,205
Other Stockholder Equity
-
-
(425,516)
Total Stockholder Equity
8,201,000
7,575,000
6,621,684
Net Tangible Assets
(505,000)
(1,145,000)
(2,084,210)
Appendix 2
Income statement of Telus Corporation for 2008, 2009 and 2010
(Currency in thousand USD)
12
Income Statement
View: Annual Data | Quarterly Data
All numbers in thousands
Dec 31, 2010 Dec 31, 2009 Dec 31, 2008
Period Ending
Total Revenue
9,779,000
9,606,000
7,899,050
Cost of Revenue
6,062,000
5,925,000
2,697,935
Gross Profit
3,717,000
3,681,000
5,201,115
Operating Expenses
Research Development
-
-
-
Selling General and Administrative
-
-
2,111,214
74,000
190,000
48,280
1,735,000
1,722,000
1,442,663
-
-
-
1,908,000
1,769,000
1,598,958
Non Recurring
Others
Total Operating Expenses
Operating Income or Loss
Income from Continuing Operations
Total Other Income/Expenses Net
(542,000)
(564,000)
(18,003)
Earnings Before Interest And Taxes
1,366,000
1,205,000
1,615,324
-
-
390,329
1,366,000
1,205,000
1,224,995
328,000
203,000
322,410
-
-
(2,455)
1,038,000
1,002,000
865,761
Interest Expense
Income Before Tax
Income Tax Expense
Minority Interest
Net Income From Continuing Ops
Non-recurring Events
Discontinued Operations
-
-
-
Extraordinary Items
-
-
-
Effect Of Accounting Changes
-
-
-
Other Items
-
-
-
1,038,000
1,002,000
865,761
-
-
-
1,038,000
1,002,000
865,761
Net Income
Preferred Stock And Other Adjustments
Net Income Applicable To Common Shares
13
Appendix 3
Cash flows of Telus Corporation for 2008, 2009 and 2010
(Currency in thousand USD)
Cash Flow
View: Annual Data | Quarterly Data
All numbers in thousands
Period Ending
Dec 30,
2010
Dec 30,
2009
Dec 30,
2008
Net Income
1,038,000
1,002,000
865,761
Operating Activities, Cash Flows Provided By or Used In
Depreciation
1,735,000
1,722,000
1,404,203
9,000
(159,000)
(19,639)
Changes In Accounts Receivables
-
-
(177,571)
Changes In Liabilities
-
-
21,276
Changes In Inventories
-
-
(73,647)
(236,000)
339,000
229,124
2,546,000
2,904,000
2,306,788
Adjustments To Net Income
Changes In Other Operating Activities
Total Cash Flow From Operating
Activities
Investing Activities, Cash Flows Provided By or Used In
Capital Expenditures
(1,721,000)
(2,103,000)
(1,521,220)
-
-
-
14,000
(25,000)
(1,288,004)
(1,707,000)
(2,128,000)
(2,809,224)
Investments
Other Cash flows from Investing Activities
Total Cash Flows From Investing
Activities
Financing Activities, Cash Flows Provided By or Used In
Dividends Paid
Sale Purchase of Stock
Net Borrowings
(476,000)
(608,000)
(358,415)
15,000
1,000
(229,124)
(402,000)
(132,000)
1,076,883
-
-
-
(863,000)
(739,000)
489,343
-
-
-
(24,000)
37,000
(13,093)
Other Cash Flows from Financing Activities
Total Cash Flows From Financing
Activities
Effect Of Exchange Rate Changes
Change In Cash and Cash Equivalents
14