Financial risk manager handbook plus test bank FRM part i and II sixth edition by philippe jorion GARP
Bạn đang xem bản rút gọn của tài liệu. Xem và tải ngay bản đầy đủ của tài liệu tại đây (3.55 MB, 819 trang )
P1: ABC/ABC
fm
P2: c/d
JWBT422-Jorion
QC: e/f
T1: g
November 22, 2010
7:55
Printer Name: Yet to Come
P1: ABC/ABC
fm
P2: c/d
JWBT422-Jorion
QC: e/f
T1: g
November 22, 2010
7:55
Printer Name: Yet to Come
Financial Risk
Manager Handbook
Plus Test Bank
Sixth Edition
i
P1: ABC/ABC
fm
P2: c/d
JWBT422-Jorion
QC: e/f
T1: g
November 22, 2010
7:55
Printer Name: Yet to Come
Founded in 1807, John Wiley & Sons is the oldest independent publishing company in the United States. With offices in North America, Europe, Australia, and
Asia, Wiley is globally committed to developing and marketing print and electronic
products and services for our customers’ professional and personal knowledge and
understanding.
The Wiley Finance series contains books written specifically for finance and
investment professionals as well as sophisticated individual investors and their
financial advisors. Book topics range from portfolio management to e-commerce,
risk management, financial engineering, valuation, and financial instrument analysis, as well as much more.
For a list of available titles, visit our Web site at www.WileyFinance.com.
ii
P1: ABC/ABC
fm
P2: c/d
JWBT422-Jorion
QC: e/f
T1: g
November 22, 2010
7:55
Printer Name: Yet to Come
Financial Risk
Manager Handbook
Plus Test Bank
FRM R Part I/Part II
Sixth Edition
PHILIPPE JORION
GARP
John Wiley & Sons, Inc.
iii
P1: ABC/ABC
fm
P2: c/d
JWBT422-Jorion
QC: e/f
T1: g
November 22, 2010
7:55
Printer Name: Yet to Come
Copyright C 2011 by Philippe Jorion, except for FRM sample questions, which are copyright 1997–2011 by
GARP. The FRM designation is a GARP trademark. All rights reserved.
Published by John Wiley & Sons, Inc., Hoboken, New Jersey.
Published simultaneously in Canada.
No part of this publication may be reproduced, stored in a retrieval system, or transmitted in any form or by
any means, electronic, mechanical, photocopying, recording, scanning, or otherwise, except as permitted under
Section 107 or 108 of the 1976 United States Copyright Act, without either the prior written permission of the
Publisher, or authorization through payment of the appropriate per-copy fee to the Copyright Clearance
Center, Inc., 222 Rosewood Drive, Danvers, MA 01923, (978) 750-8400, fax (978) 646-8600, or on the web
at www.copyright.com. Requests to the Publisher for permission should be addressed to the Permissions
Department, John Wiley & Sons, Inc., 111 River Street, Hoboken, NJ 07030, (201) 748-6011,
fax (201) 748-6008, or online at />Limit of Liability/Disclaimer of Warranty: While the publisher and author have used their best efforts in
preparing this book, they make no representations or warranties with respect to the accuracy or completeness
of the contents of this book and specifically disclaim any implied warranties of merchantability or fitness for a
particular purpose. No warranty may be created or extended by sales representatives or written sales materials.
The advice and strategies contained herein may not be suitable for your situation. You should consult with a
professional where appropriate. Neither the publisher nor author shall be liable for any loss of profit or any
other commercial damages, including but not limited to special, incidental, consequential, or other damages.
For general information on our other products and services or for technical support, please contact our
Customer Care Department within the United States at (800) 762-2974, outside the United States at (317)
572-3993 or fax (317) 572-4002.
Wiley also publishes its books in a variety of electronic formats. Some content that appears in print may not be
available in electronic books. For more information about Wiley products, visit our web site at www.wiley.com.
Library of Congress Cataloging-in-Publication Data:
Jorion, Philippe.
Financial risk manager handbook plus test bank : FRM Part I/Part II, 6th Edition / Philippe Jorion. – 6th ed.
p. cm.
Includes index.
ISBN 978-0-470-90401-5 (paper/online)
1. Financial risk management. 2. Risk management. 3. Corporations–Finance. I. Title.
HD61.J67 2009
658.15 5–dc22
2010047263
Printed in the United States of America
10 9 8 7 6 5 4 3 2 1
iv
P1: ABC/ABC
fm
P2: c/d
JWBT422-Jorion
QC: e/f
T1: g
November 22, 2010
7:55
Printer Name: Yet to Come
Contents
Preface
ix
About the Author
xi
About GARP
xiii
Introduction
xv
PART ONE
Foundations of Risk Management
CHAPTER 1
Risk Management
1
3
PART TWO
Quantitative Analysis
25
CHAPTER 2
Fundamentals of Probability
27
CHAPTER 3
Fundamentals of Statistics
61
CHAPTER 4
Monte Carlo Methods
83
CHAPTER 5
Modeling Risk Factors
103
PART THREE
Financial Markets and Products
125
CHAPTER 6
Bond Fundamentals
127
CHAPTER 7
Introduction to Derivatives
157
CHAPTER 8
Option Markets
177
v
P1: ABC/ABC
fm
P2: c/d
JWBT422-Jorion
QC: e/f
T1: g
November 22, 2010
7:55
Printer Name: Yet to Come
vi
CONTENTS
CHAPTER 9
Fixed-Income Securities
207
CHAPTER 10
Fixed-Income Derivatives
231
CHAPTER 11
Equity, Currency, and Commodity Markets
255
PART FOUR
Valuation and Risk Models
281
CHAPTER 12
Introduction to Risk Models
283
CHAPTER 13
Managing Linear Risk
311
CHAPTER 14
Nonlinear (Option) Risk Models
331
PART FIVE
Market Risk Management
355
CHAPTER 15
Advanced Risk Models: Univariate
357
CHAPTER 16
Advanced Risk Models: Multivariate
375
CHAPTER 17
Managing Volatility Risk
405
CHAPTER 18
Mortgage-Backed Securities Risk
427
PART SIX
Credit Risk Management
449
CHAPTER 19
Introduction to Credit Risk
451
CHAPTER 20
Measuring Actuarial Default Risk
471
CHAPTER 21
Measuring Default Risk from Market Prices
501
CHAPTER 22
Credit Exposure
523
P1: ABC/ABC
fm
P2: c/d
QC: e/f
JWBT422-Jorion
T1: g
November 22, 2010
7:55
Printer Name: Yet to Come
Contents
vii
CHAPTER 23
Credit Derivatives and Structured Products
555
CHAPTER 24
Managing Credit Risk
587
PART SEVEN
Operational and Integrated Risk Management
611
CHAPTER 25
Operational Risk
613
CHAPTER 26
Liquidity Risk
639
CHAPTER 27
Firmwide Risk Management
657
CHAPTER 28
The Basel Accord
685
PART EIGHT
Investment Risk Management
Index
725
CHAPTER 29
Portfolio Risk Management
727
CHAPTER 30
Hedge Fund Risk Management
749
779
P1: ABC/ABC
fm
P2: c/d
JWBT422-Jorion
QC: e/f
T1: g
November 22, 2010
7:55
Printer Name: Yet to Come
viii
P1: ABC/ABC
fm
P2: c/d
JWBT422-Jorion
QC: e/f
T1: g
November 22, 2010
7:55
Printer Name: Yet to Come
Preface
he Financial Risk Manager Handbook Plus Test Bank provides the core
body of knowledge for financial risk managers. Risk management has rapidly
evolved over the past decade and has become an indispensable function in many
institutions.
This Handbook was originally written to provide support for candidates taking the FRM examination administered by GARP. As such, it reviews a wide
variety of practical topics in a consistent and systematic fashion. It covers quantitative methods, major financial products, as well as market, credit, operational,
and integrated risk management. It also discusses investment risk management
issues essential for risk professionals.
This edition has been thoroughly updated to reflect recent developments in
financial markets and changes in the structure of the FRM program. The book
is now structured to correspond to the two levels of the FRM exams. All of
the chapters have been updated to account for recent developments in financial
markets and regulations. In particular, current issues are integrated in the second
part of the book. New chapters have been added, including chapters that deal
with advanced univariate and multivariate models, as well as advanced option
models. Finally, this Handbook incorporates the latest questions from the FRM
examinations.
Modern risk management systems cut across the entire organization. This
breadth is reflected in the subjects covered in this Handbook. The Handbook
was designed to be self-contained, but only for readers who already have some
exposure to financial markets. To reap maximum benefit from this book, readers
ideally should have taken the equivalent of an MBA-level class on investments.
Finally, I want to acknowledge the help received in writing this Handbook. In
particular, I would like to thank the numerous readers who shared comments on
previous editions. Any comment or suggestion for improvement will be welcome.
This feedback will help us to maintain the high quality of the FRM designation.
T
Philippe Jorion
October 2010
ix
P1: ABC/ABC
fm
P2: c/d
JWBT422-Jorion
QC: e/f
T1: g
November 22, 2010
7:55
Printer Name: Yet to Come
x
P1: ABC/ABC
fm
P2: c/d
JWBT422-Jorion
QC: e/f
T1: g
November 24, 2010
0:14
Printer Name: Yet to Come
About the Author
Philippe Jorion is a Professor of Finance at the Paul Merage School of Business at
the University of California at Irvine. He has also been a professor at Columbia
University, Northwestern University, the University of Chicago, and the University
of British Columbia. In addition, he taught the risk management class in the Master
of Financial Engineering programs at the University of California at Berkeley and
University of California at Los Angeles. He holds an M.B.A. and a Ph.D. from the
University of Chicago and a degree in engineering from the University of Brussels.
Dr. Jorion is also a managing director at Pacific Alternative Asset Management
Company (PAAMCO), a global fund of hedge funds with approximately $10 billion under management. PAAMCO is one of the few funds of funds to require
position-level transparency from all invested hedge funds. This information is used
to provide various measures of portfolio risk as well as to develop tools that help
investors to understand the drivers of the funds’ alpha and to detect style drift.
Dr. Jorion is the author of more than 100 publications directed to academics
and practitioners on the topics of risk management and international finance. He
has also written a number of books, including Big Bets Gone Bad: Derivatives and
Bankruptcy in Orange County, the first account of the largest municipal failure
in U.S. history, and Value at Risk: The New Benchmark for Managing Financial
Risk, which is aimed at finance practitioners and has become an industry standard.
Philippe Jorion is a frequent speaker at academic and professional conferences.
He is on the editorial board of a number of finance journals and was editor in
chief of the Journal of Risk.
xi
P1: ABC/ABC
fm
P2: c/d
JWBT422-Jorion
QC: e/f
T1: g
November 24, 2010
0:14
Printer Name: Yet to Come
xii
P1: ABC/ABC
fm
P2: c/d
JWBT422-Jorion
QC: e/f
T1: g
November 24, 2010
0:14
Printer Name: Yet to Come
About GARP
ounded in 1996, the Global Association of Risk Professionals (GARP) is the
leading not-for-profit association for world-class financial risk certification, education, and training, with close to 100,000 members representing 167 countries.
With deep expertise and a strong reputation, GARP sets global standards and
creates risk management programs valued worldwide. All GARP programs are
developed with input from experts around the world to ensure that concepts and
content reflect globally accepted practices.
GARP is dedicated to advancing the risk profession. For more information
about GARP, please visit www.garp.com.
F
FINANCIAL RISK MANAGER (FRM
R
) CERTIFICATION
The benchmark FRM designation is the globally accepted risk management certification for financial risk professionals. The FRM objectively measures competency
in the risk management profession based on globally accepted standards. With
a compound annual growth rate of 25% over the past seven years, the FRM
program has experienced significant growth in every financial center around the
world. Now 16,000+ individuals hold the FRM designation in over 90 countries. In addition, organizations with five or more FRM registrants grew from
105 in 2003 to 424 in 2008, further demonstrating the FRM program’s global
acceptance.
The FRM Continuing Professional Education (CPE) program, offered exclusively for certified FRM holders, provides the perspective and framework needed
to further develop competencies in the ever-evolving field of risk management.
For more information about the FRM program, please visit www.garp.com/
frmexam.
OTHER GARP CERTIFICATIONS
International Certificate in Banking Risk and
Regulation (ICBRR)
The ICBRR allows individuals to expand their knowledge and understanding of
the various risks, regulations, and supervisory requirements banks must face in
today’s economy, with emphasis on the Basel II Accord. This certificate is ideal
for employees who are not professional risk managers but who have a strong need
to understand risk concepts. The ICBRR program is designed for employees in
nonrisk departments such as internal audit, accounting, information technology
xiii
P1: ABC/ABC
fm
P2: c/d
JWBT422-Jorion
QC: e/f
T1: g
November 24, 2010
0:14
Printer Name: Yet to Come
xiv
ABOUT GARP
(IT), legal, compliance, and sales, acknowledging that everyone in the organization
is a risk manager!
Energy Risk Professional Program
The Energy Risk Professional (ERP R ) program is designed to measure a candidate’s knowledge of the major energy markets and gauge their ability to manage
the physical and financial risks inherent in the complex world of energy. This
program is valuable for anyone working in or servicing the energy field, requiring
an understanding of the physical and financial markets, how they interrelate, and
the risks involved.
GARP DIGITAL LIBRARY
As the world’s largest digital library dedicated to financial risk management,
the GARP Digital Library (GDL) is the hub for risk management education and
research material. The library’s unique iReadingsTM allow users to download individual chapters of books, saving both time and money. There are over 1,000
readings available from 12 different publishers. The GDL collection offers readings to meet the needs of anyone interested in risk management.
For more information, please visit www.garpdigitallibrary.org.
GARP EVENTS AND NETWORKING
GARP hosts major conventions throughout the world, where risk professionals
come together to share knowledge, network, and learn from leading experts in
the field. Conventions are bookended with interactive workshops that provide
practical insights and case studies presented by the industry’s leading practitioners.
GARP regional chapters provide an opportunity for financial risk professionals to network and share new trends and discoveries in risk management. Each
of our 52 chapters holds several meetings each year, in some locations more often, focusing on issues of importance to the risk management community, either
globally or locally.
P1: ABC/ABC
fm
P2: c/d
JWBT422-Jorion
QC: e/f
T1: g
November 24, 2010
0:14
Printer Name: Yet to Come
Introduction
ARP’s formal mission is to be the leading professional association for financial
risk managers, managed by and for its members and dedicated to the advancement of the risk profession through education, training, and the promotion of best
practices globally. As a part of delivering on that mission, GARP has again teamed
with Philippe Jorion to produce the sixth edition of the Financial Risk Manager
Handbook Plus Test Bank.
The Handbook follows GARP’s FRM Committee’s published FRM Study
Guide, which sets forth primary topics and subtopics covered in the FRM exam.
The topics are selected by the FRM Committee as being representative of the
theories and concepts utilized by risk management professionals as they address
current issues.
Over the years the Study Guide has taken on an importance far exceeding its
initial intent of providing guidance for FRM candidates. The Study Guide is now
being used by universities, educators, and executives around the world to develop
graduate-level business and finance courses, as a reference list for purchasing new
readings for personal and professional libraries, as an objective outline to assess an
employee’s or job applicant’s risk management qualifications, and as guidance on
the important trends currently affecting the financial risk management profession.
Given the expanded and dramatically growing recognition of the financial risk
management profession globally, the Handbook has similarly assumed a natural
and advanced role beyond its original purpose. It has now become the primary
reference manual for risk professionals, academicians, and executives around the
world. Professional risk managers must be well versed in a wide variety of riskrelated concepts and theories, and must also keep themselves up-to-date with
a rapidly changing marketplace. The Handbook is designed to allow them to
do just that. It provides a financial risk management practitioner with the latest
thinking and approaches to financial risk-related issues. It also provides coverage
of advanced topics with questions and tutorials to enhance the reader’s learning
experience.
This sixth edition of the Handbook includes revised coverage of the primary
topic areas covered by the FRM examination. Importantly, this edition also includes the latest lessons from the recent credit crisis, as well as new and more
recent sample FRM questions.
The Handbook continues to keep pace with the dynamic financial risk profession while simultaneously offering serious risk professionals an excellent and
cost-effective tool to keep abreast of the latest issues affecting the global risk
management community.
G
xv
P1: ABC/ABC
fm
P2: c/d
JWBT422-Jorion
xvi
QC: e/f
T1: g
November 24, 2010
0:14
Printer Name: Yet to Come
INTRODUCTION
Developing credibility and global acceptance for a professional certification
program is a lengthy and complicated process. When GARP first administered
its FRM exam in 1997, the concept of a professional risk manager and a global
certification relating to that person’s skill set was more theory than reality. That
has now completely changed, as the number of current FRM holders exceeds
16,000.
The FRM is now the benchmark for a financial risk manager anywhere around
the world. Professional risk managers having earned the FRM credential are globally recognized as having achieved a level of professional competency and a demonstrated ability to dynamically measure and manage financial risk in a real-world
setting in accordance with global standards.
GARP is proud to continue to make this Handbook available to financial risk
professionals around the world. Philippe Jorion, a preeminent risk professional,
has again compiled an exceptional reference book. Supplemented by an interactive
Test Bank, this Handbook is a requirement for any risk professional’s library.
The Test Bank is a preparatory review for anyone studying for the FRM
exam and for risk professionals interested in self-study to review and improve
their knowledge of market, credit, and operational risk management. The Test
Bank contains hundreds of multiple-choice questions from the 2007, 2008, and
2009 FRM exams, with answers and solutions provided. The Test Bank can be
downloaded following the instructions on the FRM R Test Bank Download page
at the end of this book.
Global Association of Risk Professionals
October 2010
P1: ABC/ABC
c01
P2: c/d
JWBT422-Jorion
QC: e/f
T1: g
November 3, 2010
11:35
Printer Name: Yet to Come
PART
One
Foundations of Risk
Management
1
P1: ABC/ABC
c01
P2: c/d
JWBT422-Jorion
QC: e/f
T1: g
November 3, 2010
11:35
Printer Name: Yet to Come
2
P1: ABC/ABC
c01
P2: c/d
JWBT422-Jorion
QC: e/f
T1: g
November 3, 2010
11:35
Printer Name: Yet to Come
CHAPTER
1
Risk Management
inancial risk management is the process by which financial risks are identified,
assessed, measured, and managed in order to create economic value.
Some risks can be measured reasonably well. For those, risk can be quantified
using statistical tools to generate a probability distribution of profits and losses.
Other risks are not amenable to formal measurement but are nonetheless important. The function of the risk manager is to evaluate financial risks using both
quantitative tools and judgment.
As financial markets have expanded over recent decades, the risk management
function has become more important. Risk can never be entirely avoided. More
generally, the goal is not to minimize risk; it is to take smart risks.
Risk that can be measured can be managed better. Investors assume risk only
because they expect to be compensated for it in the form of higher returns. To
decide how to balance risk against return, however, requires risk measurement.
Centralized risk management tools such as value at risk (VAR) were developed in the early 1990s. They combine two main ideas. The first is that risk
should be measured at the top level of the institution or the portfolio. This idea
is not new. It was developed by Harry Markowitz (1952), who emphasized the
importance of measuring risk in a total portfolio context.1 A centralized risk measure properly accounts for hedging and diversification effects. It also reflects the
fact that equity is a common capital buffer to absorb all risks. The second idea
is that risk should be measured on a forward-looking basis, using the current
positions.
This chapter gives an overview of the foundations of risk management. Section
1.1 provides an introduction to the risk measurement process, using an illustration.
Next, Section 1.2 discusses how to evaluate the quality of risk management processes. Section 1.3 then turns to the integration of risk measurement with business
decisions, which is a portfolio construction problem. These portfolio decisions can
be aggregated across investors, leading to asset pricing theories that can be used
as yardsticks for performance evaluation and for judging risk management and
are covered in Section 1.4. Finally, Section 1.5 discusses how risk management
can add economic value.
F
FRM Exam Part 1 topic. In addition to the topics described in this chapter, FRM candidates should
also read the GARP Code of Conduct.
1
Harry Markowitz, “Portfolio Selection,” Journal of Finance 7 (1952): 77–91.
3
P1: ABC/ABC
c01
P2: c/d
JWBT422-Jorion
QC: e/f
T1: g
November 3, 2010
11:35
Printer Name: Yet to Come
4
FOUNDATIONS OF RISK MANAGEMENT
1.1 RISK MEASUREMENT
1.1.1 Example
The first step in risk management is the measurement of risk. To illustrate, consider
a portfolio with $100 million invested in U.S. equities. Presumably, the investor
undertook the position because of an expectation for profit, or investment growth.
This portfolio is also risky, however.
The key issue is whether the expected profit for this portfolio warrants the
assumed risk. Thus a trade-off is involved, as in most economic problems. To
help answer this question, the risk manager should construct the distribution of
potential profits and losses on this investment. This shows how much the portfolio
can lose, thus enabling the investor to make investment decisions.
Define ⌬ P as the profit or loss for the portfolio over a fixed horizon, say
the coming month. This must be measured in a risk currency, such as the dollar.
This is also the product of the initial investment value P and the future rate of
return RP . The latter is a random variable, which should be described using its
probability density function. Using historical data over a long period, for example,
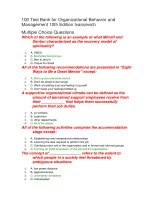
the risk manager produces Figure 1.1.
This graph is based on the actual distribution of total returns on the S&P
500 index since 1925. The line is a smoothed histogram and does not assume a
simplified model such as the normal distribution.
The vertical axis represents the frequency, or probability, of a gain or loss of
a size indicated on the horizontal axis. The entire area under the curve covers all
of the possible realizations, so should add up to a total probability of 1.
Most of the weight is in the center of the distribution. This shows that it is most
likely that the return will be small, whether positive or negative. The tails have less
weight, indicating that large returns are less likely. This is a typical characteristic
of returns on financial assets. So far, this pattern resembles the bell-shaped curve
for a normal distribution.
Probability
Mean = 1%
VAR = 14.4%
Standard
deviation = 5.5%
−30
−20
−10
0
10
Monthly return (%)
FIGURE 1.1 Distribution of Monthly Returns on U.S. Stocks
20
30
P1: ABC/ABC
c01
P2: c/d
JWBT422-Jorion
QC: e/f
T1: g
November 3, 2010
11:35
Printer Name: Yet to Come
5
Risk Management
On the downside, however, there is a substantial probability of losing 10% or
more in a month. This cumulative probability is 3%, meaning that in a repeated
sample with 100 months, we should expect to lose 10% or more for a total of
three months. This risk is worse than predicted by a normal distribution.
If this risk is too large for the investor, then some money should be allocated
to cash. Of course, this comes at the expense of lower expected returns.
The distribution can be characterized in several ways. The entire shape is
most informative because it could reveal a greater propensity to large losses than
to gains. The distribution could be described by just a few summary statistics,
keeping in mind that this is an oversimplification. Other chapters offer formal
definitions of these statistics.
The mean, or average return, which is approximately 1% per month. Define
this as (RP ), or P in short, or even when there is no other asset.
The standard deviation, which is approximately 5.5%. This is often called
volatility and is a measure of dispersion around the mean. Define this as .
This is the square root of the portfolio variance, 2 .
The value at risk (VAR), which is the cutoff point such that there is a low
probability of a greater loss. This is also the percentile of the distribution.
Using a 99% confidence level, for example, we find a VAR of 14.4%.
1.1.2 Absolute versus Relative Risk
So far, we have assumed that risk is measured by the dispersion of dollar returns,
or in absolute terms. In some cases, however, risk should be measured relative to
some benchmark. For example, the performance of an active manager is compared
to that of an index such as the S&P 500 index for U.S. equities. Alternatively, an
investor may have future liabilities, in which case the benchmark is an index of
the present value of liabilities. An investor may also want to measure returns after
accounting for the effect of inflation. In all of these cases, the investor is concerned
with relative risk.
Absolute risk is measured in terms of shortfall relative to the initial value of
the investment, or perhaps an investment in cash. Using the standard deviation
as the risk measure, absolute risk in dollar terms is
(⌬ P) = (⌬ P/P) × P = (RP ) × P
(1.1)
Relative risk is measured relative to a benchmark index B. The deviation is
e = RP − RB , which is also known as the tracking error. In dollar terms, this
is e × P. The risk is
(e)P = [(RP − RB )] × P = × P
where is called tracking error volatility (TEV).
(1.2)
P1: ABC/ABC
c01
P2: c/d
JWBT422-Jorion
QC: e/f
T1: g
November 3, 2010
11:35
Printer Name: Yet to Come
6
FOUNDATIONS OF RISK MANAGEMENT
To compare these two approaches, take the case of an active equity portfolio
manager who is given the task of beating a benchmark. In the first year, the active
portfolio returns −6% but the benchmark drops by −10%. So, the excess return
is positive: e = −6% − (−10%) = 4%. In relative terms, the portfolio has done
well even though the absolute performance is negative. In the second year, the
portfolio returns +6%, which is good using absolute measures, but not so good
if the benchmark goes up by +10%.
EXAMPLE 1.1: ABSOLUTE AND RELATIVE RISK
An investment manager is given the task of beating a benchmark. Hence the
risk should be measured in terms of
a.
b.
c.
d.
Loss relative to the initial investment
Loss relative to the expected portfolio value
Loss relative to the benchmark
Loss attributed to the benchmark
1.2 EVALUATION OF THE RISK MEASUREMENT PROCESS
A major function of the risk measurement process is to estimate the distribution
of future profits and losses. The first part of this assignment is easy. The scale of
the dollar returns should be proportional to the initial investment. In other words,
given the distribution in Figure 1.1, an investment of $100 million should have a
standard deviation of (⌬ P) = $100 × 5.5% = $5.5 million. Scaling the current
position by a factor of 2 should increase this risk to $11 million.
The second part of the assignment, which consists of constructing the distribution of future rates of return, is much harder. In Figure 1.1, we have taken the
historical distribution and assumed that this provides a good representation of
future risks. Because we have a long history of returns over many different cycles,
this is a reasonable approach.
This is not always the case, however. The return may have been constant
over its recent history. This does not mean that it could not change in the future.
For example, the price of gold was fixed to $35 per ounce from 1934 to 1967
by the U.S. government. As a result, using a historical distribution over the 30
years ending in 1967 would have shown no risk. Instead, gold prices started
to fluctuate wildly thereafter. By 2008, gold prices had reached $1,000. Thus,
the responsibility of the risk manager is to judge whether the history is directly
relevant.
How do we evaluate the quality of a risk measurement process? The occurrence
of a large loss does not mean that risk management has failed. This could be simply
due to bad luck. An investment in stocks would have lost 17% in October 2008.
While this is a grievous loss, Figure 1.1 shows that it was not inconceivable. For
P1: ABC/ABC
c01
P2: c/d
JWBT422-Jorion
QC: e/f
T1: g
November 3, 2010
11:35
Printer Name: Yet to Come
Risk Management
7
example, the stock market lost 30% in September 1931 and 22% on October 19,
1987, before recovering. So, the risk manager could have done a perfect job of
forecasting the distribution of returns. How can we tell whether this loss is due to
bad luck or a flaw in the risk model?
1.2.1 Known Knowns
To help answer this question, it is useful to classify risks into various categories,
which we can call (1) known knowns, (2) known unknowns, and (3) unknown
unknowns.2 The first category consists of risks that are properly identified and
measured, as in the example of the position in stocks. Losses can still occur due
to a combination of bad luck and portfolio decisions.
Such losses, however, should not happen too often. Suppose that VAR at the
99% level of confidence is reported as 14.4%. Under these conditions, a string
of consecutive losses of 15% or more several months in a row should be highly
unusual. If this were to happen, it would be an indication of a flawed model.
A later chapter will show how backtesting can be used to detect flaws in risk
measurement systems.
1.2.2 Known Unknowns
The second category, called known unknowns, includes model weaknesses that
are known or should be known to exist but are not properly measured by risk managers. For example, the risk manager could have ignored important known risk
factors. Second, the distribution of risk factors, including volatilities and correlations, could be measured inaccurately. Third, the mapping process, which consists
of replacing positions with exposures on the risk factors, could be incorrect. This
is typically called model risk. Such risks can be evaluated using stress tests, which
shock financial variables or models beyond typical ranges.
As an example, consider the $19 billion loss suffered by UBS in 2007 alone
from positions in structured credit securities backed by subprime and Alt-A
mortgage-backed loans.3 UBS had invested in top-rated tranches that the bank
thought were perfectly safe (yet yielded high returns). As a result, it had accumulated a position of $90 billion in exposures to these securities, compared to
$41 billion in book equity. The bank reported that its risk measurement process
relied on simplified models based on a recent period of positive growth in housing
prices. As in the example of gold, the recent history gave a biased view of the true
risks. In addition, UBS’s risk managers overrelied on ratings provided by the credit
rating agencies. Because risk management gave little indication of the downside
2
Philippe Jorion, “Risk Management Lessons from the Credit Crisis,” European Financial Management 15 (2009): 923–933.
3
See UBS, Shareholder Report on UBS’s Write-Downs (Zurich: UBS, 2008). Loans can be classified
into prime, Alt-A, and subprime, in order of decreasing credit quality. Subprime loans are loans
made to consumers with low credit scores (typically below 640 out of a possible maximum of 850).
Alt-A loans, short for Alternative A-paper, are the next category (typically with credit scores below
680 or for loans lacking full documentation). Subprime and Alt-A mortgage loans are expected to
have higher credit risk than other (prime) loans.