Effects of Porogen on Structure and Properties of Poly Lactic AcidHydroxyapatite Nanocomposites (PLAHAp)
Bạn đang xem bản rút gọn của tài liệu. Xem và tải ngay bản đầy đủ của tài liệu tại đây (967.53 KB, 10 trang )
Article
Journal of
Nanoscience and Nanotechnology
Copyright © 2015 American Scientific Publishers
All rights reserved
Printed in the United States of America
Vol. 15, 1–10, 2015
www.aspbs.com/jnn
Effects of Porogen on Structure and Properties of Poly
Lactic Acid/Hydroxyapatite Nanocomposites (PLA/HAp)
Dinh Thi Mai Thanh1 ∗ , Pham Thi Thu Trang1 , Nguyen Thi Thom1, Nguyen Thu Phuong1 ,
Pham Thi Nam1 , Nguyen Thi Thu Trang1 , Jun Seo-Park2 , and Thai Hoang1
1
Institute for Tropical Technology, Vietnam Academy of Science and Technology, 18 Hoang Quoc Viet Street, Cau Giay, Hanoi, Vietnam
2
Department of Chemical Engineering Hankyong National University, 327 Jungang-ro, Anseong-si, Gyeonggi-do, 456-749, Korea
PLA/md-HAp/PEO porous nanocomposites for applications in bone engineering from poly lactic
acid (PLA) incorporated with different NH4 HCO3 porogen content were prepared by solvent casting
method. The porosity, morphology and mechanical properties of the nanocomposites were determined. The obtained results showed that the porosity of the nanocomposites increases from 10 to
49% with the increase of NH4 HCO3 porogen content from 0–30 wt%. However, their Young’s modulus decreased 78% in comparison with the nanocomposite without using NH4 HCO3 porogen. The
bioactivity of the nanocomposite with 20 wt% NH4 HCO3 porogen was evaluated by examining the
formation of hydroxyapatite (HAp) on its surface when being immersed in simulated body fluids
(SBF) solution. The in vitro degradation behavior of the nanocomposites immersed in the SBF solution at 37 C was systematically monitored at different time periods of 1, 3, 7, 14, 21 and 28 days.
SEM images showed the formation of hydroxyapatite on the surface of the nanocomposite after
1 immersion day in the SBF solution. The measurements of weight loss, pH solution, and XRD
of the samples indicated that PLA/md-HAp/PEO nanocomposite without NH4 HCO3 porogen was
degraded more slowly than the PLA/md-HAp/PEO nanocomposite with 20 wt% NH4 HCO3 porogen.
Keywords: Hydroxyapatite (HAp), Modified Doped Hydroxyapatite (md-HAp), Poly Lactic Acid
(PLA), Porogen, PLA/HAp Nanocomposite, Solvent Casting Method, Simulated Body
Fluids (SBF).
1. INTRODUCTION
Hydroxyapatite (Ca10 (PO4 6 (OH)2 , HAp) has been recognized as a promising bone substitute thanks to its chemical and biological similarities to the mineral phase of the
native bones. This bioceramic has been used for several
years for medical applications.1 2 However, HAp being
synthesized artificially did not have mechanical properties
which are necessary for applying in bone implants. One
of the solutions to solve the above problem is to develop
biocomposites such as HAp/metal, HAp/polymer3–5 which
have been widely used in medicine and stomatology for
the repair of bone tissue. HAp/polymer composite has
more advantages than original HAp or neat polymer.6
Polymer phase is able to have the same chemical composition as the polymer in bone tissue (collagen) but it could
be synthesized as well.2 5–10 So far, special attentions have
∗
Author to whom correspondence should be addressed.
J. Nanosci. Nanotechnol. 2015, Vol. 15, No. xx
been paid to biodegradable polymer applied in surgery and
bio-medicine in general.
Poly( -hydroxyesters) such as poly(lactic acid) (PLA),
poly(glycolic acid) (PGA) and their copolymers have been
widely used to fabricate different kinds of scaffolds in
tissue engineering because of their good biodegradability,
bio-compatibility and feasibility.11–17 However, there are
few problems when using these polymers for tissue engineering in practice. One of the limitations of these polymers is the lack of bioactivity so that the new bone tissue
cannot bond to the polymer surface tightly when they are
applied for the bone tissue engineering.4 Another problem is their high hydrophobicity.18 A previous study had
shown that the adhesion rate of human endothelial cells on
PLA is much lower than on the polystyrene. The reason is
the contact angle of PLA (71 ) is higher than that of the
polystyrene (35 ).19
Recently, nanocomposite of nano HAp and PLA
(PLA/HAp) has attracted much attention from researchers
1533-4880/2015/15/001/010
doi:10.1166/jnn.2015.12032
1
Effects of Porogen on Structure and Properties of PLA/HAp Nanocomposites (PLA/HAp)
because of their ability in replacing the metal and alloy
implants. Compared with HAp in the micron range,
the nano-HAp has a larger surface area which exhibits
enhanced mechanical properties due to the strong hydrogen bonding interactions between the nano-HAp and
PLA.20 21 The dispersion of HAp in the PLA matrix is
one of critical factors determining the properties of the
PLA/HAp nanocomposite. There are many methods to
fabricate this composite such as emulsion method, melt
mixing, high pressure processing, electrospinning, solvent casting method which have their own advantages
and disadvantages.22–24 The solvent casting method is the
facility of preparation and operation without any specialized equipment. Fabrication of PLA/HAp nanocomposite by the solvent casting method has been developed
by many researchers.25–27 In order to be applied in bone
implant, PLA/HAp nanocomposite needs to have compatibly mechanical stability, mechanical strength and highly
open porous structure which are necessary to develop tissue fluids; the size and distribution of pore should be
suitable for cell in-growth.28–30 Several techniques have
been developed to fabricate porosity materials, including
porogen leaching,31–35 gas expansion,36 emulsion freezedrying,37 thermally induced phase separation38–41 and 3Dprinting,42 43 etc. Compared with other techniques, the
porogen leaching technique controls pore structure easily
and has been well established in the preparation of porous
nanocomposite. Xu et al. fabricated composite scaffolds
for application in bone engineering from poly(D,L-lactide)
(PDLLA) incorporate with different proportional bioactive wollastonite powders through a salt-leaching method,
using NH4 HCO3 as porogen.44 In vitro bioactivity of
PLA/HAp nanocomposites can be evaluated by immersing
the material in saline,45 phosphate buffered saline (PBS)46
and the simulated body fluids (SBF).34 47 48
In this study, the porous PLA/HAp nanocomposites
with different contents of NH4 HCO3 porogen were prepared by the solvent casting method. The characterization, properties including IR spectra, water contact angle,
tensile property, porosity morphology and phase structure
of the nanocomposites were investigated. The formation
of HAp on the surface of the nanocomposites immersed
in the SBF solution and their weight change were also
discussed.
2. MATERIALS AND METHODS
2.1. Materials
Poly lactic acid (PLA) was provided by Nature
Works-USA (weight-average molecular weight Mw =
250 105 g/mol, density d = 1 24 g/cm3 ). Poly(ethylene
oxide) (PEO) was provided by Sigma Aldrich (average molecular weight Mw = 105 g/mol). Calcium nitrate
tetrahydrate (Ca(NO3 2 · 4H2 O, M = 236 15 g/mol, 99%
pure), magnesium nitrate hexahydrate (Mg(NO3 2 · 6H2 O,
2
Thanh et al.
M = 256 41 g/mol, 99% pure), zinc nitrate hexahydrate (Zn(NO3 2 · 6H2 O, M = 297 49 g/mol, 99%
pure), diammonium hydrogen phosphate ((NH4 2 HPO4 ,
M = 132 06 g/mol, 99% pure), ammonium bicarbonate
(NH4 HCO3 , M = 79 06 g/mol), tetrahydrofuran (THF,
C4 H8 O, M = 74 12 g/mol, 95.5% pure), lactic acid
(C3 H6 O3 , M = 90 08 g/mol, 85.5–90% pure), xylene
(C8 H10 , M = 106 17 g/mol, 99% pure) were purity materials of China.
2.2. Preparation of Doped HAp
The nano-spherical HAp powder doped with magnesium
and zinc (d-HAp: 13–22 nm) was synthesized by the
chemical precipitation method at room temperature. The
(NH4 2 HPO4 aqueous solution was added drop by drop
into [0.4 M Ca(NO3 2 · 4H2 O, 0.05 M Mg(NO3 2 · 6H2 O,
0.05 M Zn(NO3 2 · 6H2 O] aqueous solution (the ratio
Ca/Mg/Zn of 9/0.5/0.5) at a rate of 1 ml · min−1 during 2 h
under strong stirring (750 rpm). The M/P ratio was 1.67
(M = Ca, Mg, Zn). The pH of the mixture solution was
adjusted to 10 by adding NH4 OH solution. The process
was performed within 2 h by stirring, then within 24 h
without stirring at room temperature. The precipitate was
washed for several times with distilled water to pH 7. The
obtained doped-HAp powder (d-HAp) was dried at 80 C
for 48 h.
2.3. Preparation of Modified Doped HAp
The reaction system was prepared as following: 20 g of
d-HAp powder was dispersed in 70 ml THF via stirring, heating to 65 C. Lactic acid (LA) was added
drop by drop into the above reaction mixture system for
30 minutes (d-HAp/LA = 1/2 wt/wt) and then 180 ml of
xylene was added. The resulted suspension was heated to
150 C and stirred for 8 h. Then, the modified doped HAp
(note md-HAp) was obtained through filtering and being
washed with ethylene ether for several times to remove the
adsorbed solvent on md-HAp.
2.4. Fabrication of PLA/md-HAp/PEO
Nanocomposites
The PLA/md-HAp/PEO nanocomposites were made by the
solvent casting method. The md-HAp, PEO and NH4 HCO3
powders were dispersed in 30 ml dichloromethane (DCM)
by stirring in 30 minutes. Ammonium bicarbonate salt
(NH4 HCO3 ) was used as a porogen at different contents
(0, 3, 7, 10, 20 and 30 wt%). The PLA was dissolved
in 70 ml DCM in 30 minutes. And then, combining two
above mixtures together by stirring (110 rpm) during 2 h,
to form a gel paste mixture. The gel paste mixture was
then put into a die (4 × 5 cm) and compressed at a pressure of 10 MPa for 2 minutes at room temperature. After
that, the above die was put into vacuum and dried at room
temperature for 24 h, and then continuously dried at 80 C
within 24 h to remove the porogen.
J. Nanosci. Nanotechnol. 15, 1–10, 2015
Thanh et al.
Effects of Porogen on Structure and Properties of PLA/HAp Nanocomposites (PLA/HAp)
–C=O
% = m2 − m1 / m3 + m2 − m4 · 100
3500
3000
2500
2000
1500
610
563
1055
1465
1767
PLA/HAp/PEO
1000
500
Wave number (cm–1)
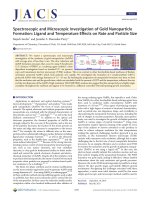
Figure 1. FT-IR spectra of PLA, md-HAp and PLA/md-HAp/PEO
(70/30/5 wt/wt/wt) nanocomposite.
2.5. Porosity of PLA/md-HAp/PEO Nanocomposite
Porosity of the porous material was determined by the
Archimedes’ method with an absolute ethanol as the
immersion medium. The specimens were dried at 80 C
within 2 h before being tested. The dried sample was
weighed as m1 . All the air in specimens were removed
by a vaccum pump. After that, the specimens were totally
submerged in the absolute ethanol. The liquid saturated
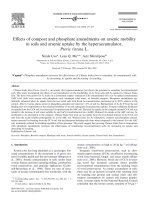
Figure 2.
specimen was weighed as m2 . A pycnometer filled with
ethanol was weighed as m3 . Then, the liquid-saturated
sample was put in filled pycnometer, m4 is the weight of
the liquid-saturated sample after taken out of the liquid.
The open porosity obtained by:
OH
OH
4000
PO43–
1061
–CH
1457
1761
md–HAp
3002
2955
Transmittance (%)
2995
2930
PLA
2.6. Test In Vitro
The in vitro degradation properties of the samples were
evaluated in the simulated body fluids (SBF). In order
to prepare 1 litre of the SBF solution, 8 g NaCl;
0.35 g NaHCO3 ; 0.4 g KCl; 0.48 g Na2 HPO4 · 2H2 O;
0.1 g MgCl2 · 6H2 O; 0.18 g CaCl2 · 2H2 O; 0.06 g KH2 PO4 ;
0.1 g MgSO4 · 7H2 O and 1 g glucoza were dissolved in
distilled water. The pH of the SBF solution is 7.4 (this
value is in the pH range of the human body fluids pH =
7.35–7.45).49–51 The samples of PLA/md-HAp with and
without NH4 HCO3 were immersed in the cell containing
40 ml SBF, and kept at 37 C, during different immersion
times: 1, 3, 7, 14, 21 and 28 days. These samples were
gently rinsed with distilled water before being dried within
24 h at 80 C. The measurement of weight loss, pH and
SEM images of these samples were determined.
The mass of PLA/md-HAp/PEO nanocomposites with
and without porogen were determined by Precisa XR 205
SM-DR analysis balance. The pH value of the SBF solution was measured by using pH3110 Meter.
(a)
(b)
(c)
(d)
SEM images of nanocomposites with the different PLA/md-HAp ratios: (a) 80/20, (b) 70/30, (c) 60/40 and (d) 50/50 (wt/wt).
J. Nanosci. Nanotechnol. 15, 1–10, 2015
3
Effects of Porogen on Structure and Properties of PLA/HAp Nanocomposites (PLA/HAp)
(a)
2000
(b) 55
PLA
50
Tensile strength / MPa
E Modulus / MPa
1800
1600
1400
1200
1000
800
600
80/20
70/30
60/40
400
200
Thanh et al.
50/50
PLA
45
40
35
30
25
80/20
20
70/30
60/40
15
50/50
10
5
0
0
Figure 3. The mechanical properties: (a) Young’s modulus and (b) tensile strength of PLA and PLA/md-HAp/PEO nanocomposites with the different
ratios of PLA/md-HAp.
2.7. FT-IR
FT-IR spectra analysis for PLA, md-HAp and PLA/mdHAp/PEO nanocomposite is used to determine characteristic groups of their molecules. The FTIR spectra of the
samples were recorded by using Nicolet/Nexus 670 Spectrometer (USA) at room temperature by averaging 16 scans
with a resolution of 4 cm−1 in transmission mode by using
KBr pellet method. The FT-IR spectra were recorded in
the wave numbers range from 400 to 4000 cm−1 .
2.8. Scanning Electron Microscopy (SEM)
The surface of PLA/md-HAp/PEO nanocomposites was
examined by using Hitachi S-4800 Scanning Electron
Microscope (SEM).
2.9. X-ray Diffraction
The phase structure of PLA/md-HAp/PEO with and without NH4 HCO3 porogen after 7 immersion days in the
SBF solution were analyzed by X-ray Diffraction (XRD)
(Siemens D5000 Diffractometer, CuK radiation ( =
1 54056 Å) with step angle of 0.030 , scanning rate of
0.04285 s−1 , and 2 degree in range of 10–60 .
2.10. Mechanical Properties
The mechanical properties (Young’s modulus and tensile strength) of PLA, PLA/md-HAp/PEO nanocomposites with and without porogen were measured by using a
Zwick-Tensile Tester at room temperature with crosshead
speed of 100 mm/min, the dumbbell shaped specimens and
the measurements were carried out according to ASTM
D638.
2.11. Hydrophilicity or Hydrophobicity
Determination
The hydrophilicity or hydrophobicity of PLA and
PLA/md-HAp/PEO nanocomposites with and without
NH4 HCO3 porogen were evaluated through the measurement of water contact angles. Each determination was
obtained by averaging the results of five measurements.
4
Water contact angle measurements were performed by
using a SEO Phoenix 150 Contact Angle Analyzer.
3. RESULTS AND DISCUSSION
3.1. Influence of md-HAp Content on the
Morphology and Mechanical Properties of
PLA/md-HAp Nanocomposites
The Figure 1 presented the FT-IR spectra of PLA,
md-HAp and PLA/md-HAp/PEO nanocomposite (70/30/5
wt/wt/wt). All characteristic peaks of md-HAp (PO3−
4 ,
OH− , CO2−
O) were appeared in PLA/md3 ) and PLA (C
HAp/PEO nanocomposite:
(i) characteristic peaks of md-HAp (PO3−
4 ) at 560, 607,
1061 cm−1 moved back to 563, 610, 1095 cm−1 in
the nanocomposite. The –CH vibration peaks in PLA
(1457 cm−1 ) and in the nanocomposite (1465 cm−1 ) also
shifted. It indicates the molecular interaction between mdHAp and PLA in the nanocomposite.
(ii) In the nanocomposite, the vibration of the liaison
–C O of neat PLA at 1761 cm−1 shifted to 1767 cm−1 .
This movement may be attributed to the formation of
hydrogen bonding between the –OH of md-HAp and
–C O of PLA.
Scanning electron microscopy (SEM) was used to
observe the surface morphology of PLA/md-HAp/PEO
nanocomposites with using 5 wt% of PEO and the different ratios of PLA/md-HAp: 80/20, 70/30, 60/40 and 50/50
(wt/wt) (Fig. 2). The content of HAp plays an important
Table I. The variation of porosity of PLA/md-HAp/PEO nanocomposites versus NH4 HCO3 porogen content.
Porogen content (wt%)
0
3
7
10
20
30
Porosity (%)
10
12
18
33
39
49
J. Nanosci. Nanotechnol. 15, 1–10, 2015
Thanh et al.
Effects of Porogen on Structure and Properties of PLA/HAp Nanocomposites (PLA/HAp)
role in controlling the morphology of PLA/md-HAp/PEO
nanocomposites. With 20 wt% and 30 wt% of md-HAp,
md-HAp powder was dispersed more regularly in PLA
matrix. Higher amounts of md-HAp (40 and 50 wt%)
might cause the aggregation of md-HAp particles in PLA.
However, in order to apply in bone implants, the large
content of HAp is good for biocompatibility, therefore,
30 wt% of md-HAp has been chosen for following studies.
The Young’s modulus of PLA/md-HAp/PEO nanocomposites decreased with the increase of md-HAp content
(Fig. 3). The Young’s modulus was 1806 ± 51 MPa with
neat PLA sample; while the Young’s modulus of the
nanocomposite dropped to the value of 593 ± 52 MPa with
20 wt% md-HAp added (down more than 67%). When
the md-HAp content is 50%, the Young’s modulus of the
nanocomposite was only 115 ± 42 6 MPa (a decrease of
over 93%). The tensile strength of the nanocomposites was
deduced similarly to the Young’s modulus.
3.2. Influence of Porogen Content on the Porosity,
Morphology and Mechanical Properties of
PLA/md-HAp/PEO Nanocomposites
The content of the porogen (NH4 HCO3 ) influenced on
the porosity of the PLA/md-HAp/PEO nanocomposites.
As seen in Table I, the open porosity of the nanocomposites increased with the increase of NH4 HCO3 porogen
(a)
(b)
(c)
(d)
(e)
(f)
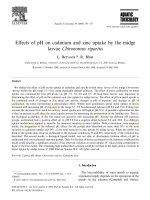
Figure 4. SEM images of PLA/md-HAp/PEO nanocomposites with NH4 HCO3 different porogen content: (a) 0 wt%, (b) 3 wt%, (c) 7 wt%, (d) 10 wt%,
(e) 20 wt% and (f) 30 wt%.
J. Nanosci. Nanotechnol. 15, 1–10, 2015
5
Effects of Porogen on Structure and Properties of PLA/HAp Nanocomposites (PLA/HAp)
(b) 24
(a) 800
PLA/HAp/PEO/NH4HCO3
70/30/5/x wt/wt
E Modulus / MPa
0%
500
3%
7%
10 %
20 %
400
300
200
30 %
100
0
PLA/HAp/PEO/NH4HCO3
70/30/5/x wt/wt
22
Tensile strength / MPa
700
600
Thanh et al.
20
0%
3%
18
7%
10 %
16
20 %
14
12
30 %
10
8
6
4
2
0
Figure 5. The (a) Young’s modulus and (b) tensile strength of PLA/md-HAp/PEO nanocomposites without and with 3, 7, 10, 20 and 30 wt%
NH4 HCO3 porogen content.
content. The open porosity was only 12% when the
porogen content was 3 wt%, while it reached 49% at
30 wt% of porogen content. Without using NH4 HCO3
in the nanocomposites, the porosity of the nanocomposite was 10% because md-HAp nano powder itself
also has the ability to increase the porosity of the
nanocomposites.53 During the fabrication of nanocomposite, NH4 HCO3 molecules were uniformly distributed in the
samples. At 80 C, NH4 HCO3 was degraded to form air
pores with small size (Fig. 3). When drying at 80 C within
24 h, NH4 HCO3 in the nanocomposite was decomposed
to form CO2 and NH3 gas (Fig. 3). With high amounts
of the porogen (20, 30 wt%), a part of generated gas was
compressed inside of the nanocomposite and a rest generated gas was able to release out the surface to form high
porosity of the nanocomposite. However, the high porosity
of the nanocomposite was able to destroy the structure in
size and reduced tensile properties of the nanocomposites.
In the case of low porogen content (3, 7%), the generated
gas still exist mainly in the nanocomposite by compressing
and only a little generated gas was able to release out.
The SEM images of the nanocomposites with different
contents of NH4 HCO3 porogen were shown in Figure 4.
In absence of NH4 HCO3 porogen, the PLA/md-HAp/PEO
nanocomposites still have porous structure (Fig. 4(a)). The
porosity of this nanocomposite was nearly constant at
low content of NH4 HCO3 porogen (3 or 7 wt%) but it
increased significantly when the NH4 HCO3 porogen content was up to 10, 20, 30 wt%. In the nanocomposite, HAp
interacts with PLA by hydrogen bonds and NH4 HCO3
porogen with low and high content was dispersed in the
nanocomposite. When drying the nanocomposite at 80 C
within 24 h, NH4 HCO3 was decomposed to form CO2 and
NH3 and pore size of the nanocomposite changed from
small to high depending on NH4 HCO3 porogen content as
above explained.
The effect of NH4 HCO3 porogen content on mechanical
properties of the nanocomposites was also studied. As seen
in Figure 5, Young’s modulus and tensile strength of the
nanocomposite decreased when porogen content increased.
6
For the samples without and with low porogen content
(3 or 7 wt%), the Young’s modulus and tensile strength
changed not much, in agreement with determination results
of the porosity of the nanocomposites. The Young’s modulus of the nanocomposites decreased from 549 ± 54 MPa
(sample without porogen) to 421 ± 49 and 400 ± 50 MPa
for the sample having the porogen content of 10 and
20 wt%, respectively. Specially, with the nanocomposite
using 30 wt% porogen content, the Young’s modulus of the
nanocomposites was only 120 ± 39 MPa, which decreased
about 78% compared with PLA/md-HAp/PEO nanocomposite without porogen. Therefore, component ratio of
PLA/md-HAp/PEO = 70/30/5 with 20 wt% NH4 HCO3
porogen content was chosen to test in vitro bioactivity
of the nanocomposite in the simulated body fluids (SBF)
solution.
The hydrophilicity or hydrophobicity of PLA and
PLA/md-HAp/PEO nanocomposites with and without
porogen were evaluated by measuring the water contact
angle (Table II).
Table II demonstrated the measurement results of water
contact angle of surfaces of neat PLA and PLA/mdHAp/PEO nanocomposites with and without 20 wt%
NH4 HCO3 porogen. The water contact angle of neat
PLA is 83.1 ± 2.9 ,3 and its high value shows that PLA
is a hydrophobic polymer. PLA/md-HAp/PEO (70/30/5)
nanocomposite has water contact angle of 63.7 which
is lower than that of neat PLA because md-HAp powder is hydrophilic and it also increased the porosity
of the nanocomposite.9 In the presence of 20 wt%
Table II. Water contact angle of PLA, PLA/md-HAp/PEO and
PLA/md-HAp/PEO nanocomposites with 20 wt% NH4 HCO3 porogen.
Samples
Water contact angles (degrees)
PLA
PLA/md-HAp/PEO (70/30/5)
PLA/md-HAp/PEO (70/30/5)
with 20 wt% NH4 HCO3
83 1 ± 2 9
63 7 ± 1 9
50 6 ± 1 9
J. Nanosci. Nanotechnol. 15, 1–10, 2015
Thanh et al.
Effects of Porogen on Structure and Properties of PLA/HAp Nanocomposites (PLA/HAp)
(1)
(3)
Water contact angle images of (1) PLA, PLA/md-HAp/PEO nanocomposites (2) without and (3) with 20 wt% NH4 HCO3 porogen.
NH4 HCO3 porogen, water contact angle of the nanocomposite decreased to 50.6 compared to nanocomposite
without porogen (63.7 ) due to the increase of the porosity
of the nanocomposite (Fig. 6). This result indicated that
the incorporation of HAp and NH4 HCO3 into hydrophobic polymers is a feasible approach to improve the
hydrophilicity of the hydrophobic polymer.
3.3. In Vitro Bioactivity of PLA/md-HAp/PEO
Nanocomposites With and Without 20 wt%
NH4 HCO3 Porogen in Simulated Body Fluids
(SBF) Solution
The in vitro degradation of PLA as well as the formation of
HAp on/in PLA/md-HAp/PEO nanocomposites with and
without 20 wt% NH4 HCO3 porogen into the SBF solution
were evaluated by the variation of the pH of the SBF solution. When nanocomposites were immersed into the SBF
solution, there are two processes occurring simultaneously:
the first process is hydrolysis of PLA expressed by two
Eqs. (1) and (2) to generate acid lactic, and release H+ ion;
the second process is the formation of HAp, which consumes OH− ion. Both of processes reduced pH of the SBF
solution. The formation of HAp can be explained as following: the hydrolysis of PLA released H+ ion, leading to
the dissolution of HAp. The calcium ions dissolved from
the HAp increased the calcium ion concentration in the
surrounding SBF, which was already supersaturated with
respect to apatite; and the nancomposite surfaces provided
favorable sites for apatite nucleation. As a result of SEM,
a large number of apatite nuclei formed on nanocomposite
surfaces, grew spontaneously, and consumed the calcium
and phosphate ions from the surrounding fluid.54
Ka
RCOOH −→ RCOO− + H+
(1)
time, at 37 C. The pH value of the solution
before soaking nanocomposites is 7.4. During the
immersion time, the pH of the SBF solution containing PLA/md-HAp/PEO nanocomposites with and without NH4 HCO3 porogen decreased but the pH of the
SBF solution containing PLA/md-HAp/PEO nanocomposite with 20 wt% NH4 HCO3 porogen decreased more
strongly (39%) because PLA/md-HAp/PEO nanocomposite with NH4 HCO3 porogen (39%) has higher porosity
than PLA/md-HAp/PEO nanocomposite without porogen
(10%). Therefore, water molecules easily permeate into
PLA/md-HAp/PEO nanocomposite with NH4 HCO3 porogen and the contact surface area of the nanocomposite with
the SBF solution become higher.
The variation of weight of PLA/md-HAp/PEO
nanocomposites with and without NH4 HCO3 porogen
during immersion time was displayed in Figure 8. The
weight of the above nanocomposites decreased strongly
after 7 and 3 immersion days. It indicated that the decomposition of PLA in the nanocomposites happened strongly
than the formation of HAp crystals. And then, the weight
of the nanocomposites increased continuously with 28
immersion days. It is clear that the formation of HAp
crystals on/in the nanocomposites increased significantly.
This can be explained by the formation HAp crystals
7.4
7.2
7.0
pH
Figure 6.
(2)
6.8
6.6
2
6.4
1
6.2
(2)
−
10Ca2+ + 6HPO2−
4 + 8OH
−→ Ca10 PO4
6
OH 2 + 6H2 O
0
(3)
Figure 7 showed the pH values of the SBF solution
when immersing nanocomposites at different immersion
J. Nanosci. Nanotechnol. 15, 1–10, 2015
6.0
3
6
9
12 15 18 21 24 27 30
Time (day)
Figure 7. The pH variation of SBF solution according to immersion
time of PLA/md-HAp/PEO nanocomposites (1) with and (2) without
20 wt% NH4 HCO3 porogen.
7
Effects of Porogen on Structure and Properties of PLA/HAp Nanocomposites (PLA/HAp)
0.0010
1
0.0005
2
∆m(g)
0.0000
–0.0005
–0.0010
–0.0015
–0.0020
–0.0025
0
3
6
9
12 15 18 21 24 27 30
Time (day)
Figure 8. The variation of weight of PLA/md-HAp/PEO nanocomposites (1) with and (2) without NH4 HCO3 porogen according to immersion
time in SBF solution.
on/in the pore that will prevent hydrolysis process of PLA
in the SBF solution.
Figure 9 displayed images of PLA/md-HAp/PEO
nanocomposites with 20% NH4 HCO3 which was
immersed in the SBF solution during 0, 1, 3, 7, 14, 21
Thanh et al.
and 28 days. The sample after 1 immersion day appeared
HAp nucleation crystals. After 3 or 7 immersion days,
HAp crystals grew with higher density. The surface of the
nanocomposites nearly covered fully with HAp crystals
after 14, 21 or 28 immersion days in the SBF solution.
Specially, with the sample immersed during 28 days
in the SBF solution, HAp crystals grew up to form a
thicker block and it showed the degradation of PLA in the
nanocomposite.
Figure 10 performed the XRD patterns of PLA/mdHAp/PEO nanocomposites before being immersed in
the SBF solution; PLA/md-HAp/PEO without and with
NH4 HCO3 porogen after 7 immersion days in the
SBF solution. The XRD pattern of PLA/md-HAp/PEO
nanocomposite before being immersed in the SBF solution
expressed that PLA in the nanocomposite is a semicrystalline polymer (Fig. 10(1)). Besides that, in the XRD patterns, there were two characteristic peaks of HAp at 2
degree = 25,84 and 31,93 . The diameter of HAp crystals
in PLA/HAp nanocomposite based on the Scherrer equation at 2 25.84 is 19.87 nm.
The XRD patterns of PLA/md-HAp/PEO nanocomposites with and without NH4 HCO3 porogen after 7 immersion days (Fig. 10(2) and 10(3)) performed the appearance
(a)
(b)
(c)
(d)
(e)
(f)
(g)
Figure 9. SEM images of PLA/md-HAp/PEO (70/30/5) nanocomposites with 20 wt% NH4 HCO3 porogen at the different immersion times in SBF
solution: (a) 0, (b) 1, (c) 3, (d) 7, (e) 14, (f) 21 and (g) 28 immersion days.
8
J. Nanosci. Nanotechnol. 15, 1–10, 2015
Thanh et al.
and the degradation of PLA/md-HAp/PEO nanocomposites with and without NH4 HCO3 porogen in the SBF
solution showed the formation of the HAp on the surface
of the nanocomposites and the hydrolysis process of PLA
after being immersed in the SBF solution. These porous
nanocomposites are promising potential applications for
bone implant.
16.46
600
500
Effects of Porogen on Structure and Properties of PLA/HAp Nanocomposites (PLA/HAp)
200
3
32.14
300
25.89
18.99
400
0
600
500
16.55
400
200
25.89
300
31.97
2
18.99
Acknowledgments: The authors gratefully acknowledge the Ministry of Science and Technology of
Vietnam for financial support through the Bilateral Project
Vietnam—Korea number 49/2012/HD-NDT.
100
25.89
0
200
180
160
140
120
100
80
60
40
20
31.93
Intensity (au)
100
1
References and Notes
10
20
30
40
50
60
2θ (degree)
Figure 10. XRD patterns: (1) PLA/md-HAp/PEO nanocomposite
before immersing, PLA/md-HAp/PEO (2) without and (3) with
NH4 HCO3 porogen after 7 immersion days in SBF solution.
of 2 characteristic peaks for crystal structure of PLA at
2 degree were about 16,5 and 18,9 .55 After 7 immersion days in the SBF solution, PLA amorphous part in
the nanocomposites was hydrolysed and PLA crystal part
remained. And two characteristic peaks of HAp at about
2 degree = 25,89 and 31,94 were also shown in these
patterns. However the intensity of the characteristic peaks
of PLA crystal in PLA/md-HAp/PEO nanocomposite with
NH4 HCO3 porogen was higher than that in the nanocomposite without NH4 HCO3 porogen. This was able to be
explained as following: PLA/md-HAp/PEO nanocomposite with 20 wt% NH4 HCO3 porogen was more porous
than PLA/md-HAp/PEO nanocomposite (Fig. 4), so amorphous PLA part was hydrolysed more strongly, crystal PLA dominated and the formation of HAp became
easily. The formation of HAp after being immersed in
the SBF was exhibited by the intensity of the characteristic peaks of HAp in the nanocomposite which was
arranged as following order: PLA/md-HAp/PEO before
being immersed < PLA/md-HAp/PEO without NH4 HCO3
porogen after 7 immersion days < PLA/md-HAp/PEO with
20 wt% NH4 HCO3 porogen after 7 immersion days.
4. CONCLUSION
PLA/md-HAp/PEO porous nanocomposites using
NH4 HCO3 porogen was prepared by the solvent
casting method. The incorporation of md-HAp and
NH4 HCO3 porogen greatly improved the porosity and the
hydrophilicity of the nanocomposites. The porosity of the
nanocomposites increased and their mechanical properties
decreased with the increase of NH4 HCO3 porogen content.
The results of characterisations, properties, morphology
J. Nanosci. Nanotechnol. 15, 1–10, 2015
1. J. L. Katz and R. A. Harper, Encyclopedia of Materials Science and
Engineering, edited by M. B. Bever, Pergamon Press, Oxford (1986),
p. 475.
2. G. Hienderauer, T. McGee, and R. Kudej, Ceramic Bulletin 70, 1010
(1991).
3. J. Li, B. Fartash, and L. Hermanson, Biomaterials 16, 417 (1995).
4. R. Labella, M. Braden, and S. Deb, Biomaterials 15, 1197 (1994).
5. L. Hench, J. Am. Ceram. Soc. 74, 1487 (1991).
6. M. Wang, S. Deb, K. Tanner, and W. Bonfield, Proc. 7th European
Conf. on Composite Materials, London (1996), p. 455.
7. P. Tormala, Adv. Mater. 4, 589 (1992).
8. Ch. Ristich, M. Plavsic, M. Goosen, L. Sajc, D. Antonovic, and
B. Bugarski, J. Serb. Chem. Soc. 61, 311 (1996).
9. U. Ripamonti and N. Duneas, MRS Bulletin 21, 36 (1996).
10. L. Rodrigues-Lorenzo, A. Salinas, M. Vallet-Regi, and J. SanRoman, J. Biomed. Mater. Res. 30, 515 (1996).
11. H. H. Lu, S. F. El-Amin, K. D. Scott, and C. T. Laurencin, J. Biomed.
Mater. Res. 64(A), 465 (2003).
12. S. L. Ishaug-Riley, G. M. Crane-Kruger, M. J. Yaszemski, and A. G.
Mikos, Biomaterials 19, 1405 (1998).
13. H. Lo, S. Kadiyala, S. E. Guggino, and K. W. Leong, J. Biomed.
Mater. Res. 30, 475 (1996).
14. L. F. Charles, E. R. Kramer, M. T. Shaw, J. R. Olson, and M. Wei,
Journal of the Mechanical Behavior of Biomedical Materials 17, 269
(2013).
15. T. Kasuga, Y. Ota, M. Nogami, and Y. Abe, Biomaterials 22, 19
(2000).
16. K. Rezwan, Q. Z. Chen, J. J. Blaker, and A. R. Boccaccini, Biomaterials 27, 3413 (2006).
17. J. Li, Y. Chen, A. F. T. Mak, R. S. Tuan, L. Li, and Y. Li, Acta
Biomaterialia 6, 2013 (2010).
18. A. G. Mikos, M. D. Lyman, L. E. Freed, and R. L. Langer, Biomaterials 15, 55 (1994).
19. W. Cheng, H. Li, and J. Chang, Mater. Lett. 59, 2214 (2005).
20. J. Ren, P. Zhao, T. B. Ren, S. Y. Gu, and K. F. Pan, J. Mater. Sci.Mater. Med. 19, 1075 (2008).
21. S. B. Zhou, X. T. Zheng, X. J. Yu, J. X. Wang, J. Weng, X. H. Li,
et al., Chem. Mater. 19, 247 (2007).
22. L. Chen, C. Y. Tang, D. Z. Chen, C. T. Wong, and C.P. Tsui, Compos.
Sci. Technol. 71, 1842 (2011).
23. T. Kasuga, Y. Ota, M. Nogami, and Y. Abe, Biomaterials 22, 19
(2001).
24. A. Sonsec, L. Peponi, O. Sahuquillo, J. M. Kenny, and E. Giménez,
Polym. Degrad. Stab. 97, 2052 (2012).
25. C. Deng, J. Weng, X. Lu, S. B. Zhou, J. X. Wan, S. X. Qu, et al.,
Mater. Sci. Eng., C 28, 1304 (2008).
26. X. M. Deng, J. Y. Hao, and C. S. Wang, J. Biomed. Mater. Res. Part
A 94, 137 (2010).
9
Effects of Porogen on Structure and Properties of PLA/HAp Nanocomposites (PLA/HAp)
27. N. Aboudzadeh, M. Imani, M. A. Shokrgozar, A. Khavandi,
J. Javadpour, and Y. Shafieyan, et al., J. Biomed. Mater. Res. Part A
94, 137 (2010).
28. S. C. Rizzi, D. J. Heath, A. G. A. Coombes, N. Bock, M. Textor,
and S. Downes, J. Biomed. Mater. Res. 55, 475 (2001).
29. Wang, Biomaterials 24, 2133 (2003).
30. V. Karageorgiou and D. Kaplan, Biomaterials 26, 5474 (2005).
31. A. G. Mikos, M. D. Lyman, L. E. Freed, and R. Langer, Biomaterials
15, 55 (1994).
32. S. S. Kim, M. S. Park, O. Jeon, C. Y. Choi, and B. S. Kim, Biomaterials 27, 1399 (2006).
33. G. Chen, T. Ushida, and T. Tateishi, Biomaterials 22, 2563
(2001).
34. H. Maeda, T. Kasuga, and M. Nogami, Materials Transactions
45, 989 (2004).
35. C. Guo, X. Guo, N. Cai, and Y. Dong, Mater. Lett. 74, 197
(2012).
36. D. J. Mooney, D. F. Baldwin, N. P. Suh, J. P. Vacanti, and R. Langer,
Biomaterials 17, 1417 (1996).
37. K. Wang, C. H. Thomas, K. E. Healy, and G. Nuber, Polymer
36, 837, 13 (1995).
38. Y. S. Nam and T. G. Park, Biomaterials 20, 1783 (1999).
39. R. Zhang and P. X. Ma, J. Biomed. Mater. Res. 44, 446 (1999).
40. F. J. Hua, T. G. Park, and D. S. Lee, Polymer 44, 1911 (2003).
41. F. J. Hua, J. D. Nam, and D. S. Lee, Macromol. Rapid Commun.
22, 1053 (2001).
Thanh et al.
42. D. W. Hutmacher, J. Biomater. Sci., (Polym. Ed.) 1, 107 (2001).
43. M. J. Mondrinosa, R. Dembzynski, L. Lu, V. K. C. Byrapogu, D. M.
Wootton, P. I. Lelkes, and J. Zhou, Biomaterials 27, 4399 (2006).
44. L. Xu, Z. C. Xiong, D. Yang, L. F. Zhang, J. Chang, and C. D.
Xiong, J. Appl. Polym. Sci. 114, 3396 (2009).
45. X. Wang, G. Song, and T. Lou, Medical Engineering and Physics
32, 391 (2010).
46. M. Kavaavessina, F. Khanifatun, I. Ali, and S. M. Alzahrani,
Advanced Material Research 626, 631 (2013).
47. J. He, X. Yang, J. Mao, F. Xu, and Q. Cai, Appl. Surf. Sci. 258, 6823
(2012).
48. T. Tian, D. Jiang, J. Zhang, and Q. Lin, Mater. Sci. Eng., C 28, 51
(2008).
49. P. Jongwattanapisan, N. Charoenphandhu, N. Krishnamra,
J. Thongbunchoo, I. M. Tang, R. Hoonsawat, S. M. Smith, and W.
Pon-On, Mater. Sci. Eng., C 31, 290 (2011).
50. U. Turkan and M. Guden, Ceram. Int. 36, 1805 (2010).
51. M. S. Sadjadi, H. R. Ebrahimi, M. Meskinfam, and K. Zare, Mater.
Chem. Phys. 130, 67 (2011).
52. E. Nejati, H. Mirzadeh, and M. Zandi, Composites: Part A 39, 1589
(2008).
53. Q. Tan, S. Li, J. Ren, and C. Chen, International Journal of Molecular Sciences 12, 890 (2011).
54. R. Zhang and X. M. Peter, J. Biomed. Mater. Res. 45, 285 (1999).
55. E. Markocic, M. Skerget, and Z. Knez, J. Supercrit. Fluids 55, 1046
(2011).
Received: 27 February 2015. Acceptance: 10 June 2015.
10
J. Nanosci. Nanotechnol. 15, 1–10, 2015