Study on water allocation in river basin using linear programming a case study of vu gia thu bon river basin
Bạn đang xem bản rút gọn của tài liệu. Xem và tải ngay bản đầy đủ của tài liệu tại đây (1.93 MB, 84 trang )
TABLE OF CONTENTS
LIST OF FIGURES .................................................................................................................. 3
LIST OF TABLES .................................................................................................................... 4
ABSTRACT ............................................................................................................................... 5
DECLARATION ...................................................................................................................... 6
ACKNOWLEDGEMENTS ..................................................................................................... 7
CHAPTER 1 – INTRODUCTION .......................................................................................... 8
1.1. Problem Statement ......................................................................................................... 8
1.2. Objectives of Study ...................................................................................................... 10
1.3. Scope of Study .............................................................................................................. 11
1.4. Research Questions ...................................................................................................... 11
1.5. Vu Gia – Thu Bon River Basin ................................................................................... 12
1.5.1. Location ................................................................................................................... 12
1.5.2. Topographic Characteristics .................................................................................... 13
1.5.3. Rainfall Characteristics in the Dry Season .............................................................. 14
CHAPTER 2 – LITERATURE REVIEW ............................................................................ 19
2.1. Water Allocation Planning .......................................................................................... 19
2.2. Soil and Water Assessment Tool (SWAT) ................................................................. 27
2.2.1. Historical Development of SWAT Model ............................................................... 27
2.2.2. Theoretical Base and Applications of SWAT Model .............................................. 29
2.3. Linear Programming ................................................................................................... 39
CHAPTER 3 – APPLICATION OF SWAT......................................................................... 42
3.1. Input Data Processing .................................................................................................. 44
3.2. Sub-catchments Delineation ........................................................................................ 50
3.3. Reservoir Processing .................................................................................................... 52
3.4. Land Cover Scenario ................................................................................................... 55
CHAPTER 4 – APPLICATION OF LINEAR PROGRAMMING ................................... 58
1
4.1. Fundamental Theory Base .......................................................................................... 58
4.2. Water Demand Investigation ...................................................................................... 60
4.3. Water Price ................................................................................................................... 69
4.4. Results and Analysis .................................................................................................... 71
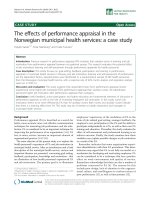
CHAPTER 5 – CONCLUSION AND RECOMMENDATION ......................................... 78
REFERENCES........................................................................................................................ 80
2
LIST OF FIGURES
Figure 1.1: Vu Gia – Thu Bon river basin ................................................................................ 12
Figure 1.2: Mean flow in the dry season of 1981-2010 periods............................................... 17
Figure 1.3: Low-flow module (Source: Water Resources Investigation and Assessment of
VGTB River Basin Project)....................................................................................................... 17
Figure 2.1: Basin water allocation agreements and plans in the twentieth century (Robert
Speed et al, 2013)...................................................................................................................... 20
Figure 2.2: Water allocation planning model in Western Australia ........................................ 21
Figure 2.3: Water resources planning framework in Vietnam ................................................. 24
Figure 2.4: Water resources planning solutions of Dong Nai case study ................................ 26
Figure 2.5: Water Resources Allocation Planning in Lang Son Province ............................... 27
Figure 2.6: Balance scheme of SWAT model ........................................................................... 31
Figure 2.7: Scheme of linear repositories in SWAT model ...................................................... 32
Figure 2.8: Underground reservoir .......................................................................................... 35
Figure 2.9: Reservoir of surface runoff .................................................................................... 36
Figure 3.1: Total water resources and water available for allocation (Robert Speed et al,
2013) ......................................................................................................................................... 43
Figure 3.2: Screen shot of official website of USGS ................................................................ 44
Figure 3.3: Screen shot of MODIS-based Global Land Cover Climatology............................ 45
Figure 3.4: Screen shot of FAO official website ...................................................................... 46
Figure 3.5: SWAT Model Simulation (Source: NASA-CASA Project) ..................................... 46
Figure 3.6: Land Cover Map .................................................................................................... 48
Figure 3.7: Soil Map ................................................................................................................. 49
Figure 3.8: Sub-catchments divided by SWAT model............................................................... 50
Figure 3.9: Final sub-catchments map ..................................................................................... 50
Figure 3.10: Monitoring locations ........................................................................................... 52
Figure 3.11: Edit Reservoir Parameters Table ........................................................................ 54
Figure 3.12: Land Use Update Edit tool .................................................................................. 56
Figure 3.13: Comparison between measurement and simulation in Nong Son ....................... 57
Figure 4.1: Water allocation in Upper Thu Bon basin in 2020 ............................................... 72
Figure 4.2: Water allocation in Lower Vu Gia - Thu Bon basin in 2020 ................................. 77
3
LIST OF TABLES
Table 1.1: Rainfall in the dry season, the three-lowest-month and the lowest month (mm) .... 14
Table 1.2: Low-flow characteristics of the VGTB River .......................................................... 16
Table 1.3: The lowest flow characteristics in the basin ........................................................... 18
Table 1.4: The lowest flow at some main locations in the river basin ..................................... 18
Table 3.1: Information of basin after overlay........................................................................... 47
Table 3.2: Sub-basins of VGTB basin ....................................................................................... 51
Table 3.3: Definitions of reservoir parameters ........................................................................ 53
Table 3.4: Technical parameters of reservoirs ......................................................................... 55
Table 4.1: Population of the urban area in 2020 ..................................................................... 60
Table 4.2: Water demand in municipality and town in 2020.................................................... 61
Table 4.3: Population of the rural area .................................................................................... 61
Table 4.4: Water supplied to rural domestic use ...................................................................... 62
Table 4.5: Water demand for domestic use in the VGTB river basin in 2020 .......................... 63
Table 4.6: Crop schedule of crops in the VGTB basin ............................................................. 63
Table 4.7: Water use criteria of crops ...................................................................................... 64
Table 4.8: Area of crop in the VGTB basin in 2020 ................................................................. 65
Table 4.9: Volume of water supplied to agricultural production in 2020 ................................ 65
Table 4.10: Quantity of cattle and avian in the VGTB basin in 2020 ...................................... 66
Table 4.11: The total water demand of sectors ........................................................................ 67
Table 4.12: Summary of inputs for Linear Programming ........................................................ 69
Table 4.13: Water allocation in Upper Thu Bon basin in 2020 ............................................... 71
Table 4.14: Water allocation in Upper Vu Gia basin in 2020 ................................................. 73
Table 4.15: Water allocation in Lyly River basin in 2020........................................................ 74
Table 4.16: Water allocation in Tuy Loan River basin in 2020 ............................................... 75
Table 4.17: Water allocation in Lower Vu Gia-Thu Bon basin in 2020 .................................. 76
4
ABSTRACT
Rivers are as a rule under expanding adverse pressures in view of fast changes of riparian
gimmicks.
These
progressions,
likely
including
increase
of
urbanization,
industrialization, overpopulation have made obvious dangers affecting on the wellbeing
of the nature and maintainable advancement. This overall pattern has moved the routine
methodology of researchers with respect to water allocation planning from
straightforwardness into more many-sided quality, considering the multi-viewpoints, for
example, environmental flow, financial profit streamlining or possible interest conflicts.
This Vu Gia - Thu Bon (VGTB) contextual analysis can be portrayed as a reaction to the
prerequisite of a cutting edge water allocation mechanism by applying the integrated
standards of water resources management and linear programming.
The fundamental objective of this study is to build an allocation planning for the VGTB
River basin. To come up with solutions, Soil Water Assessment Tool (SWAT) Model is
applied to assess the water availability in the basin and Excel Solver tool is utilized to
solve Linear Programming (LP) equations. A specific value of volume of water in the
basin is the most imperative component prompting the applicability of the allocation
results, an objective appraisal of water accessibility is extremely discriminating to
guarantee the met of demand and supply and additionally actualize the allocation results,
SWAT model is in charge of fathoming this undertaking. Use of LP is introduced by
building an objective function and relevant constraints; along these lines, Microsoft
Excel is utilized to solve the equations.
5
DECLARATION
I hereby certify that the work which is being presented in this thesis, entitled “Study on
Water Allocation in River Basin: A Case Study of Vu Gia - Thu Bon River Basin” in
partial fulfilment of the requirement for the award of the Master of Science in Integrated
Water Resource Management, is an authentic record of my own work carried out under
supervision of Assoc. Prof. Dr. Nguyen Cao Don and Dr. Bui Du Duong
The matter embodied in this thesis has not been submitted by me for the award of any
other degree or diploma.
Date: Hanoi, May 04, 2015
6
ACKNOWLEDGEMENTS
As a matter of first importance, I am thankful to the Netherlands Government for the
grant that encourage this study under The Netherlands Initiative for Capacity
improvement in Higher Education (NICHE). I wish to thank my head honcho, Hanoi
University of Natural Resources and Environment (HUNRE) for permitting personal
time to take a shot at this research and giving backing from numerous points of view
amid the study.
I might likewise want to augment my gratitude to Assoc. Prof. Dr. Nguyen Cao Don and
Dr. Bui Du Duong for tolerating to be my supervisors and for offering their mastery and
profitable time to me. They have tried to review and edit every section and assisted with
escalated direction for complex issues. This proposition would not have been
conceivable without their profitable direction, skill, recommendations and untiring
consolation. An exceptional note of much obliged must go to Assoc. Prof. Dr. Nguyen
Thu Hien, a dear speaker and organizer of NICHE Program. She is the key driver in
charge of molding this Master study and supporting understudies successfully amid the
course.
I might want to say thanks to Ms. Mariette van Tilburg from TU Delft for her
commitment of English amendment to this MSc study and Dr. Ilyas Masih from
UNESCO-IHE for calmly bearing my endless inquiries and remarks and giving me
significant addresses on water allocation planning. On account of the numerous
associates at the Faculty of Meteorology and Hydrology, Faculty of Water Resources,
HUNRE who helped me in different courses particularly amid field information
accumulation and meetings to generate new ideas.
I additionally need to express my true from the base of heart for companions for their
backings, empowers and advices. To wrap things up, I need to express my inherent
comprehension of my relatives, my adored mate for their unrestricted loves.
7
CHAPTER 1 – INTRODUCTION
1.1. Problem Statement
Issues existed in the VGTB basin can be depicted in both specific and general
manner. In general, perspectives building integrated watershed management in VGTB is
confronting comparative issues with different rivers in Vietnam: (1) the overlapping of
state administration causes snags in adding to the water resources planning strategy.
There are more than two ministries are included in dealing with river's and related assets,
this trademark is considered as one of the primary reasons delivering low applicability
of studies on water allocation planning. This characteristic makes the issues identified
with overexploitation, water quality or flow regime change becomes hazardous to
illuminate completely. Case in point, while Ministry of Natural Resources and
Environment (MoNRE) is responsible for overseeing water resources management,
hydraulic structures along the stream are been in charge of many other Ministries, for
example, Ministry of Agriculture and Rural Development (MARD) or Ministry of
Construction (MoC), this component makes the confusing in issuing regulations in
extracting water or discharge pollutants into the river between MoNRE and the others.
(2) Involvement of stakeholders in planning water resources allocation is not actively
taken into account and does not provide efficiency, especially citizens’ communities
living in the study area. In reality, committees organized in some basins nationwide do
not work effectively; linkage between administrative counties does not produce
management proficiency. The construction of industrial parks, dams in upstream and
increasing urbanization leads to increase of hazardous waste and pollution and
degradation of coastal areas, giving rise to conflicts in allocating downstream water
(Natural Resources and Environment Journal, 2014). Particularly, the most complicated
problem happening in the VGTB River basin is reservoirs’ regulation. To date, the basin
has 4 large hydropower projects and 820 irrigation works including 72 reservoirs, 546
spillways, and 202 pumping stations. Planned hydropower in mainstream of Vu Gia 8
Thu Bon up to 2020 proposes to build 10 hydropower plants with a total capacity of
1,200 MW. During the last decade, there are many studies on inundation and drought in
this area, saying that impacts of reservoirs are seriously severe (Nga, 2014). Natural
flooding becomes more extreme and difficult to predict due to man-made influences in
the upstream. Irrational management of storing and releasing water kept inside the
reservoir causes adverse impacts to the downstream such as salinity intrusion in 2012, at
Han estuary, inundation in 2009, at many places in Quang Nam (Nga, 2014).
Furthermore, use of reservoirs does not obey the ratified design; flood control volume is
reduced to satisfy the electricity generation demand (Natural Resources and
Environment Journal, 2014). This factor is considered as the main reason causing manmade and flash flood in the downstream. In fact, the process of operating reservoir
system in VGTB was issued by the Prime Minister since 2010; however, even the proper
operation of this process still does not guarantee the safety of citizens living in
downstream. The evidence is that after a series of incidents hydro flood, flooded
suddenly, causing loss of property and lives of the people downstream, for example in
2009 and the latest storm in October, 2013. Additionally, this issue also decreases the
accuracy in assessing water availability. Data regarding water temporally kept in the
reservoir do not have high confidence; this characteristic cannot be predicted by model.
This study supposes that flood discharge process is earnestly obeyed.
The VGTB river basin plays a particularly critical role in the socioeconomic
development strategy in the Central Coast. VGTB River system provides an important
source of water for the development needs of living, the economy of the province of
Quang Nam and Da Nang. In addition to hydropower potential, the VGTB also supplies
water for over 45,000 hectares of agricultural and domestic production for nearly 2
million people in the basin. Vu Gia River, especially as it passes through the city of Da
Nang plays a very important role for the socio-economic development of the city; annual
9
average of nearly 75 million m supply of raw water to water plants serving the people
living in cities and industrial areas, more than 100 million m3 of water for agriculture.
In addition to providing water for economic activities and livelihoods, the river also
serves as a climate control, creating beautiful landscapes, especially the passage to the
Han estuary. The provision of water resources ensures the sustainable development of
various sectors in the region. As a key central economic region, this area has seen a rapid
industrialization and development of many sectors. This feature has consequently
created serious stress for water resources of the basin, especially during the dry season
when stream water availability is significantly decreased. Currently, there are conflicts
between water users in this area when a series of dams were constructed in the upstream
area, causing water shortage for the downstream during the dry season. Furthermore, the
gap in economic yields between sectors also produces necessity of reallocating water
resources. The irrational allocation mechanism has decreased the total possible benefits
gained from industrial productions; while industry can provide a much larger water yield
compared with agricultural productions and livestock, the majority of water resources is
being supplied to agriculture. Accordingly, the study of the VGTB stream water
allocation is vitally important to ensure the optimization of water resources.
Based on the characteristics of the basin and management as above mention, a study of
resource allocation must be done to satisfy the integrated manner in management and
ensure technical factors as well as effective business. Linkage between using SWAT and
LP to compute allocation basing IWRM framework can be used when considering the
components of the hydrological cycle, the advocacy process of water on the basin and
crystal economic efficiency when allocating.
1.2. Objectives of Study
The overall objective of this study is to propose an optimal water allocation plan in
the Vu Gia - Thu Bon River basin. The specific objectives are as follows:
10
To calculate the total allocable water availability in the VGTB river basin;
To identify the water demands of sectors and water prices in the basin;
To build and mathematically solve the objective function and constraints
towards target of the study.
1.3. Scope of Study
The study focuses on the following issues:
Overview of previous studies on water allocation planning and linear
programming;
Application of hydrological model to calculate the water availability in the
study basin;
Application of linear programming to specify a water allocation mechanism
maximizing the revenue of supplier from the total available water volume.
1.4. Research Questions
The problem is now described as finding out an allocation mechanism for a limited
quantity of water meeting the target of gaining the highest benefit of supplier. To come
up with solutions, the study is going to answer the following questions:
How much water is available to allocate in the study area?
Which method is used to assess the allocable water availability in the study area?
And how to utilize this method?
How much water is required by sectors up to next five years basing on national
standard?
What is the highest number of earnings that water supplier can obtain from
accessible water allocated to sectors?
11
1.5. Vu Gia – Thu Bon River Basin
1.5.1. Location
Vu Gia - Thu Bon River system is located in the Central Coast Region of Vietnam with
10350 km2 total basin area, of which majority is belonged to Quang Nam Province and
Da Nang City while a small part is administrated by Kon Tum Province with 301.7 km2.
VGTB River basin (16o03’ - 14o55’ N; 107o15’ - 108o24’ E) is bounded on the North by
Cu De river basin; on the South by Tra Bong and Se San river basin; on the West by
Laos and on the East by East Sea and Tam Ky river basin.
Figure 1.1: Vu Gia – Thu Bon river basin
12
The VGTB river basin covers land of 17 administrative districts and cities of Kon Tum,
Quang Nam and Da Nang City, including Bac Tra My, Nam Tra My, Tien Phuoc, Phuoc
S n, Hiep Duc, Dong Giang, Tay Giang, Nam Giang, Que Son, Duy Xuyen, Dai Loc,
Dien Ban, Hoi An, Da Nang, Hoa Vang and part of Thang Binh, Dak Glei (Kon Tum).
1.5.2. Topographic Characteristics
The topography of the VGTB river basin is strongly fragmented and inclined west to
east, forming four main categories of terrain as follows:
Mountainous terrain: This nature covers most of the basin area with Truong Son
Mountains, having the elevation from 500m to 2000 m. The basin is delineated by the
mountains with peaks from 1000 m to 2000 m such as: Mang (1768m), Ba Na (1467m),
A Tuat (2500m), Lum Heo (2045m), Tien (2032m) in the upstream of Vu Gia River,
Ngoc Linh (2598m), Hon Ba (1358m) in the upstream of Tranh River, etc. The
mountains are initiated from Hai Van Pass on the North and shaped to the West, to the
Southwest and then to the South to form a bow wrapping around the basin. This specific
characteristic makes the basin easier to catch the Northeast monsoon wind and weather
patterns from the East Sea and produce heavy rain, cause of flash flood in the
mountainous areas and inundation in the lowland area.
Hilly terrain: Behind the mountainous area on the East is wavy hilly terrain with rounded
or fairly flat peaks, the slope is about 20 ÷ 30o. The elevation is gradually decreased
West to East, originated from the Northern territory of Tra My District to border on the
West of Duy Xuyen District. This area is the confluence of some comparatively large
tributaries of the Thu Bon main stream, including: Tranh, Truong, Tien, Lan, Ngon Thu
Bon, Khe Dien, Khe Le.
Lowland terrain: Elevation of plains in the VGTB river system is lower than 30 m with
relatively flat and homogeneous terrain, concentrating mainly on the East of the basin.
13
Furthermore, because of the adjacent trend to the coast of mountains, plain is narrow and
runs along the North – South direction. This lowland terrain is formed by convergence
of ancient alluvial sediment and silt deposits of the sea, rivers, streams and covers the
districts of Dai Loc, Duy Xuyen, Dien Ban, Thang Binh, Hoi An, Tam Ky and Hoa Vang.
There are some small rivers in this area such as: Khe Cong, Khe Cau, Quang Hue.
Coastal sand terrain: Coastal areas comprise sand dunes originated offshore. Sand is
driven ashore to the West by wind and produces hundreds of kilometers wavy sand dunes
along the coast.
1.5.3. Rainfall Characteristics in the Dry Season
Dry season in VGTB River basin begins in January and endures until August with the
total mean rainfall takes 30% amount of the total annual rainfall. Three months having
the most reduced rainfall density (hereinafter alluded to as three-lowest-month) are
February, March and April. Rainfall is most lessened in February at Vu Gia River basin
and in March at Thu Bon River basin, taking 1% of the total annual rainfall.
Table 1.1: Rainfall in the dry season, the three-lowest-month and the lowest month (mm)
Season
No.
Station
Three-lowest-month
Lowest month
Xannual
X
%
X
%
X
%
1
Hien
2144
868
40.5
84.5
3.9
20.5
1.0
2
Kham Duc
2892
588
20.3
118
4.1
24.1
0.8
3
Thanh My
2274
950
41.8
91
4.0
19.4
0.9
4
Hoi Khach
2212
864
39.0
95.5
4.3
23.3
1.1
5
Ai Nghia
2311
654
28.3
93.1
4.0
19
0.8
6
Cam Le
2061
525
25.5
78.9
3.8
20.9
1.0
14
Season
No.
Station
Three-lowest-month
Lowest month
Xannual
X
%
X
%
X
%
7
Da Nang
2235
567
25.4
88.2
3.9
22.5
1.0
8
Tra My
4111
1220
29.7
234
5.7
62
1.5
9
Tien Phuoc
3241
850
26.2
177
5.5
46
1.4
10
Hiep Duc
3218
940
29.2
162
5.0
38
1.2
11
Nong Son
3146
1084
34.5
158
5.0
39
1.3
12
Giao Thuy
2574
765
29.7
132
5.1
33
1.3
13
Que Son
3091
1055
34.1
147
4.7
36
1.2
14
Cau Lau
2227
581
26.1
90
4.0
24
1.1
15
Hoi An
2233
552
24.7
103
4.6
25
1.1
16
Tam Ky
3251
844
26.0
176
5.4
51
1.6
3010
877
30.1
153
4.6
39
1.1
Average
The dry season period matches with agricultural production exercises in the basin,
containing the winter - spring harvest from January to April and the mid-year - fall
crop from May to September. This situation has truly impacted to the sufficient water
supply possibility; especially, when the water demand is distinctly raised from January
to May.
Low-flow characteristics
Dry season period in the territory is from January to September annually, and the most
reduced runoff typically happens in the April. In any case, if there ought to be an event
of not having additional rainfalls in May and June, the least runoff is recorded around
15
July and August. Furthermore, for rivers that cover the basin territories beyond 300km2,
the least stream typically happens in the April; in the opposite, with basin that are smaller
than 300km2, the lowest runoff happens around June to August.
Table 1.2: Low-flow characteristics of the VGTB River
Thanh My - Vu Gia
Nong Son - Thu Bon
(F=1,850 km2)
(F=3,155 km2)
Q (m3/s)
59.9
114
M (l/s.km2)
32.4
36.1
Time of occurrence
Jan - Aug
Jan - Aug
% year
44.7
39.4
Q (m3/s)
44.9
82
M (l/s.km2)
24.3
26.0
Time of occurrence
Feb - Apr
Mar - May
% year
33.5
28.4
Q (m3/s)
19.1
27.0
Lowest
M (l/s.km2)
10.3
8.6
month
Time of occurrence
April 1983
June 1998
% year
14.3
9.3
Season
Characteristics
Dry
Three
lowest
months
The low flow is depended on groundwater reserves and rainfall density in the basin. The
dry season can be divided into two periods:
-
Stable flow: During this period, flow is mainly fed by volume of water reserved
in the river, causing a chronologically decreasing trend and then stability (from
Jan to Apr annually).
16
-
Instable flow: From May to July, water supplied to the flow is not only from
groundwater but additional rainfalls.
Due to this characteristic, the lowest flow usually happens twice in the rivers around
March to April and June to July.
300.0
250.0
Q (m3/s)
200.0
150.0
100.0
50.0
0.0
I
II
II
IV
V
VI
VII
VIII
IX
Tháng
Q Nông S n
Thành M
Figure 1.2: Mean flow in the dry season of 1981-2010 periods.
Figure 1.3: Low-flow module (Source: Water Resources Investigation and Assessment of
VGTB River Basin Project)
17
The low runoff takes 40 - 45% the total annual flow, the most decreased runoff normally
happens in the upstream territories of the river along with the mean stream module in the
dry season, fluctuating from 30 - 40l/s.km2. The regions recording the lowest runoff are
Northern and Northwestern parts of Quang Nam areas with the basin of Bung and Kon
River. The low-stream module in these regions drops to just 10l/s.km2.
Table 1.3: The lowest flow characteristics in the basin
Qkp (m3/s)
Station
Flv (km2)
Qk,tb (m3/s)
Cv
Cs
75%
90%
Thanh My
1,850
30.8
0.28
0.60
24.7
20.5
Nong Son
3,150
49.0
0.30
0.60
38.5
21.4
Table 1.4: The lowest flow at some main locations in the river basin
Mmin-month
Mmin
Time of
Station
River
F (km2)
Thanh My
Vu Gia
1.850
8,76
4/1983
6,11
4/9/1988
Nong Son
Thu Bon
3.150
8,6
VI/1998
4,63
17/8/1977
(l/s.km2)
18
TGXH
(l/s.km2) occurrence
CHAPTER 2 – LITERATURE REVIEW
2.1. Water Allocation Planning
In a far-reaching way, water allocation is a sharing methodology of limited water
resources between topographical regions and water users. This process is getting to be
eminently essential since natural water accessibility can't meet the advancement
necessity of multi-sectors. Essentially, a successful water allocation planning ought to
give discerning answers for questions of deliberation and insurance. Water scarcity is
internationally turning into a noteworthy test of overall supportable advancement.
Obviously, sustenance security or vitality era and biological system wellbeing oblige
water as an essential peculiarity. In like manner, a comprehensive water allocation
planning is a direly important instrument to stay away from conflicts identified with
water use interest at numerous scales and keep up the healthy ecosystem.
General objective and particular goals of water allocation planning has been changed
sequentially, contingent upon the human development index. In a correlation with the
previous methodologies, the modern water allocation mechanism is more intricate,
considering numerous viewpoints. Essentially, this methodology is embodied (Robert
Speed et al, 2013): (1) Assessment of water available for allocation; (2) Determination
of allocation mechanism, meeting the demands of various sectors. In the late of the
twenty century, a series of remarkable events were organized to announce important
documents, influenced significantly to modern water management: Brundtland Report,
1987 with the concept of sustainable development; Dublin Principles, 1992 with four
principles recognized as the basis of Integrated Water Resources Management (IWRM).
Agenda 21 the action plan arising from the 1992 United Nations Conference on
Environment and Sustainable Development, held in Rio de Janeiro, defined IWRM as:
‘based on the perception of water as an integral part of the ecosystem, a natural resource
and a social and economic good, whose quantity and quality determine the nature of its
19
utilization’ (UNDESA, 1992). These efforts can be considered as key responses to
ecosystem degradation and low efficiency of economic activities due to problems in
water management.
Figure 2.1: Basin water allocation agreements and plans in the twentieth century (Robert Speed
et al, 2013)
Normally, the shift of water allocation planning to a complex framework is a
subsequence of the accelerating basin water resources competition and scarcity. For
instance, the severe environmental crisis in the Murray-Darling in the early 1990s was
the origination of changes in the Murray - Darling Agreement and the launch of
regulation on exploitation at the basin scale. In Western Australia, water abstraction is
managed by individual licenses, based on water allocation guide at a collective or
geographic scale. Water allocation plans guide licensing by setting out how much water
can be abstracted from a resource and how that abstraction will be managed now and
into the future. Another example of water allocation planning happens in the Colorado
River basin. Water sharing of this river was structured by a set of announcements, of
which the 1922 Colorado River Compact has become the most significant agreement.
20
However, this compact is a typical case of a simple water allocation mechanism between
regions and is evaluated as an inflexible approach for not accepting annual adjustment,
not setting environmental flow into account, not building temporal regulation
mechanism as a necessary response to changes of climate, water demand, priority and
other aspects.
Figure 2.2: Water allocation planning
model in Western Australia
In Asia, there are many cases that river
basin
covers
territory
of
many
countries. This characteristic as a
result, promotes the establishment of
international river basin management
institutions. In the Southeast Asia, a
treaty signed by India and Pakistan
regarding water allocation of the Indus
river can be considered as an effort to
avoid possible conflicts between two
countries. Effectually, India can freely
use stream water availability of three
upstream tributaries and allocate the
remaining
volume
to
Pakistan.
Subsequently, the Water Accord 1991, signed by Pakistani state chief ministers has
provided an allocation mechanism for that remaining water availability. In spite of
shortcomings, this document has successfully played its role as the water allocation
mechanism, obtaining a consensus of stakeholders. The Water Accord has proved a shift
to more comprehensive approach of water resources allocation planning by comprising
21
measures responded to seasonal variations and environmental flow. However, the
allocation process considers only base scenario of water use, leading to failure of
discovering the alternative water supply sources. Similarly, water allocated to maintain
environmental minimum flow was not carefully defined, causing potential vulnerability
of ecosystem.
In Vietnam, the shift of river water allocation planning can be described through three
periods: before 2008, from 2008 to 2013 and after 2013. Before 2008, the decrees and
circulars guiding the implementation of water resource planning have not been issued;
Vietnam applied the irrigation plans based on the 1998 Law on Water Resources. The
formerly irrigation plans were usually divided into three categories: (1) Comprehensive
planning: this government-level practice can be defined as the development and
arrangement of doings, having mutual interaction as well as establishment of priorities
and orientation to avoid possible conflicts. The comprehensive plan is usually
implemented at national scale or large areas, probably impacting dramatically on many
aspects of socioeconomic and natural development. (2) Single-sector planning: this
implementation is normally applied for individual water use sectors such as urban water
supply planning, irrigation system planning, etc. The single-sector planning is often
carried out in sub-regional or local scale and small areas, often referring deeply to the
particulars of economic, technical and social development. And (3) Bilateral planning:
this implementation is set in case of raising a closed relation between water use plans of
sectors (water allocation planning, land use planning, irrigation planning, transport
planning, rural planning, etc.). Bilateral planning is sometimes classified as
comprehensive planning, although its specifics are not evidently comprehensive.
However, bilateral planning is broader and more complex than single-sector planning
and is also prepared under a closer view with economic, technical and social issues.
22
During this period, integrated plans are only passed by competent authorities without
formal written approvals.
In the second phase, in 2008, the Government issued Decree No. 120/2008/ ND-CP on
river basin management, which has regulated as follows: River basin water resources
planning is included of a) Planning on the allocation of water resources; b) Planning on
protection of water resources; and c) Planning on prevention, combat and address of
consequences of harms caused by water. In October 5, 2009, Ministry of Natural
Resources and Environment issued Circular No. 15/2009 / TT-BTNMT regulate
economic-technical norms about water resources planning and adjusting water resources
planning. It specifies the content, sequence, procedures and norms for water resource
planning. The content of water resources planning includes 5 main items: Surface water
allocation planning; Groundwater allocation planning; Surface water protection
planning; Ground water protection planning; Prevention, control and remedy of the
harmful effects caused by water planning. Law on Water Resources and Decree No.
120/2008 / ND-CP has said that: Provincial water resources planning must be approved
by the Chairman of the provinces or centrally run cities after collecting opinions of
stakeholders. (Approval of the Ministry of Natural Resources and Environment is not
mentioned).
After 2013, Law on Water Resources No. 17/2012/QH13 June 21, 2012, taking effect on
01/01/2013 has issued a number of regulations on water resources planning as follows:
a) Water resources planning is defined in Article 15, including: a national water
resources plan; water resources plans for inter-provincial river basins and interprovincial water sources; and water resources plans of provinces and centrally run cities.
Water resources planning defined in the Article 15 does not cover planning components
similar to Decree 120/2008 / ND-CP dated 01/12/2008 (Decree No. 201/2013/ND-CP
November 27, 2013 of the Government, stipulating detailed provisions a number of
23
articles of the Law on water resources has abolished the provisions of Decree No.
120/2008/ND-CP which contrary to the provisions of the Law).
b) Authority approving water resources plans is defined in Article 21. For instance, at
the provincial level, People's Committees shall elaborate water resources plans of their
provinces or centrally run cities for submission to the People's Councils of the same level
for approval after obtaining written opinions of the Ministry of Natural Resources and
Environment. (This point differs from the previous regulations). The contents of the
investigation, data collection, and other work items serving planning is applied by basing
on technical-economic norms issued by Ministry of Natural Resources and Environment;
and Circular 05/2013/TT-BKH regulations on planning issued by Ministry of Planning
and Investment.
Figure 2.3: Water resources planning framework in Vietnam
24
One of the typical case study applying the above framework in Circular No. 15/2009 /
TT-BTNMT is “Water resources planning in Dong Nai Province to 2020”. This
provincial-scale plan aims to enhance the effective exploitation and use of water
resources, protect the integrity of rivers and water sources; proactively prevent
degradation, depletion of water resources and overcome adverse consequences caused
by water in Dong Nai Province in order to fulfill the criteria of socioeconomic
development. The plan was divided into two phases; the first three-year period from
2012 to 2015 and the second four-year period from 2014 to 2020 with concrete doings:
(1) Planning on allocation of water resources (Surface water and Groundwater); (2)
Planning on protection of water resources (Surface water and Groundwater); and (3)
Planning on prevention, combat and address of consequences of harms caused by water.
The comprehensive characteristic of Dong Nai case study has been exposed though the
consistent coherence with the regional overall socioeconomic development plan, land
use plan, overall plan of urban water supply and industrial zones in Dong Nai Province
to 2010 and planning orientation up to 2020 as well as other relevant specialized plans.
Another typical example of water allocation planning in Vietnam is “Water resources
allocation planning in Lang Son Province to 2020, orientation to 2030.” This study is
initialized by determining the current state of management, exploitation and use of water
resources in the Province. This also one of two main objectives of the project, the other
is to propose solutions dealing with exploitation and use of water resources in a
sustainable manner, contributing to a stable social and economic development in Lang
Son province up to 2020, and vision to 2030. This specific study has followed four
allocation principles and analyzed three scenarios. The principles are comprised of: (1)
Considering water yield by giving priority to the sectors, providing the highest economic
benefit after allocating adequate volume of water for domestic use. Accordingly, sectors
receiving priority of allocation mechanism must share their welfares for the others,
25