Vulnerability assessment of freshwater resources in island to environment change a case study in phu quoc island kien giang province
Bạn đang xem bản rút gọn của tài liệu. Xem và tải ngay bản đầy đủ của tài liệu tại đây (1.86 MB, 97 trang )
1
CHAPTER 1: INTRODUCTION
1.1. Problem statement
Water is our most precious resource. However, in recent years, water has
become degraded in both quantity and quality. This situation is placing challenges
and requires a worldwide effort in the use and sustainable management of water
resources. The provision of water supply and sanitation has improved living
conditions; in addition, the implementation of social justice and educational
approaches, especially for women and children, are also contributing to the success
of the enactment of the Millennium Development Goals (MDG).
The development status of the Island, the isolation characteristic, the
distance between neighboring islands, between islands and the mainland, the
change of the environment, climate change, changes in rainfall, etc. are the
challenges of water resources management. The Island, located in the lower floor of
the Southwestern area, is a vulnerable area to climate change and sea level rise.
Furthermore, the island is affected by the early phase of the El Nino and La Ninas.
The Island is a key economic zone with typical activities, such as: fishing, oil and
gas exploitation, maritime services, tourism as well as it is adjacent to the other
countries in the region.
Especially, Phu Quoc Island is the largest island in the coastal island system
in Vietnam. The current status of the economic development has created a
significant social pressure on the island regarding both system resources and the
environmental management. There is no rational planning and efficient use of
natural resources, although the extraction (water, oil, gas...) has been carried out for
a long time. Therefore, freshwater resources in Phu Quoc Island are vitally
important, and have a direct impact on daily life, and the development of the island.
The assessment of freshwater resource vulnerability in Vietnam is still very limited,
particularly in the Island. A vulnerability assessment of freshwater resources in Phu
2
Quoc Island will be essential to identify potential risks for fresh water resources on
the island and to support decision making; Therefore, detecting early threats to gain
insight sustainable solutions to the management of freshwater resources on an
island, where the exploitation of freshwater resources management is still
problematic.
Understanding the vulnerability of freshwater resources of the Islands,
therefore, is important to ensure sustainable water management in the region. Uses
of water have an intimate relationship with land use and impact on ecosystems
dealing with integrated water resource management. The integrated water resources
management will help to use and to protect natural resources. In order to effectively
implement integrated water resource management, the necessity of understanding
and the ability to assess the vulnerability of water resources are highlighted.
Performing a vulnerability assessment of freshwater will highlight gaps in
information and identify the most influential factors affecting vulnerability, in
addition to raising public awareness. The availability of such an evaluation would
provide decision-makers with the option to evaluate and modify existing policies
and to implement measures to improve the management of water resources.
Different approaches to vulnerability assessment of water resources and
hydrological systems have been developed for a long time with both advantages and
disadvantages. One of the most effective responses, vulnerability assessment has
recently been developed by the United Nations Environment Program and by
Packing University. This approach is based on the available resources to meet the
production, use, environmental pressures mitigation and capacity development and
management. It highlights the vulnerability factors such as climate change,
population growth, economic development, and management, etc. of vulnerable
freshwater resources. Currently, this method is implemented in the Pacific Islands,
in West and South Asia, in the Mekong River basin, and in several other river
basins in Vietnam. However, the vulnerability assessment of freshwater resources
on islands in Vietnam is very limited and this method is still not an application
3
option. Hence, this study can be considered as a the first application of this approach
assessing freshwater vulnerability on islands in Vietnam.
1.2. Objectives and Research questions
1.2.1. Objective of study
The main objectives of the study include:
- Piloting a method in terms of assessing the freshwater vulnerability in the
southwestern area of Vietnams: applied specifically on Phu Quoc – Kien Giang
Province;
- Assessing vulnerability of freshwater resources on the Island of Phu Quoc –
Kien Giang and potential agents;
- Providing scientifically-based evidence to support policy development of water
resources management, to support the decision-making process;
- Proposing measures to reduce the vulnerability of freshwater resources on the
Phu Quoc Island.
1.2.2. Research questions
- What methods and tools are appropriate to assess the vulnerability of
freshwater resources on the Island?
- Which elements are vulnerable to freshwater resources?
- What are the opportunities and challenges regarding to freshwater resources
management in the Island?
- What are solutions that should be done to improve the freshwater resources in
the Island?
1.3. The Assessment Process
Water is essential for life. All activities of humans, animals and plants on
earth need water. However, freshwater resources are vulnerable and a reliable
assessment of vulnerability is essential. The vulnerability assessment of freshwater
resources, newly developed by UNEP (United Nations Environment Program) and
by Peking University is the methodology of the thesis. Firstly, relevant data in the
study area are collected, including: relevant documents such as natural conditions,
hydrology, environment, geology, etc. The statistical analysis results are collected
4
directly from the local agencies.
The data processing is necessary to investigate
additional fieldwork and to update the latest data content research serving as the
current status and characteristics of water resources on the island and the control
system influence of the current vulnerability of freshwater resources. This study will
provide an overview of the evaluation method to assess the vulnerability of water
resources; the preferred method will be the approach developed by UNEP (United
Nations Environment Program) and Packing University. The evaluation of data will
serve an analytical framework DPSIR (Driver, pressure, state, impact and response)
to analyze quantitative and qualitative features, and a description of the
vulnerability of freshwater resources on the island. Then, an integrated vulnerability
index (VI) is calculated based on possible vulnerable parameters; the results will
assess the vulnerability of freshwater resources on the island, followed by a
proposal for solutions to reduce the vulnerability of freshwater resources on the Phu
Quoc Island.
1.4. Structure of the thesis
This report is divided into six chapters. The first chapter introduces the
research to answer three main questions: Why is a vulnerability assessment is
important? How can we assess the vulnerability of the island? And, what are the
main objectives of a vulnerability assessment in this study?
The chapter two reviews several studies about the concept of vulnerability,
vulnerability assessment methods and some previous researches relate to study area.
The chapter three presents an overview of freshwater resources, which
describe the geographical context of natural, socio-economics, freshwater resources.
Especially, we focus on the present status and the challenges dealing with the
management of fresh water resources in the island. This chapter also discusses the
importance of the influence of climate change and the pressures of environmental
change to freshwater resources on the island.
Chapter four identifies methods to assess the vulnerability of freshwater
resources, summarizes the specific assessment method of UNEP, including, such as:
5
methods, diagnosis of issues, and DPSIR analytical framework to understand the
vulnerability index (VI). Data used in the thesis.
Chapter five is an important chapter of the report. This chapter continues to
assess the vulnerability of freshwater resources on the island of Phu Quoc – Kien
Giang Province.
These assessments
determine
the
importance and the
interrelationship of social-economics, the environment, climate, geographical
factors and management resources with vulnerable island freshwater resources. The
study of assessment indicators and injury parameters such as water stress,
development pressure, the insecurity of the ecosystem and management challenges,
is necessary to calculate the vulnerability index. In addition, this chapter will
provide proposed measures to reduce the vulnerability of freshwater resources on
the Island.
Chapter six: Finally, the last chapter concludes the findings of this thesis,
discusses the limitations of this work and provides an outlook by giving
recommendation for future areas of research.
6
CHAPTER 2: LITERATURE REWIEW
2.1. Concepts of vulnerability
The concepts of vulnerability have been changed over time. According to
Jörn Birkmann (2006) statistics, the current literature encompass more than 25
different definitions, concepts and methods to systematize vulnerability (for
example, Chambers, 1989; Bohle, 2001; Wisner et al., 2004; Downing et al., 2006;
UN/ISDR, 2004; Pelling, 2003; Luers, 2005; Green, 2004; UN-Habitat, 2003;
Schneiderbauer and Ehrlich, 2004; van Dillen, 2004; Turner et al., 2003; Cardona,
2004b). According to Downing (2006), the vulnerability includes the expression,
sensitivity and resilience of the system to combat the dangers posed by the effects of
the agent. Researchers in the field of natural sciences often focus on the concept of
risk, while researchers in the field of social sciences often refer to the term
vulnerability. Concept of vulnerability is the social scientists associated with the
group of socioeconomic factors and the community's ability to cope with natural
disasters, but scientists about climate usually consider the concept of vulnerability
as a function of the likelihood of occurrence and the potential impact of weather and
climate related.
According to Jörn Birkmann (2006) statistics, one of the best-known
definitions were formulated by the International Strategy for Disaster Reduction
(UN/ISDR), which defines vulnerability as:
- The conditions determined by physical, social, economic and environmental
factors or processes, which increase the susceptibility of a community to the impact
of hazards. (UN/ISDR, 2004).
- In contrast, the United National Development Programme (UNDP) defines
vulnerability as: a human condition or process resulting from physical, social,
economic and environmental factors, which determine the likelihood and scale of
damage from the impact of a given hazard. (UNDP, 2004: 11)
7
Develop policies of integrated water resources management will require a
comprehensive knowledge, the understanding of the vulnerability of water resources
is a key element for this purpose. Vulnerability is a term used to describe a weakness
or flaw exists in the system, the sensitivity of the system with a threat or a particular
disadvantage, and/or challenges systems faced when dealing with the threat.
In view of water resource management, the vulnerability can be defined as
the characteristic weaknesses and flaws of the system of water resources makes it
difficult to respond to changing economic and social and the environment. Thus, the
vulnerability can look through (i) the pressure of the water resources in the study
area; and (ii) the ability of ecosystems and society in the fight against the agents
acting on the healthy function of water resource systems.
2.2. Vulnerability assessment
Water, "blood" of natural ecosystems, have a role indispensable for almost
all functions of ecosystems. Water is also one of the important resources needed to
support the socioeconomic development of human. The result of the excessive
population growth, rapid economic development, mismanaged of water resources,
leading to dwindling water resources. Therefore, sustainable water resources
management has become a priority concern of many national agendas.
Vulnerability assessment is a process of investigation and analysis to assess
the sensitivity of the system before the potential threat, and to identify the main
challenges for the system in reducing or minimize the risks associated with, the
negative consequences of the opposition activists. Assessment of water resources
will be calculated based on the water balance between water supply and water
demand, system policies and ownership to support the conservation and management
of water resources, as well as regime change hydrology under the impact of climate
change and other environmental factors. Besides, It needs to consider the risks that
may occur from the surrounding areas can affect water resources.
The vulnerability assessment can be used to orient the rational use of water
resources through the provision of a priority plan for upgrades, adjusted operating
8
procedures, and/or change the policies to reduce risks and vulnerabilities to achieve
the most efficient use. Vulnerability assessment will provide the basic framework
for the development of options to reduce the risks and costs involved. In fact, every
problem is identified, vulnerability assessment to delimit the main control factor;
estimate the pressure; understand the current situation and development trend;
impact analysis; and determine the response to deal with vulnerability of water
resources systems.
2.3. Previous studies in study area
Phu Quoc Island is the largest island in the system of the coastal islands of
Vietnam. Phu Quoc Island in the Gulf of Thailand, the Southwestern of Vietnam.
The studies related to the Island's water resources are very limited. The coastal
islands Southwestern systems have a very important position on national security
and economic development. Some typical projects in the Phu Quoc Island area are:
- In 2006, Dr. Dao Manh Tien and Dr. Pham Van Thanh to implement the
project "Investigation assesses the current state of the marine environment of Phu
Quoc Island from 0 - 20m". The results were evaluated of marine resources Phu
Quoc island, the environmental status of sediments and seawater.
- Dr. Dao Manh Tien (2008) to implement the project "Investigation of
environmental geology and geohazards coast of Phu Quoc - Ha Tien
rate
1/100,000".
- Within the scope of Phu Quoc Island and especially the National Park, this
area has had plenty of the study of biological diversity. The survey results synthetic,
fauna and flora of the area by the Institute of Forest Inventory and Planning II
performed (1996, 2002). This is the basis of the results are to assess, comment on
diversity and biological resources of Phu Quoc National Park.
- NAWAPI - National Center for Water Resources Planning and
Investigation (2010), Project “Water Resources Planning on the Phu Quoc Island”.
Planning is approved as the basis for the management agency of water resources
9
Kien Giang Province implementation of management measures, protection and
exploitation and use of water resources on the Phu Quoc Island.
- Vietnam Academy for Water resources (2010), Project “ Research,
evaluate the potential exploitation of surface water sources serving water supply on
Phu Quoc Island”.
The previous studies in Vietnam, not to mention much of each object on the
Island are harmed by the activities of socioeconomic development, or the natural
environment changes. In Vietnam, Vulnerability assessment of freshwater
resources is limited, especially object is the island, where the water resources are
very vulnerable.
2.4. Overview of assessment methods
An approach to assess the vulnerability of water resources and hydrological
system has been developed for a long time, with many different methods. Such as
Water Poverty Index (WPI) – (Lawrence and others 2002; Sullivan and others
2003), with the aim is to provide an interdisciplinary measure, including the benefits
associated with household water and indicate the level of water availability affect
humans, the index takes into account the physical and social - economic factors
related to water scarcity.
Water Stress Indicator WSI description available water resources in a
country, the water stress index developed by Swedish Falkenmark expert 1989.
This index is often used in the evaluation on a national scale which data are
available and provided intuitive results and understanding. However, the use of
average annual water of the country should tend to obscure information water
scarcity on a smaller scale.
Meigh and others (2004) have developed a water availability index Water
Availability Index (WAI). The index includes surface water, groundwater and
compared to the total water demand of all sectors such as industry, agriculture, etc.
Or water stress (Gleick 1996) at the regional level. The index uses measurements of
input, output, and based on the water balance equation.
10
Or The South Pacific Applied Geoscience Commission (SOPAC) has
developed an Environmental Vulnerability Index (EVI) 2005 to develop a
vulnerability index to demonstrate the disadvantages, which the small islands are
incurring. This index focuses on the vulnerability of the environment from the risks
of natural and human. Including the effects on physical and biological aspects of
the ecology, habitat, biodiversity, ecological resilience etc.
There are many different evaluation methods to be studied and applied, with
both advantages and disadvantages. For the vulnerability assessment of water
resources in recent years, Method of water resources vulnerability assessment,
developed by UNEP and Peking University (2009) emerged a way to evaluate the
effectiveness and advantages. With the approach depending on the resources
available to meet the production, use, environmental pressures and capacity
development and management. It highlights the vulnerability factors such as climate
change, population growth, economic development, and management, etc. of
freshwater resource vulnerability. Currently, this method has been used to assess the
vulnerability of water resources in the Pacific Islands, West Asia Region, and
South Asia and some river basin as Mekong river basin, Amu Darya river basin,etc.
The research on sea environmental resource vulnerability assessment in
Vietnam has just begun in the late twentieth century. To date, there are many studies
following different approaches, such as regions/areas, natural systems and social,
community, resources in different areas. The study is based on general principles of
a vulnerability assessment is to determine the ability of a compromised system
(natural, social and economic) to meet natural disasters and man-made, one
determine the resilience and recovery of systems; thereby, proposing vulnerability
mitigation measures. From 2001, the team of Prof. Dr. Mai Trong Nhuan conducted
studies assessing coastal vulnerability (Mai Trong Nhuan 2005). Thereby, the
research team has identified the ability of the vulnerable segments of society,
nature, previous works. The combined effects of natural and man-made disasters as
well as vulnerability maps propose mitigation measures for many coastal localities
11
in our country. For the method to assess the vulnerability of water resources had
initially applied research project to assess the vulnerability of water resources to
river resources as Vulnerability Assessment of Water Resources Systems in Thach
Han basin, Nhue Day basin by Trinh Minh Ngoc and others, 2013 - Faculty of
Hydro-Meteorology and Oceanography, VNU University of Science used
Methodologies Guidelines of UNEP and Peking University (Trinh Minh Ngoc
2013). However, this approach on the Island is still not applied.
For Southwestern areas, the densely populated island group also has studied.
As the evaluation of Prof. Le Duc An (1995), this area is much variation in natural
conditions, natural resources. The project "Research on natural conditions and
Southwestern areas of environmental, economic development serves to protect the
security and sovereignty " KC09 02/06-10 of Prof. Do Ngoc Quynh mentioned the
major motivating factors in the forms of sea disasters, environmental impacts of
climate change in the current trend. Overall, the southwestern areas, especially in
the island system have not been fully studied with the latest data on natural
conditions, resources and environment. In which, freshwater resources is most
vulnerable.
12
CHAPTER 3: DESCRIPTION OF THE STUDY AREA
3.1. Geography and Socioeconomics
3.1.1. Geography and Biodiversity
a) Geography
Phu Quoc, also known as Pearl Island, is the largest island of Vietnam,
located in the Thailand Gulf. The total area of the Island is 567,55 km² (National
land statistics, 2005), approximately the size of Singapore. Phu Quoc District has a
total area is 589,23 km2, perimeter about 150km, includes 2 towns and 8 communes
(NAWAPI 2010).
Duong Dong Town, located in the northwest is the administrative town of the
Island. Phu Quoc is located 120 km from Rach Gia and Ha Tien town by 45 km.
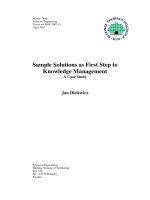
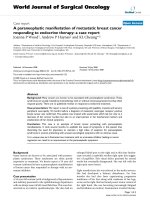
Phu Quoc Island lies in the Gulf of Thailand in Southwest of Vietnam, Phu
Quoc stretches from latitude 9°53' to 10°28' and longitude from 103°49'to 104°05'.
\
Figure 3.1: Location of Phu Quoc Island on satellite images
(Source: Google Earth)
13
b) Topography
The topography here is quite diverse, but the main type is still hilly terrain.
Topography can be divided into two areas of Phu Quoc Island with the following
characteristics (NAWAPI 2010):
North Island has an area of about 400km2 with over 70% of mountains
-
(average slope of 25-30%), less than 30% of the low hills and flat land.
Overall, topography elevation is lower from the north to south and from east
to west.
South Island has an area of about 1672km2, including many low mountains
-
alternating strips of land fairly low and gradually in the direction from
Northeast to Southwest with a slope less than 15%.
Currently, it is being used or capable of use for agricultural production.
Follwing are the results of the natural distribution according to altitude and slop.
Table 3.1: Distribution by altitude and degree slope
Altitude
(m)
Slope
<5m
<8%
5-40m
<15%
>40m
>15%
Current status and
potential use
Agriculture,
construction, tourism
Agriculture,
construction, tourism
Forest, ecotourism
Total
Area (km2)
Percentage (%)
69
12,17
143,8
25,36
354,2
62,47
567
100
Source: National Center for Water Resources Planning and Investigation
(NAWAPI)
c) Meteorology
Phu Quoc Island has one meteorological station was set up in 1957 in Duong
Dong town, observation of meteorological factors: temperature, humidity,
evaporation, wind, sun, and rain. Until 1995 on Phu Quoc island has two water
levels stations at White bridge locations on Cua Can river and at Tram station on
14
Duong Dong river. Oceanographic stations are located in the estuarine areas of
Duong Dong.
The specific datas on temperature, humidity, wind, etc of Phu Quoac
were provided by Kien Giang Hydrometeorology Center.
Phu Quoc Island area characterized by tropical monsoon climate.
High
temperatures during the year, an average of 27.10C. Evaporation (Piche) annual
average is 1,210 mm (3.3 mm / day). Average annual humidity is 82.6%. October,
the highest average humidity (87.8%). February, the average humidity is lowest
(75.5%) (NAWAPI 2010).
Annual rainfall is abundant here, annual average 2902 mm and is relatively
stable over the years (coefficients of variation Cv = 0.176) (NAWAPI 2010), pretty
standard distribution. Rainfall in large stable with mountainous terrain conditions
are ideal conditions for the development, management and operation of small and
medium reservoirs on the island of Phu Quoc.
15
Table 3.2: Temperature characteristics (0C) at Phu Quoc Station (1984-2011)
Characteristics
I
II
III
IV
V
VI
VII
VIII
IX
X
XI
XII
Year
Average
26.1
26.7
27.8
28.6
28.6
28.2
27.7
27.6
27.2
26.9
27.0
26.4
27.4
Highest
34.3
34.3
35.8
35.8
37.0
35.5
34.4
33.8
33.8
33.7
33.3
33.8
37.0
Lowest
17.3
17.1
18.5
22.0
22.1
22.5
21.7
21.8
22.1
21.4
19.9
17.6
17.3
Average lowest
30.7
31.3
31.0
32.6
31.6
30.6
30.0
29.7
29.5
30.3
30.7
30.5
30.7
Average highest
23.3
23.9
24.1
25.7
25.9
25.7
25.3
25.3
25.1
24.7
24.6
23.8
24.8
Table 3.3: Average humidity by months – year (%)
Month
I
II
III
IV
V
VI
VII
VIII
IX
X
XI
XII
Year
Tho Chu
79
79
79
79
83
85
86
87
87
87
83
79
83
Rach Gia
79
78
75
78
82
84
85
85
85
84
81
79
81
Phu Quoc
74
77
77
80
83
85
86
87
87
86
79
73
81
(Source: Kien Giang Hydrometeorology Center)
16
Table 3.4. Lowest humidity by months – year (%)
Month
I
II
III
IV
V
VI
VII
VIII
IX
X
XI
XII
Year
Tho Chu
54
48
53
56
55
60
64
64
58
65
61
57
48
Rach Gia
49
47
39
37
48
55
60
57
56
50
50
50
37
Phu Quoc
34
33
35
42
41
58
56
49
55
50
41
35
33
(Source: Kien Giang Hydrometeorology Center)
Table 3.5: Characteristics of rain in Phu Quoc
Month
Highest rainfall
per day
Average
monthly
rainfall
Average rainy
days
I
II
III
mm
77.9
112.2
mm
32
28
date
6
4
IV
V
VI
VII
VIII
IX
X
XI
XII
Year
103.2
127.1
109.6
126.8
196.5
327.1
188.4
181.2
136
105.4
327.1
66
154
260
365
390
474
458
355
145
52
277.9
12
19
21
22
24
23
21
13
6
177
7
(Source: Kien Giang Hydrometeorology Cent
17
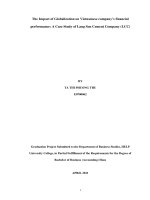
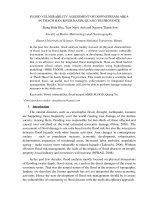
Analysis of rainfall data from Phu Quoc stations for the period from 1985 to
2011 shows that total annual rainfall has decreased by an average of 19.8 mm /year
(Nguyen Ngoc Tran 2013).
Figure 3.2: Total annual rainfall in Phu Quoc station (1985 – 2011)
(Source: Kien Giang Hydrometeorology Cente)
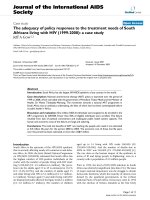
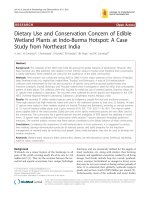
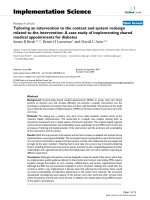
Water level data from Phu Quoc station shows the maximum tide height,
minimum tide height and the average trend line for the period (1988 - 2010);
annual average tidal amplitude and the average trend line in the years (1988 2009) are shown in the image below:
Figure 3.3: Hmax, Hmin in Phu Quoc island
(Source: Kien Giang Hydrometeorology Center)
18
Figure 3.4: Tidal amplitude in Phu Quoc island
(Source: Kien Giang Hydrometeorology Center)
Tidal amplitude has the trend increased both on tidal and tidal foot. The
maximum tide height, minimum tide height for the period (1988 – 2010) tend to
increased.
Based on the standards division of the rainy season and dry season
Hydrometeorology Center (monthly rainfall exceeding 150 mm, surpassing the
average evaporation month period, the fall in the rainy season) and in combination
with the analysis of Duong Dong station rainfall data, rainfall regimes in Phu Quoc
island can be divided into the following two seasons: rainy season lasts 7 months
(May - November), coincided with the period of active southwest monsoon; 5
month long dry season (December- April years later), coinciding with the period of
operation of the northeast monsoon. April rainfall average is 150 mm at Duong
Dong station, but heavy rain and steady rainfall in the last 10 days of April, so April
could be considered a transition month from dry season to the rainy season. The
rainy season accounts for 81% of total rainfall leading to excess water during the
rainy season, water shortages in the dry season. Moreover, due to the steep
19
topography, rain water should focus quickly generate large floods in the months
VII-IX, often causing severe damage to infrastructure, land erosion and threaten
people's lives (Nguyen Ngoc Tran 2013).
d) Rivers Network
The river and streams on the island of Phu Quoc with diverse characteristics,
especially small rivers, estuaries flowing into different directions depending on
terrain conditions. Surface water during rainy season is abounding in the inland. The
density of spring is 0,42 km/km2 (largest density among islands in Vietnam). There
are two main river systems in the. They occupy a total basin area about 25% of the
total island area (NAWAPI 2010). These rivers have steep slopes, flood season
caused major erosion.
-
Cua Can river: Derived from Chua mountain, flows from East to West. The
river length is 29,75 km, the total length of the River in this basin is about
69km, the catchment area is 120km2.
-
Dong Duong river: Derived from Da Bac mountain, flow direction from east
to west. The river length 21,5km, total length of the network of rivers and
streams in this river around 63 km, the catchment area is 57 km2.
-
Cua Lap river connects with many small rivers derived from Ham Ninh
mountain, flowing to the sea to the west, the river length is 11km, the total
length of the river about 45km, the catchment area is 21 km2.
-
Tram river derived from Ham Ninh mountain, Ham Rong, flowing into the c
North, river length is 9km, the total length of the rivers is about 22 km,
catchment area is 41, 2 km2.
-
Suoi Lon river derived from Ham Ninh mountain, flows east - west, then
enters the Dam river, flowing to the west - east, then to see; river length is
15km, the catchment area is 8km2.
-
Ca river: Dirived from Ham Ninh mountain, flowing into the East sea, river
length is 5km, catchment area about 11km2.
20
There are also a number of other smaller Rivers are: Vung Bau River in the
northwest of, Ham Ninh River in the Southeast, Dam river in the south and the
Chanh river on the center island.
The influence of natural conditions for the Island Development
-
Phu Quoc Island has steep terrain and complicated. Difficult mining, land
used for agricultural purposes in many areas of upRiver rivers and Rivers.
Steep topography is a major cause localized flooding on the Island, causing
soil erosion.
-
Annual rainfall is relatively abundant on the island with the amount of 2902
mm/year (NAWAPI 2010). However, rainfall is not evenly distributed over
the year. Rainfall during the rainy season accounts for 89%, in the dry season
only 11% lead to water shortages in the dry season.
-
Every year in August, September heavy rains and lowland flooding, causing
innundation, flooded from 1 to 2m. The flood prone areas at downRiver Cua
Duong Dong, however Duong Dong downriver flood situation now has
improved somewhat due to the reservoirs upriver. Flood damages situation in
Phu Quoc, are not severe during the construction of hydraulic some
coustruction system.
-
Droughts occur locally in Bai Thom and Ganh Dau commune. In coastal
areas there are salt intrusion situations, affecting the farming activitis and
lives of the people living there.
21
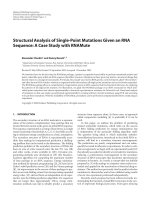
bản đồ mạng l- ới sông suối đảo phú quốc
3 72
76
80
84
88
92
96
00
11 56
4
1156
52
52
Rạ
Bãi Thơm
ch
Trà
m
48
48
Gành Dầu
44
44
Rạch Cửa Cạn
40
40
Cửa Cạn
36
ch
Hồ D-ơng Đông
Rạ
Dơn
g
Cửa D-ơng
Đô
ng
36
32
32
D-ơng Đông
28
28
Hàm Ninh
Rạ
ch
Cử
a
Lấ
p
24
24
D-ơng Tơ
20
20
16
16
chú giải
Sông, suối, rạch
Hồ và đập n-ớc
12
Rạch Cầu Sấu
12
Ranh giới xã
Trung tâm thị trấn, thị xã
An Thới
Đ-ờng nhựa
08
08
Đ-ờng đất
Bến cảng
11 04
3 72
76
1104
80
84
88
92
96
4 00
Figure 3.5: Map of River Network on Phu Quoc island
(Source: NAWAPI)
22
e) Vegetation cover
The Phu Quoc flora has a high biodiversity in comparison with other island of
our country. Along with high and steep topography condition, soil properties and
climate characteristics here are favorable conditions for development of forest
vegetation. The biodiversity is rich with main tropical broad-leaved forest ecosystem,
forest on sulfate acid soil, salt-marsh forest, coral reefs and seagrass beds.
Phu Quoc has a large protected area is located on the territory of the
commune Ganh Oil, Bai Thom, Duong Cua, Cua Can, Ham Ninh and Duong Duong
Dong town. Since 2001, this nature reserve has been transformed into Phu Quoc
National Park with a total area is 314,22km2. According to a 2005 survey, there are
1,164 species of plants on ground surface the plants in Phu Quoc National Park,
belong to 66 sets, 137 groups and 513 offshoots of 06 sectors of higher plants are
Psilophyta,
Lycopodiophyta,
Equisetophyta,
Polypodiophyta,
Pinophyta,
Magnoliophyta (Wildlife at Risk 2006).
In Phu Quoc Tropical wet broad-leaved rainforest ocupies for more than 90%
of the area of Phu Quoc National Park. The dominant plants belonging to
Dipterocarpaceae, Myrtaceae and Ebenaceae families. Salt-marsh, forest has
Lumnitzera Rose and Rhizophora Apiculata. In addition, there are many rare and
endemic species that have high value for research and gene conservation as well as
economic value.
Phu Quoc National Park has three ecosystems include ecosystems of
tropical moist forest; Alum forest ecosystems and Mangrove ecosystems. As shown
in the table below:
Table 3.6. Distribution of Phu Quoc forest ecosystem
1
FOREST
ECOSYSTEM
Phu Quoc National
Park
Tropical moist
forest ecosystems
Set
Group
Group
%
Offshoot
Offshoot
%
Set
%
137
100
531
100
1164
100
131
95,6
487
93,3
1084
93,1
23
FOREST
Set
Group
Offshoot
ECOSYSTEM
Set
%
Group
%
Offshoot
%
Alum forest
75
54,7
148
28,4
194
16,7
2
ecosystems
Mangrove
15
10,9
25
4,8
35
3
3
ecosystems
(Source: Forest Inventory and Planning Institute (Ho Chi Minh city))
Forest vegetation cover over 88% natural area of Phu Quoc National Park.
Natural forest area of Phu Quoc is also quite large 39 618 ha (65% of the land area
of the whole island), including many wood rare types, forest resources have shown
here is also an advantage for the Island in the resource supply, rain water havesting
and environmental protection (Wildlife at Risk 2006).
3.1.2. Socio-economics
a) Administrative Organization
Phu Quoc has 2 towns (Duong Dong and An Thoi), 6 communes are Bai
Thom, Ganh Dau, Cua Duong, Cua Can, Duong To and Ham Ninh. The commune
with the largest area Cua Duong (140.7 km2), followed by Bai Thom commune
(94.12 km2). Administrative units with the smallest area is the town of Duong Dong
(16 km2) then the town of An Thoi (27.51 km2) (NAWAPI 2006).
b) Population and population distribution
According to statistics of Kien Giang province, with a population in 2012 of
the Phu Quoc island district, about 96 940 people, the population density of about
165 persons/km2 (Statistical Yearbook 2012).
In particular:
-
The sex ratio is relatively uniform. Men accounted for 51.2%.
-
The urban population is 58.6%. The urban population concentrated mainly
in two centers: Duong Dong town and around An Thoi port. This is the second
urban area with a relatively high growth rate in recent years, Duong Dong is an
important administrative center of the Island. In addition, urban residents are
concentrated in the community centers as Duong To, Cua Can, Ham Ninh, Cua
Duong, Bai Thom, Ganh Dau.
24
-
The rural residential areas: outside urban areas, the rural residential living
mainly distributed on the inter-village roads, communal.
The rural population
accounted for 41.4%. Phu Quoc rural population concentrated in the coastal fishing
village and agricultural village, the current status as follows:
+ The fishing village formed on the river to mouth, where the beans
favorable for fishing boats. Fishermen often build houses along the beach
and even relatively concentrate on estuaries and along the river. Housing is
usually a temporary floor. Sanitation is very poor, men sheet often discharge
directly into the sea water causing pollution. The infrastructure of the
fishing village residents almost nothing, water is mainly self-drilling
groundwater wells.
+ Agricultural villages live mainly in the hamlet of communes as Duong To,
Cua Duong, Cua Can and a few at An Thoi, Bai Thom, Ganh Dau.
Figue 3.6: The coastal fish market
25
Bản đồ hành chính đảo phú quốc
3
72
76
80
84
88
92
96
00
11 56
4
1156
52
52
Rạ
Bãi Thơm
ch
T
ràm
48
48
Gành Dầu
44
44
Rạch Cửa Cạn
40
40
Cửa Cạn
Dơn
g
Cửa D-ơng
Hồ D-ơng Đông
Rạ
ch
36
Đô
ng
36
32
32
D-ơng Đông
28
28
Hàm Ninh
Rạ
ch
Cử
a
Lấ
p
24
24
D-ơng Tơ
20
20
chú giải
16
16
Sông, suối, rạch
Hồ và đập n-ớc
Rạch Cầu Sấu
12
12
Ranh giới xã
Trung tâm thị trấn, thị xã
An Thới
Đ-ờng nhựa
08
08
Đ-ờng đất
Bến cảng
11 04
1104
Đơn vị hành chính
3
72
76
80
84
88
92
96
Figure 3.7: Administrative maps of Phu Quoc island
(Source: NAWAPI)
4
00