Báo cáo hóa học: " Structural Analysis of Single-Point Mutations Given an RNA Sequence: A Case Study with RNAMute" potx
Bạn đang xem bản rút gọn của tài liệu. Xem và tải ngay bản đầy đủ của tài liệu tại đây (1.63 MB, 7 trang )
Hindawi Publishing Corporation
EURASIP Journal on Applied Signal Processing
Volume 2006, Article ID 56246, Pages 1–7
DOI 10.1155/ASP/2006/56246
Structural Analysis of Single-Point Mutations Given an RNA
Sequence: A Case Study with RNAMute
Alexander Churkin
1
and Danny Barash
1, 2
1
Department of Computer Science, Ben-Gurion University, 84105 Beer-Sheva, Israel
2
Genome Diversity Center, Institute of Evolution, University of Haifa, Israel
Received 2 May 2005; Revised 13 September 2005; Accepted 1 December 2005
We introduce here for the first time the RNAMute package, a pattern-recognition-based utility to perform mutational analysis and
detect vulnerable spots within an RNA sequence that affect structure. Mutations in these spots may lead to a structural change that
directly relates to a change in functionality. Previously, t he concept was tried on RNA genetic control elements called “riboswitches”
and other known RNA switches, without an organized utility that analyzes all single-point mutations and can be further expanded.
The RNAMute package allows a comprehensive categorization, given an RNA sequence that has functional relevance, by exploring
the patterns of all single-point mutants. For illustration, we apply the RNAMute package on an RNA transcript for which indi-
vidual point mutations were shown experimentally to inactivate spectinomycin resistance in Escherichia coli. Functional analysis
of mutations on this case study was performed experimentally by creating a library of point mutations using PCR and screening
to locate those mutations. With the availability of RNAMute, preanalysis can be performed computationally before conducting an
experiment.
Copyright © 2006 Hindawi Publishing Corporation. All rights reserved.
1. INTRODUCTION
The secondary structure of an RNA molecule is a represen-
tation of the pattern complementary base pairings that a re
formed between nucleic acids, given an initial RNA sequence.
The sequence, represented as a string of four letters, is a single
strand consisting of nucleotides A, C, G, U that folds accord-
ing to minimum energy consideration as a basic a ssumption.
ThesecondarystructureofRNAsisexperimentallyacces-
sible, thus making its computational prediction a challeng-
ing problem that can be tested in the laboratory. The folding
prediction problem of the secondary structure of RNAs has
been an area of active research since the late 70’s (see [20]
and other works, review available in [25]). Dynamic pro-
gramming methods were developed in [15] (the Nussinov-
Jacobson algorithm) for computing the maximum number
of base pairings in an RNA sequence. Energy minimiza-
tion methods by dynamic programming [23, 24]haveledto
Zuker’s mfold prediction server [26] and the Vienna package
[8]. An improvement in the success of these packages to pre-
dict an accurate folding comes from incorporating expanded
energy rules [13], derived from an independent set of exper-
iments, into the folding prediction algorithm. For sequences
that are longer than approximately 150 nt, energy mini-
mization methods may fail to reliably predict a secondary
structure from sequence alone. In those cases, an approach
called comparative modeling [6]ispreferableifitcanbe
used.
In this paper, we address the problem of predicting
desired nucleotide mutations, which relies on the success
of RNA folding prediction by energy minimization but
is independent of the particular folding algorithm itself.
The question being asked is which nucleotide substitu-
tions/deletions/insertions, introduced to the initial RNA se-
quence, will lead to a secondary structure rearrangement.
The predictions are purely computational and can subse-
quently be tested in laboratory experiments. In order to vali-
date our approach, we begin with an experimental result [22]
that already succeeded to identify several selective mutations,
inducing a conformation rearrangement in the secondary
structure of RNA transcripts that inactivates spectinomycin
resistance in bacteria. As a result, a concept that was initially
proposed in [1] with analogy to computer vision scales is ex-
tended and applied for the inactivation of bacterial drug re-
sistance. The method was previously tried to predict selective
mutations in riboswitches a nd is here validated using results
of an in vivo experiment performed independently.
Recently,muchprogresshasbeenachievedtowardsun-
derstanding the function of small RNA structures in the con-
trol of important biological processes. From gene silencing
2 EURASIP Journal on Applied Signal Processing
occurring in nature to nucleic acid engineering, in which
innovative methods are being developed to modify or c re-
ate new functional nucleic acids, the potential contribution
of small RNAs to biotechnology and medical applications is
evident. The possibility of causing drug resistance by the di-
rect binding of short RNA transcripts with antibiotics, re-
cently investigated in bacteria by in vivo selection experi-
ments [22], is another advance in this field. We use this ex-
ample discussed in [22] as our case study.
Selection experiments such as [22] demand adequate re-
sources. A large pool of synthetic molecules with varying se-
quences needs to be created, before subjecting the pool to a
desired selective pressure. Several repeated rounds of selec-
tion and amplification cycles are then applied. Oftentimes,
without relation to a selec tion experiment, an interesting
structure is obtained and its response to mutations leading
to structural rearrangements can yield useful information on
the properties of the structure itself. In such cases, because
selection experiments are not performed on a regular basis
as they demand planning and resources, computational pre-
diction methods can help guide which mutations are worth-
while to explore further.
The paper is organized as follows. In Section 2, we in-
troduce the notation and explain the motivation of using
the Fiedler eigenvalue, or algebraic connectivity of trees, as
a similarity measure between RNAfolds to locate structural
rearrangements. We present some of the properties of the al-
gebraic connectivity of trees that directly relate to the RNA
mutation prediction problem. In Section 3, the general al-
gorithm is presented for added layers of mutation (beyond
single-point mutations). Section 4 provides numerical re-
sults for the prediction using the RNAMute package, fol-
lowed by validation of the method using data from the labo-
ratory experiment. Finally, Section 5 contains some conclud-
ing remarks and directions for further research.
2. RNA SIMILARITY WITH HIERARCHICAL
STRUCTURES USING GRAPH SPECTR A
A similar concept that is used in computer vision to treat hi-
erarchical structures (e.g., as reported recently in [16]) can
be used to predict the effect of nucleotide mutations on the
wildtype RNA secondary structure.
Let us examine the predicted secondar y structure in
Figure 1, as a result of running mfold [26] u sing dynamic
programming to perform the energy minimization on pJ697
RNA [22], with the optimal solution shown in the figure.
The folding prediction of the wildtype was used in [22]asa
model to analyze the system behavior. The problem we are
concerned with here is to predict the location of a muta-
tion leading to conformational rearr a ngement. This can ei-
ther be a single-point mutation, or if all single-point mu-
tations are silent mutations, the least amount of consecu-
tive nucleotide single-point mutations that will cause a struc-
tural transition. As a consequence of introducing the muta-
tion, the new folded structure will assume a different shape
from the wildtype secondary structure, signaling a structural
transition that may disrupt or repair functional RNA motifs.
Subdomain 1
(a)
1
2
3
45
6
λ
2
= 0.324869
Wildtype
(b)
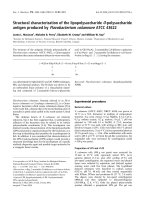
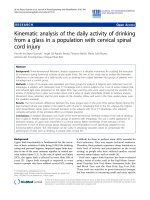
Figure 1: The predicted secondary structure of pJ697 RNA [22].
Subdomain 1 (boxed) is the region of interest for investigating con-
formation rearrangements that are thought to be responsible for
the inactivation of spectinomycin resistance in E. coli. The predicted
folding of subdomain 1 and its corresponding tree-graph represen-
tation, along with the Laplacian second eigenvalue, are also shown.
Note that loops with single isolated nucleotides, by convention, are
not accounted for as nodes in the tree-graph representation but the
5
-3
end is considered a node. Therefore we remain with exactly 6
vertices in the tree graph shown in Figure 1. Folding prediction of
the boxed subdomain 1 by itself (right structure, labeled as wild-
type) yields the same result as the folding prediction of the entire
pJ697 RNA, extracting from it the secondary structure of subdo-
main 1.
A. Churkin and D. Barash 3
For predicting selective mutations using the Laplacian
second eigenvalue, as was suggested in [2], we use the al-
gebraic connectivity of a tree as a similarity measure for
comparing between the initial RNAfold and the folded
structure of all possible mutants. The representation of RNA
secondary structures as coarse-grained tree graphs was ini-
tially explored in [7, 11, 17] and the effect of sing le-point
mutations using a combination of RNA tree-graph represen-
tation and string comparisons was addressed b efore in [12],
without the reduction to eigenvalues with the methodology
developed here. It should be noted that other similarity mea-
sures can be used (e.g., [9, 10, 18]) that convey more infor-
mation about the RNA secondary structure representation
by trees. The reduction into a coarse-grain tree-graph repre-
sentation quantified by the algebraic connectivity of trees is
simple and efficient. Moreover, it is easy to use the algebraic
connectivity as a first-order approximation for the purpose
of classification and filtering of unwanted structures when
the information is arranged in a table, because of the favor-
able properties listed in the next section.
Let T
= (V, E) be a tree with vertex set V = v
1
, v
2
, , v
n
and edge set E.Denotebyd(v) the degree of v,wherev ∈ V
is a vertex of T. The Laplacian matrix of T (also known to be
the difference of the diagonal matrix of vertex degrees D(T)
and the adjacency matrix A(T)[3, 5]) is L(T)
= (a
ij
), where
a
ij
=
⎧
⎪
⎪
⎨
⎪
⎪
⎩
d(v
i
)ifi = j,
−1ifv
i
, v
j
∈ E,
0 otherwise.
(1)
L(T) is a symmetric, positive semidefinite, and singular
matrix. The lowest eigenvalue of L(T) is always zero, since
allrowsandcolumnssumuptozero.Denotebyλ
1
≥ λ
2
≥
··· ≥
λ
n
= 0 the eigenvalues of L(T). The second small-
est eigenvalue, λ
n−1
, is called the algebraic connectivity [3]
of T and labeled as a(T). Some properties of a(T) that are
relevant to the application presented here will be mentioned
below, following the calculation of a(T) for the pJ697 RNA
secondary structure example depicted in Figure 1.
2.1. Laplacian representation of case study
The eigenvalues of the Laplacian matrix are independent of
the chosen labeling for the nodes in the tree graph, which
only amounts to interchanges of rows and columns. For a
particular labeling of the tree-graph example in the boxed
part (subdomain 1) of Figure 1, the corresponding Laplacian
matrix L(T)becomes
L
=
⎛
⎜
⎜
⎜
⎜
⎜
⎜
⎜
⎜
⎝
1 −10000
−12−1000
0
−12−100
00
−13−1 −1
000
−110
000
−101
⎞
⎟
⎟
⎟
⎟
⎟
⎟
⎟
⎟
⎠
,(2)
where a(T) corresponding to the tree T of the wildtype struc-
ture in Figure 1 is 0.324869, in between a star of 6 vertices and
a linear tree of 6 vertices.
The algebraic connectivity a(T) possesses special proper-
ties that are advantageous for the RNA secondary structure
mutation prediction application presented here.
Properties of algebraic connectivity for trees
Let T
= (V, E)beatreeonn vertices with algebraic connec-
tivity a(T). Then:
(1) 0
≤ a(T) ≤ 1,
(2) a(T)
= 0 if and only if T is not connected,
(3) a(T)
= 1 if and only if T = K
1,n−1
is a star on n vertices
(upper bound),
(4) a(T)
= 2(1 − cos(π/n)) if and only if T = P
n
is a path
(lower bound),
The algebraic connectivity a(T), or the second eigenvalue
of L(T), is smallest but positive when the RNA secondary
structure assumes a linear shape (a path) and becomes iden-
tically 1 when the RNA secondary structure assumes a star
shape [3, 4, 14]. Although other possibilities exist to distin-
guish between tree topologies, the second eigenvalues of the
coarse-grain tree graphs are nonexpensive to calculate for the
small-sized matrices we are dealing with and possess intuitive
meanings suppor ted by mathematical theorems.
3. METHOD AND IMPLEMENTATION
USING RNAMUTE
We use the algebraic connectivity a(T)ofatreeT to con-
struct a stepwise procedure that attempts to locate the least
number of mutations needed to disrupt an RNA motif, spec-
ifying their positions in the wildtype sequence as the final
output. We note that simply visualizing the new structures
obtained by performing the allowed mutations is not feasible
in practice, unless we devise a procedure that enables us to
inspect the structure of only selective mutants.
(1) Let N be the number of nucleotides in the given wild-
type sequence. If N>100, try subdividing the sequence
into independently folded domains, such as subdomain 1 in
Figure 1 (the folding prediction of this subdomain by itself is
the same as the folding prediction of the whole sequence in
that region). The subdivision, if necessary, is performed only
once and is based on prior knowledge of the wildtype struc-
ture. Denote by N
the number of nucleotides in the artificial
sequence, corresponding to the subdomain of interest.
(2) Serially or in parallel, run a folding prediction cal-
culation (Zuker’s mfold or Vienna RNAfold) for each of the
N
× 3 single-point mutants, since for each nucleotide there
are 3 possible mutations. Extract the tree T corresponding
to the secondary structure of each mutant in the form of
a Laplacian matrix L(T). Calculate the algebraic connectiv-
ity a(T), which is the second eigenvalue of L(T). Derive the
number of vertices in T, how many mutants will assume the
shape T (frequency of occur rence). Arrange the data in an
eigenvalue table, as illustrated in Figure 2. Additional struc-
ture comparison measures and energy information can be
added to the table in separate columns. The RNAMute pack-
age, which is currently under development and will be f ully
4 EURASIP Journal on Applied Signal Processing
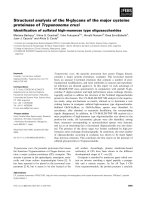
Figure 2: RNAMute screen output of one table categorization.
Eigenvalue table for the prediction of single-point deleterious muta-
tions in the subdomain (boxed) of pJ697 RNA [22]. The clustering
to discrete eigenvalues enables to discriminate redundant folding
possibilities and concentrate on predicting candidates for secondary
structure conformation rearrangements that can cause inactivation
of spectinomycin resistance in E. coli. An asterix is marked whenever
thesamenumberofverticesasinthewildtypetree-graphstruc-
ture occurs. Furthermore, not shown here, clustering to different
ranges of coarse-grained tree-edit distances is performed in RNA-
Mute, based on Shapiro and Zhang [18].
described elsewhere, also calculates other distance informa-
tion such as Shapiro and Zhang’s RNA tree distance [18]and
the Vienna RNA distance [7].
(3) If all N
× 3 single-point mutants correspond to the
same tree T of the wildtype, add additional layers of muta-
tion by extracting the tree T and calculating the features in
Step (2) for each one of the (N
× 3)
2
double-point muta-
tions, then (N
× 3)
3
triple-point mutations, ,(N
× 3)
m
m-point mutations, as necessary (see stopping criterion in
next step).
(4) Repeat the previous step until m
= m
∗
,wherem
∗
is
the minimal number of mutations needed so that at least one
of the mutants folds to a tree which is different than T of the
wildtype. Attempt to use prior information from step i<j
at step j, using data from the biolog y experiment if available,
suchthatatstep j only (N
× 3)
m
j
−m
i
folding calculations are
needed instead of (N
× 3)
m
j
.
(5) When m
= m
∗
, analyze the final eigenvalue table and
in the case of RNAMute, interactively experiment with vari-
ous eigenvalues that were calculated and stored. First, check
the eigenvalues (i.e., visualize the predicted folded struc-
ture of mutants leading to this eigenvalue) that are furthest
from the eigenvalue corresponding to the tree T of the wild-
type. Second, check eigenvalues with different number of
vertices than the wildtype, especially those with peculiarities
(extreme number of vertices, low frequency of occurrence).
When finding an interesting conformation rearrangement,
go back from the artificial sequence with N
<Nnucleotides
to the original sequence with N nucleotides and report the
positions of the nucleotide mutations within the sequence,
leading to that transition.
At the completion of these steps, we obtain predicted mu-
tations that lead to conformation rearrangements and can
be tested in an experiment. The prescribed method is im-
plemented using a computer package written in C and Java
called RNAMute, which currently calculates all sing le-point
mutations. In addition to eigenvalue information, RNA-
Mute includes tables with distance measures available in the
RNADistance module that is a part of the Vienna package
[7, 8].
4. RESULTS OF CASE STUDY
We concentrate on predicting sing le-point mutations that
will cause structural rearrangements with respect to the wild-
type structure of RNA transcripts from pJ697 [22] depicted
in Figure 1. The six single-point mutations in subdomain 1
of Figure 1, found by the selec tion experiment to inactivate
spectinomycin resistance, are listed in Tabl e 1. Another use-
ful finding as a result of an in vitro experiment performed in
[22] with radio-labeled transcr ipts corresponding to pJ697
and one of the inactivating point mutations (referenced as
“mut 1”) is the ability of a single-point mutation to alter the
distribution of RNA conformers. This supports the hypothe-
sis that a single-point mutation can lead to a secondary struc-
ture conformation rearrangement, which is responsible for a
change in the function of the RNA. Therefore, if we predict
possible mutations that are causing structural transitions in
subdomain 1 of Figure 1, it is likely that those mutations are
serious candidates to inactivate spectinomycin resistance in
E. coli. One such mutation was experimentally found in [22].
We implemented Step (1) of the algorithm (previous sec-
tion) by verifying that the folding prediction of subdomain 1
(Figure 1) is the same as the folding prediction of the whole
sequence in that particular domain. Furthermore, we note
that the six mutations reported in Figure 4 that alter the sub-
domain conformation also alter the full RNA conformation
as verified using mfold. Thus, our assumption that the subdo-
main of Figure 1 is an independently folded domain is likely
to hold in the case study examined here. Consequently, our
artificial structure for the purpose of mutation prediction
consists only of the boxed segment in Figure 1 whichis97nt
long. Performing Step (2), the RNAMute package automati-
cally generates an eigenvalue table for all 97
× 3 = 291 single-
point mutations, depic ted in Figure 2. In this case, since there
is a large amount of single-point mutations leading to struc-
tural rearr angements, we stop the procedure described in the
previous section at m
∗
= 1.
4.1. Analysis with RNAMute
Figure 2 lists the structural rearrangement predictions of
all possible single-point mutations, ranked by their second
eigenvalue of the Laplacian matrix corresponding to the tree-
graph representation of their folding prediction. It is ex-
pected that some of these folded structures will not occur in
nature. We would like to examine how many of the inacti-
vating mutations found by the experiment (Table 1)match
various eigenvalues listed in Figure 2 and whether, provided
we only have the information in Figure 2, we could have
suggested meaningful mutations to test as candidates for
A. Churkin and D. Barash 5
Table 1: Six single-point mutations in the subdomain (boxed) of
pJ697 RNA [22] that inactivate spectinomycin resistance in E. coli,
obtained by a selection experiment. From the observations in [22]it
is likely that a conformation rearrangement in the secondary struc-
ture is associated with the inactivation. WT stands for the wildtype,
the six nucleotide mutations are highlighted with the shaded boxes.
Mutation Sequence
WT
CCUCGGCCCAGGAAGCUAUGCAUGC
CCCUGCCGUACCCGGGUCGAAUUCG
ACCCCUUGUCUGGGGCGGAUGUAUU
UUGGGAGGGUAGCUGGCGGAGG
1
CCUCGGCCCAGGAAGCUAUGCAUGC
CCCUGCCGUACCCGGGUCGAAUUCG
ACCCCUUGUC
C GGGGCGGAUGUAUU
UUGGGAGGGUAGCUGGCGGAGG
2
CCUCGGCCCAGGAAGCUAUGCAUGC
CCCUGCCGUACCCGGGUCGAAUUCG
ACCCCUUGUCUGG
A GCGGAUGUAUU
UUGGGAGGGUAGCUGGCGGAGG
3
CCUCGGCCCAGGAAGCUAUGCAUGC
CCCUGCCGUACCCGGGUCGAAUUCG
ACCCCUUGUCUGGGGCGGAUGUAUU
U
A GGGAGGGUAGCUGGCGGAGG
4
CCUCGGCCCAGGAAGCUAUGCAUGC
CCCUGCCGUACCCGGGUCGAAUUCG
ACCCCUUGUCUGGGGCGGAUGUAUU
UUGGGAGGG
A AGCUGGCGGAGG
5
CCUCGGCCCAGGAAGCUAUGCAUGC
CCCUGCCGUACCCGGGUCGAAUUCG
ACCCCUUGUCUGGGGCGGAUGUAUU
UUGGGAGGGU
G GCUGGCGGAGG
6
CCUCGGCCCAGGAAGCUAUGCAUGC
CCCUGCCGUACCCGGGUCGAAUUC
A
ACCCCUUGUCUGGGGCGGAUGUAUU
UUGGGAGGGUAGCUGGCGGAGG
inactivating mutations in an experiment. Selection experi-
ments are biased and thus they are likely to miss interesting
mutations that can potentially be predicted using computer
simulations.
For each of the six inac tivating mutations in Figure 4,
we simulate a folding prediction using mfold/Vienna (as was
performed for “mut 1” in [22]). We then calculate the eigen-
value associated with that folding. Figure 4 captures the five
distinct tree graphs corresponding to the six inactivating mu-
tations and their associated eigenvalues. Examining Figure 2,
it is noted that although the wildtype structure and mu-
tations 1, 2, 5 fall into the same eigenvalue, their overall
structure is different. For example, while mutations 1, 2 pos-
sess a multibr anch loop and two hairpins, the wildtype pos-
sesses a single hairpin, although their tree graph compactness
(hence second eigenvalue) is the same. To relieve this ambi-
guity, we further subdivide the tree-graphs associated with
the same second eigenvalue into various groups according to
their edit distances as suggested in Shapiro and Zhang [18]
(a)
(b)
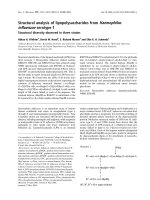
Figure 3: RNAMute screen output of one single-point mutation,
U77A of the full sequence, used in our case study example. Infor-
mation includes the minimal energies of the wildtype and mutant,
their sequences, their secondary structure representation in t he Vi-
enna dot-bracket notation and Shapiro’s coarse-grain string nota-
tion, and the distances between the two st ructures using Vienna’s
RNAdistance and Shapiro’s tree-edit distance.
and available in our RNAMute implementation. Class (A) are
mutations possessing “Shapiro distances” [7] in the range of
0–20 with respect to the wildtype, corresponding to a tree
graph that is considerably close to the wildtype structure
with respect to edit operations. Class (B) are mutations pos-
sessing “Shapiro distances” in the range of 81–99 with respect
to the wildtype, corresponding to a tree graph surrounding
mutations 1, 2. Class (C) are mutations possessing “Shapiro
distances” in the range of 21–56 with respect to the wildtype,
6 EURASIP Journal on Applied Signal Processing
λ
2
= 0.324869
(a)
λ
2
= 0.324869
(b)
λ
2
= 0.267949
(c)
λ
2
= 0.260323
(d)
λ
2
= 0.324869
(e)
λ
2
= 0.225377
(f)
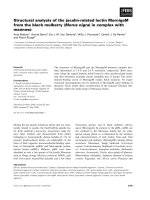
Figure 4: The secondary structure of the six mutants from Table 1 ,
found in [22] to inactivate spectinomycin resistance in E. coli by a
selection experiment. Their tree-graph representation and associ-
ated eigenvalues are drawn.
corresponding to a tree graph surrounding mutation 5. Thus,
our analysis includes various measures to estimate similar-
ity of secondary structures, a strategy that is taken in RNA-
Mute. Furthermore, from Figure 2 we observe possibilities
for peculiar mutant structures, such as a linear-shaped tree
graph with 8 vertices corresponding to λ
2
= 0.166717. Its
low frequency of occurrences (two mutations out of any pos-
sible single-point mutations) is not necessarily an indication
for false positives; a selection experiment may have skipped
these mutations that are highly interesting to try in addi-
tional experiments. Such mutations are candidates for vul-
nerable spots in the wildtype sequence, potentially triggering
a conformational switch that will lead to even stronger inac-
tivation of spectinomycin resistance. Thus, our analysis with
RNAMute (see Figure 3) can detect patterns that are worth
exploring in additional laboratory experiments.
4.2. Other case studies
Thecasestudyreportedinthispaper[22] was the first we
analyzed with RNAMute. Based on the gathered results, we
have tried other test cases that require less assumptions to
be made prior to predictions. A class of such test cases that
will be reported in the future can potentially be used for the
examination of phenotypic data available from hepatitis C
virus (HCV) experiments [19, 21]. For example, RNAMute
was able to single out a conformational rearranging mutation
in the 5BSL3.2 structure that was reported experimentally in
[21]. These test cases are shorter in their sequence lengths
(< 100 nt), and they can be analyzed independently without
further assumptions.
5. CONCLUSIONS
We have presented a method and its RNAMute package
implementation for predicting nucleotide mutations that
may intervene with RNA function through conformation
rearrangements in the secondary structure. Admittedly, the
method has several limitations, such as relying on the ac-
curacy of energy minimization methods and the use of a
coarse-grained measure. For longer sequences, this approach
may fail, unless there are associated cases in which compar-
ative modeling [6] can be used. Still, for some sequences it
has already been shown to match experimental results (e.g.,
the leptomonas collosoma mentioned in [2]) and our recent
RNAMute implementation includes fine-grain measures as
well. The method is demonstrated on a case study by match-
ing the prediction results with known point mutations that
inactivate spectinomycin resistance in bacteria, obtained by
a selection experiment [22]. Comparison of predicted muta-
tions with the ones found by the experiment demonstrates
the potential of the method. Thus, it can be used on a variety
of RNA structures before planning an in vivo experiment, to
detect vulnerable spots and suggest mutations that are inter-
esting for further exploration.
ACKNOWLEDGMENTS
We thank James Maher from Mayo Clinic for his valuable
comments and feedback to our work. The research was sup-
ported by a Grant from the Israel-USA Binational Science
Foundation (BSF) 2003291.
A. Churkin and D. Barash 7
REFERENCES
[1] D. Barash and D. Comaniciu, “A common viewpoint on broad
kernel filtering and nonlinear diffusion,” in Proceedings of the
4th International Conference on Scale-Space Theories in Com-
puter Vision (Scale-Space ’03), vol. 2695 of Lecture Notes in
Computer Science, pp. 683–698, Isle of Skye, UK, June 2003.
[2] D. Barash, “Second eigenvalue of the Laplacian matrix for pre-
dicting RNA conformational switch by mutation,” Bioinfor-
matics, vol. 20, no. 12, pp. 1861–1869, 2004.
[3] M. Fiedler, “Algebraic connectivity of graphs,” Czechoslovak
Mathematical Journal, vol. 23, pp. 298–305, 1973.
[4] R. Grone and R. Merris, “Algebraic connectivity of trees,”
Czechoslovak Mathematical Journal, vol. 37, no. 4, pp. 660–670,
1987.
[5]R.Grone,R.Merris,andV.S.Sunder,“TheLaplacianspec-
trum of a graph,” SIAM Journal on Matrix Analysis and Appli-
cations, vol. 11, no. 2, pp. 218–238, 1990.
[6] R. R. Gutell, J. C. Lee, and J. J. Cannone, “The accuracy of ri-
bosomal RNA comparative structure models,” Current Opin-
ioninStructuralBiology, vol. 12, no. 3, pp. 301–310, 2002.
[7] I. L. Hofacker, W. Fontana, P. F. Stadler, L. S. Bonhoeffer, M.
Tacker, and P. Schuster, “Fast folding and comparison of RNA
secondary structures,” Monatshefte f
¨
ur Chemie, vol. 125, no. 2,
pp. 167–188, 1994.
[8] I. L. Hofacker, “Vienna RNA secondary structure server,” Nu-
cleic Acids Research, vol. 31, no. 13, pp. 3429–3431, 2003.
[9] T. Jiang, G. Lin, B. Ma, and K. Zhang, “A general edit distance
between RNA structures,” Journal of Computational Biology,
vol. 9, no. 2, pp. 371–388, 2002.
[10] J. Kitagawa, Y. Futamura, and K. Yamamoto, “Analysis of the
conformational energy landscape of human snRNA with a
metric based on tree representation of RNA structures,” Nu-
cleic Acids Research, vol. 31, no. 7, pp. 2006–2013, 2003.
[11]S Y.Le,R.Nussinov,andJ.V.Maizel,“TreegraphsofRNA
secondary structures and their comparisons,” Computers and
Biomedical Research, vol. 22, no. 5, pp. 461–473, 1989.
[12] H. Margalit, B. A. Shapiro, A. B. Oppenheim, and J. V. Maizel,
“Detection of common motifs in RNA secondary structures,”
Nucleic Acids Research, vol. 17, no. 12, pp. 4829–4845, 1989.
[13] D. H. Mathews, J. Sabina, M. Zuker, and D. H. Turner, “Ex-
panded sequence dependence of thermodynamic parameters
improves prediction of RNA secondary structure,” Journal of
Molecular Biology, vol. 288, no. 5, pp. 911–940, 1999.
[14] R. Merris, “Characteristic vertices of trees,” Linear and Multi-
linear Algebra, vol. 22, pp. 115–131, 1987.
[15] R. Nussinov and A. B. Jacobson, “Fast algorithm for predicting
the secondary structure of single-stranded RNA,” Proceedings
of the National Academy of Sciences, vol. 77, no. 11, pp. 6309–
6313, 1980.
[16] A. Shokoufandeh, D. Macrini, S. Dickinson, K. Siddiqi, and S.
W. Zucker, “Indexing hierarchical structures using graph spec-
tra,” IEEE Transactions on Pattern Analysis and Machine Intel-
ligence, vol. 27, no. 7, pp. 1125–1140, 2005, Special issue on
syntactic and structural pattern recognition.
[17] B. A. Shapiro, “An algorithm for comparing multiple RNA sec-
ondary structures,” Computer Applications in the Biosciences,
vol. 4, no. 3, pp. 387–393, 1988.
[18] B. A. Shapiro and K. Zhang, “Comparing multiple RNA sec-
ondary structures using tree comparisons,” Computer Applica-
tions in the Biosc iences, vol. 6, no. 4, pp. 309–318, 1990.
[19] D. B. Smith and P. Simmonds, “Characteristics of nucleotide
substitution in the hepatitis C virus genome: constraints on se-
quence change in coding regions at both ends of the genome,”
Journal of Molecular Evolution, vol. 45, no. 3, pp. 238–246,
1997.
[20] M.S.WatermanandT.F.Smith,“RNAsecondarystructure:
a complete mathematical analysis,” Mathematical Bioscie nces,
vol. 42, no. 3-4, pp. 257–266, 1978.
[21] S. You, D. D. Stump, A. D. Branch, and C. M. Rice, “A cis-
acting replication element in the sequence encoding the NS5B
RNA-dependent RNA polymerase is required for Hepatitis C
virus RNA replication,” Journal of Virology,vol.78,no.3,pp.
1352–1366, 2004.
[22] J. M. Zimmerman and L. J. Maher III, “In vivo selection of
spectinomycin-binding RNAs,” Nucleic Acids Research, vol. 30,
no. 24, pp. 5425–5435, 2002.
[23] M. Zuker and P. Stiegler, “Optimal computer folding of large
RNA sequences using thermodynamics and auxiliary informa-
tion,” Nucleic Acids Research, vol. 9, no. 1, pp. 133–148, 1981.
[24] M. Zuker and D. Sankoff, “RNA secondary structures and their
prediction,” Bulletin of Mathematical Biology,vol.46,no.4,pp.
591–621, 1984.
[25] M. Zuker, “Calculating nucleic acid secondary structure,” Cur-
rent Opinion in Str uctural Biology, vol. 10, no. 3, pp. 303–310,
2000.
[26] M. Zuker, “Mfold web server for nucleic acid folding and hy-
bridization prediction,” Nucleic Acids Research, vol. 31, no. 13,
pp. 3406–3415, 2003.
Alexander Churkin received his B.S. degree
with distinction from the Department of
Computer Science at Ben-Gurion Univer-
sity in 2004. Since S eptember 2004, he has
been a graduate student in the Department
of Computer Science at Ben-Gurion Uni-
versity. His research interests include bioin-
formatics, RNA structure predictions, and
scientific computing.
Danny Barash received his Ph.D. degree in
applied science in 1999 from the University
of California at Davis. From 1999 to 2001,
he was employed at Hewlett Packard Lab-
oratories in the Technion, Israel, pursuing
research on image processing and computer
vision. From 2001 to 2003, he was a Howard
Hughes Medical Institute Postdoctoral Fel-
low at New York University and a Research
Fellow at the Institute of Evolution in the
University of Haifa, Israel, where he made a transition to compu-
tational biology. Since 2004, he has been with the Department of
Computer Science at Ben-Gurion University, where he is currently
an Assistant Professor in bioinformatics. His secondary affiliation is
with the Institute of Evolution at Haifa University. His research in-
terests include computational biology, RNA structure predictions,
computational imaging, and numerical analysis.