Application of the Ecosystem Model to the Mathematical Simulation of Water Environment Dynamic under Anaerobic State in the Organically Polluted Agricultural Reservoir
Bạn đang xem bản rút gọn của tài liệu. Xem và tải ngay bản đầy đủ của tài liệu tại đây (2.91 MB, 62 trang )
Master’s thesis
Application of the Ecosystem Model to the Mathematical
Simulation of Water Environment Dynamic under Anaerobic State in the Organically Polluted Agricultural Reservoir
Hoang Quang Duong
Laboratory of Water Environment Engineering
Department of Bioproduction Environmental Sciences
Graduate School of Bioresource and Bioenvironmental Sciences
Kyushu University
2016
TABLE OF CONTENTS
1 Introduction
01
2 Study area and observation data
03
2.1 Study area
03
2.2 Observation data
2.2.1 Field observation
2.2.2 Water quality analysis by laboratory experiment
03
04
04
3 Dynamic characteristics of water quality under anaerobic state
25
3.1 Annual characteristics of water quality under anaerobic state in the reservoir
25
3.2 Important points to modified ecosystem model
40
4 One-dimensional vertical ecosystem model and scenario analysis
43
4.1 One-dimensional vertical ecosystem model
4.1.1 Construction of one-dimensional vertical ecosystem model
4.1.2 Simulated results
43
43
47
4.2 Scenario analysis
55
5 Conclusion
58
References
59
1. Introduction
There is growing public concern about environmental issues, and such topics as global warming
and sustainable growth are frequency the subject of comment in the press and other media. Public
pressure continues to grow for greater efforts to be made up the environment and remedy the pollution
and degradation that has arisen over the last hundred years.
Water makes up a major part of the environment, together with land and air, and is vital to the
maintenance of life (J.C.CURRIE and A.T.PEPPER 1993). Water, like energy, clean air and solid
organic and soil organic matter makes an essential contribution to the maintenance of economic
productivity, social well-being and lifestyle and the maintenance of nature and ecosystem services
and various aspects should be treated from that perspective. Water resources are under stress worldwide and one of the elements of this stress-water quality has increasingly become a crucial issue for
researchers and scientists in their studies (Tasuku Kato 2005). With the developing industrialization
and increasing populations, the range of requirements for water has increased together with greater
demands for higher quality water. It is estimated that 8% of worldwide water use is for household
purposes (drinking water, bathing, cooking, sanitation and gardening), 22% for industrial uses
(mainly hydropower or nuclear power), and 70% for crop irrigation (Sterling and Vintinner, 2008).
Regarding the demand for quality water for agricultural irrigation, there are no national standards or
regulations for irrigation water quality. Irrigation of food crops presents a possible health risk to food
consumers if the quality of the irrigation is inadequate, particularly with respect to pathogens and
toxic compounds. In term of agricultural use of water, agricultural ponds are dominant a considerable
amount of water for irrigation. The properties closed water body leads to accumulating the pollution
sources in the lake. It depends on the characteristics of a lake that has its own pollutants sources. One
of the most common pollutants is organic contaminant which is the reason of many serious water
issues in the water bodies. The annual temperature cycle is one of the most significant determinants
of the physical, chemical, and biological interactions of a lake or reservoir. The significance of thermal stratification to the eutrophication process and to reservoir restoration lies in the separation of
the upper and lower lake zones during the summer through differences in water density. The separation of layer prevents the transport oxygen has caused the loss of oxygen in the deep part of the
reservoir which is called anaerobic state. As summer progress, the process increase phosphorus, nitrogen in the hypolimnion and frequency are transported vertically in winter season into the water
surface area where to subsidize algal growth. This biological process response to the excess nutrient
input to the lake is known as eutrophication. Eutrophication is responsible for many water supply
problems (WHO, 1981). Common lake and reservoir problem are excessive algal growth, deficient
fishery. Water quality in terms of transparency, color, and the odor is often related to a number of
algae present. Cultural eutrophication is a central concern in lake management. Protection of lakes
and reservoirs from eutrophication has been of international concern for a number of years. Therefore,
water quality assessments and forecasting become a matter of urgency for water quality management
1
issues. Although many methods have been developed to rectify the adverse impacts of cultural eutrophication. It consists of evaluation and controlling activities of the water quality in field, simulation
model in the laboratory or mathematical modeling on the computer etc. Among them, using mathematical modeling is a high effective method to assess the relative importance of processes affecting
eutrophication and the potential success of different lake treatment strategies. Moreover, the lake
manager must acquire a sufficient database to determinate what dominant lake progresses to cause a
lake problem, decide which management techniques affect lake processes sufficiently to reduce the
problem, and evaluate cost and benefits of management techniques. Modeling is a tool that can provide the information for the decision-making process. In addition, the mathematical model has a capacity for utilizing in multi-objective. Ideally, it offers the lake manager a sophisticated evaluation at
a comparatively low cost to analyze expensive lake management technical and to optimize the money
spent on a lake management program. Because of the strength of its, the mathematic model has applied for worldwide to simulation the variability of dissolved elements such as nitrogen (NH4+, NO3) or major ions Carbonate (C), Calcium (Ca)…etc as well as the seasonal variation of Chl.a and DO
in eutrophic water bodies. However, the evaluation and simulation the variability nutrient salts concentration are considerable differences between aerobic lake and anaerobic lake. It is explained that
the concentration of nutrient varies dramatically depending on the erosion mechanism in the bottom
anaerobic condition lake. Hence, the internal nutrient loading of phosphorus and nitrogen can’t display sufficiently in these modeling. Moreover, there is no research on modeling the variation of sulfide under anaerobic state in the organically polluted reservoir. To overcome these limitations, the
ecosystem model meets the requirement two criteria (i) simulation the characteristic of dynamic characteristics of water quality (ii) reflect the biological-chemical process simulation such as nitrificationdenitrification, iron reduction and sulfate reduction under anaerobic conditions.
The purpose of this study is to develop a modified ecosystem model based on a general hydrodynamic model in order to apply for water quality simulation under anaerobic conditions. To achieve
this objective, the operation is followed by these steps (1) Evaluation and analysis the dynamic characteristic of water quality throughout by data observation collection. Data includes of the collection
from the surface to bottom of the lake at the central of study areas and laboratory activities consist of
concentration measurements, biological determination. (2) The results are utilized to correct and
develop by applying Fortran programming computer software.
2
2.
Study area and observation data
2.1
Study area
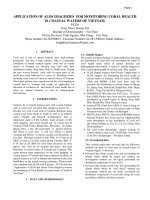
The target of the study is a regulating reservoir (No. 5 reservoir) (Figure 2.1) that is located in
Ito campus of Kyushu University, Itoshima Peninsula, Fukuoka Prefecture, Japan. No. 5 reservoir is
a deep water body (water surface area of ca. 13,800 m3, pondage of ca. 63,000 m3, and maximum
water depth of 8m), was created to store rainfall and supply water for cultivation activities at the
downstream crop area. There are two box culverts that include box culvert 1 (BC1), located at the
Southwest of the reservoir, and box culvert 2 (BC2), located at the North of the reservoir (Figure
2.1). The inflow from BC1 is treated by a pollution treatment facility to reduce the concentration of
organic material before going to the No.5 reservoir. Most of the organic pollution comes from BC2
where runoff directly flows into the reservoir without any treatment. The watershed of the reservoir
is deforestation area and agricultural regions. Therefore, runoff usually carries a lot of humic acids
from these regions to the reservoir, making heavy organic pollution in the water body. Every summer,
the high concentration of organic matter is the main reason to exacerbate the thermal stratification,
leading to the drop of DO at the deep parts of the reservoir. At the benthic zone, due to lack of DO,
many biochemical reduction reactions such as iron reduction, sulfate reduction occur, release nutrient
salts, iron, and sulfide, causing considerable deterioration of water environment.
2.2
Observation data
In 2015, the monitoring periods began on April 1 and completed on December 9. The water
quality analysis was conducted once a week. In the 6-month survey, there are two kinds of water
quality analysis activity were implemented, including outdoor analysis activities and indoor analysis
activities.
Fig. 2.1 No.5 reservoir and box culverts
3
2.2.1
Outdoor analysis activities
The outdoor analysis activities that consist of DO, ORP, EC, pH, water temperature and water
samples collection were conducted on the fixing point at the center of the reservoir. Water samples
were collected 1-m intervals from 0m to 8m. Nine water samples in total were contained in the two
liters plastic bottles and save on the boat before were analyzed in the laboratory by many measurements to get the water quality data. DO, ORP, EC, pH and water temperature were directly recorded
in the reservoir 0.5-m intervals by using a water quality probe. A Secchi-disk, circular disk 30 cm in
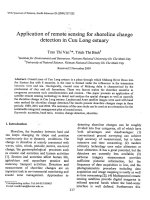
diameter, was used to determine transparency. The meteorological data that consist of air temperature,
relative humidity, wind speed, solar radiation, and rainfall were measured automatically every ten
minutes. The detailed data of outdoor analysis are shown in Figure 2.2 and from Table 2.1 to Table 2.6.
2.2.2
Indoor analysis activities
Water samples were analyzed in the laboratory in order to determine the concentration of water
quality indicators including Chlorophyll-a, TN, TP, TOC, DOC, NH4-N, NO3-N, PO4-P, Cl, E254,
SO42-, silica, total iron ion, sulfide. The concentration of Chlorophyll-a was determined by using a
submersible fluorescence probe (FluoroProbe, bb-Moldaenke, Germany). The concentration of NH4N was measured by Quick Ammonia AT-2000. The analysis of NO3-N, SO42- and Cl were analyzed
by an ion chromatography method using AS50 auto-sampler (was manufactured by DIONEX Corporation). The concentration of sulfide was determined by using methylene blue method (DR5000,
Wind speed (m/s)
40
o
Relative humidity (%) Air temperature ( C)
HACH). The TOC, DOC were analyzed by using wet-ultraviolet oxidation method (Sievers 900,
GEAI). The TN, TP, PO4-P, E254, total iron ion, silica were measured using a portable spectrophotometer (DR5000, HACH). The detailed data of indoor analysis are shown from Table 2.7 to Table
2.20.
30
20
10
0
6
7
8
9
10
11
10
5
0
12
4
5
6
7
8
9
10
11
12
4
5
6
7
8
9
10
11
12
2
5
Solar radiation (W/m)
4
15
100
80
60
40
20
0
1000
4
5
6
7
8
9
10
11
12
4
5
6
7
8
9
10
11
12
500
0
Rainfall (mm)
15
10
5
0
Fig. 2.2 Meteorology data in 2015 (every ten minutes)
4
Table 2.1 Water temperature observation in 2015 (oC)
Y/M/D
2015/04/01
2015/04/09
2015/04/15
2015/04/22
2015/04/28
2015/05/07
2015/05/13
2015/05/20
2015/05/27
2015/06/02
2015/06/10
2015/06/17
2015/06/24
2015/07/08
2015/07/15
2015/07/29
2015/08/05
2015/08/20
2015/08/27
2015/09/03
2015/09/08
2015/09/18
2015/09/24
2015/09/30
2015/10/07
2015/10/14
2015/10/21
2015/10/28
2015/11/04
2015/11/11
2015/11/25
2015/12/02
2015/12/09
0.0m
16.79
13.96
14.50
17.15
20.42
21.46
20.15
23.01
24.85
25.69
23.69
25.33
25.25
24.48
28.93
30.08
31.74
29.59
26.71
27.12
23.76
23.23
25.08
23.74
21.52
19.92
20.52
19.11
17.75
17.89
16.45
13.27
12.24
0.5m
16.74
13.90
14.50
16.75
20.22
21.33
20.10
22.50
24.22
25.43
22.92
25.09
25.25
23.99
28.12
29.89
31.56
29.38
25.87
25.91
23.77
23.17
24.05
23.76
21.45
19.68
20.40
19.06
17.52
17.72
16.46
13.26
11.84
1.0m
15.92
13.87
14.51
16.70
19.28
21.21
20.01
21.30
24.06
25.14
22.62
24.96
25.06
23.81
27.51
29.62
31.51
29.19
25.28
25.66
23.78
23.02
23.90
23.76
21.38
19.62
20.33
18.95
17.35
17.70
16.45
13.20
11.77
1.5m
14.43
13.84
14.50
16.05
17.55
20.28
19.71
20.44
22.43
23.58
21.81
22.91
24.03
23.51
25.69
27.67
31.32
29.12
25.08
25.40
23.79
22.79
23.65
23.75
21.34
19.60
20.31
18.93
17.24
17.70
16.47
13.19
11.73
2.0m
13.13
13.79
14.40
14.71
15.59
16.84
19.39
19.05
19.55
20.91
20.68
21.16
21.91
23.17
23.70
25.13
27.48
28.65
24.85
25.03
23.79
22.72
23.25
23.75
21.32
19.60
20.28
18.91
17.20
17.69
16.47
13.19
11.71
2.5m
11.13
13.63
13.72
13.50
14.16
14.45
15.57
16.56
16.22
16.83
18.96
18.87
19.41
21.52
21.02
22.37
23.50
26.76
24.64
24.65
23.79
22.60
22.88
23.74
21.31
19.59
20.25
18.90
17.16
17.66
16.47
13.18
11.67
3.0m
10.33
11.66
12.47
12.41
12.54
12.65
13.61
14.09
13.84
14.26
15.69
16.03
16.56
18.07
18.57
19.41
19.80
23.00
24.33
23.78
23.75
22.27
22.24
22.77
21.29
19.58
20.20
18.89
17.14
17.56
16.47
13.18
11.65
3.5m
9.25
9.96
10.53
10.96
10.78
11.46
11.85
11.71
12.15
12.56
13.14
13.56
13.93
14.99
15.27
16.49
16.85
18.58
22.45
21.82
22.44
21.73
21.10
21.13
21.29
19.57
19.87
18.89
17.11
17.43
16.47
13.18
11.64
5
4.0m
8.98
9.24
9.63
9.74
9.75
10.34
10.47
10.28
10.75
11.12
11.34
11.63
12.05
13.08
13.13
14.00
14.37
15.65
17.33
18.22
18.28
18.86
18.84
19.09
19.64
19.52
19.07
18.85
17.10
17.29
16.47
13.17
11.63
4.5m
8.73
8.83
8.88
9.24
9.34
9.55
9.86
9.77
10.06
10.15
10.34
10.53
10.68
11.64
11.64
12.30
12.59
13.55
14.10
14.47
15.38
16.64
15.98
16.61
16.97
17.61
17.49
18.67
17.07
16.92
16.46
13.17
11.63
5.0m
8.44
8.58
8.66
8.83
8.88
9.19
9.26
9.35
9.48
9.61
9.67
9.99
10.12
10.54
10.68
11.20
11.38
12.10
12.32
12.91
13.30
14.01
13.44
14.23
14.92
14.68
15.25
15.41
16.36
15.81
16.45
13.17
11.63
5.5m
8.18
8.43
8.49
8.65
8.74
8.86
8.99
9.08
9.21
9.26
9.40
9.60
9.67
10.08
10.15
10.58
10.68
11.15
11.41
11.60
11.91
12.25
11.94
12.62
12.80
13.06
13.27
13.73
13.91
14.49
14.94
13.17
11.63
6.0m
8.08
8.37
8.42
8.54
8.62
8.76
8.86
8.98
9.04
9.16
9.27
9.41
9.47
9.78
9.85
10.13
10.25
10.59
10.82
10.90
11.03
11.37
11.40
11.58
11.79
12.04
12.34
12.45
12.64
13.07
13.66
13.17
11.63
6.5m
8.04
8.27
8.41
8.50
8.62
8.74
8.84
8.96
9.04
9.16
9.25
9.34
9.43
9.64
9.74
9.94
10.03
10.33
10.49
10.62
10.78
10.97
10.97
11.24
11.44
11.58
11.68
11.84
12.07
12.28
12.74
13.15
11.62
7.0m
8.04
8.24
8.36
8.50
8.63
8.75
8.85
8.95
9.04
9.13
9.25
9.34
9.43
9.61
9.70
9.89
10.00
10.26
10.37
10.47
10.57
10.71
10.88
11.04
11.17
11.33
11.46
11.60
11.74
11.89
12.33
13.09
11.61
7.5m
8.06
8.24
8.35
8.51
8.62
8.76
8.86
8.95
9.03
9.13
9.25
9.34
9.43
9.61
9.73
9.91
10.08
10.32
10.41
10.53
10.63
10.73
10.89
11.04
11.10
11.20
11.38
11.49
11.53
11.77
12.00
12.26
11.61
8.0m
8.09
8.29
8.44
8.53
8.64
8.78
8.86
8.96
9.17
9.31
9.36
9.43
9.59
9.80
9.92
10.10
10.20
10.46
10.52
10.63
10.71
10.78
10.90
11.03
11.09
11.15
11.27
11.36
11.41
11.59
11.84
11.89
11.61
Table 2.2 DO observation in 2015 (mg/l)
Y/M/D
2015/04/01
2015/04/09
2015/04/15
2015/04/22
2015/04/28
2015/05/07
2015/05/13
2015/05/20
2015/05/27
2015/06/02
2015/06/10
2015/06/17
2015/06/24
2015/07/08
2015/07/15
2015/07/29
2015/08/05
2015/08/20
2015/08/27
2015/09/03
2015/09/08
2015/09/18
2015/09/24
2015/09/30
2015/10/07
2015/10/14
2015/10/21
2015/10/28
2015/11/04
2015/11/11
2015/11/25
2015/12/02
2015/12/09
0.0m
10.91
10.60
10.66
10.59
10.95
10.87
9.96
11.33
12.36
10.69
11.22
10.74
10.18
10.50
9.85
9.38
9.18
9.73
9.43
10.08
7.53
10.24
9.92
7.44
7.47
7.68
8.66
7.92
7.85
8.47
8.33
6.42
5.21
0.5m
10.91
10.58
10.62
10.59
10.96
10.87
9.95
11.68
12.59
10.69
11.51
10.94
10.18
10.69
10.02
9.33
9.19
9.85
9.56
10.25
7.45
10.44
10.10
7.40
7.38
7.62
8.65
7.95
7.94
8.45
8.31
6.34
5.06
1.0m
11.43
10.55
10.60
10.53
11.01
10.74
9.93
11.41
12.67
10.84
11.87
11.20
10.23
9.41
10.60
9.19
9.13
9.83
7.87
10.12
7.43
10.53
9.75
7.40
7.41
7.56
8.62
7.99
7.96
8.49
8.29
6.25
5.00
1.5m
11.76
10.53
10.60
10.30
10.86
9.95
9.75
9.30
13.07
12.12
7.44
7.47
9.71
8.13
9.02
12.68
9.39
9.65
7.20
7.05
7.43
10.32
9.00
7.39
7.43
7.54
8.59
7.98
7.96
8.49
8.29
6.23
4.98
2.0m
12.14
10.51
10.53
9.21
8.72
7.68
8.69
7.36
5.95
10.64
5.08
3.09
3.59
6.26
4.19
6.07
10.62
9.12
6.44
5.12
7.43
9.74
7.90
7.33
7.45
7.53
8.48
7.94
7.97
8.51
8.25
6.21
4.97
2.5m
12.42
10.52
10.13
8.87
8.16
6.86
6.16
4.95
3.00
3.57
2.01
0.54
0.70
1.80
1.20
3.09
5.32
8.74
6.12
4.23
7.37
9.08
6.48
7.21
7.38
7.49
8.39
7.98
7.97
8.51
8.23
6.20
4.95
3.0m
12.14
10.96
10.09
9.10
8.46
7.49
6.46
5.56
4.86
3.71
1.35
0.56
0.53
0.57
0.70
1.53
2.95
3.76
5.95
2.90
7.13
6.70
4.06
1.32
7.29
7.46
8.12
8.03
7.97
8.13
8.23
6.22
4.90
3.5m
11.25
10.91
10.32
9.54
9.09
8.07
7.23
6.50
5.45
4.11
2.93
2.29
1.76
0.62
0.66
0.96
1.80
0.66
3.82
0.48
1.53
3.85
0.77
0.56
7.36
7.45
6.17
8.03
7.96
7.63
8.22
6.22
4.88
6
4.0m
10.77
10.42
9.91
9.35
8.81
8.01
7.32
6.23
5.64
4.56
3.73
3.42
2.31
0.95
0.71
0.63
0.82
0.39
2.71
0.45
0.48
0.78
0.48
0.47
1.14
7.36
3.51
7.98
7.93
7.23
8.21
6.20
4.88
4.5m
9.96
10.10
9.52
9.11
8.53
7.45
6.72
6.14
5.85
4.84
4.06
3.84
2.49
1.58
0.94
0.56
0.64
0.37
0.31
0.37
0.43
0.57
0.46
0.45
0.53
0.60
0.63
4.42
7.91
6.80
8.18
6.17
4.87
5.0m
9.51
8.97
7.95
8.46
7.77
6.26
6.77
5.28
5.55
4.50
3.02
3.22
2.16
1.05
0.52
0.52
0.57
0.35
0.00
0.35
0.42
0.43
0.43
0.43
0.47
0.46
0.54
0.54
1.62
5.17
8.17
6.18
4.84
5.5m
8.86
8.58
7.55
7.23
6.60
5.01
4.02
3.64
3.79
3.10
1.70
1.65
0.53
0.56
0.43
0.50
0.53
0.35
0.00
0.34
0.41
0.43
0.41
0.39
0.42
0.43
0.45
0.49
0.75
0.47
1.03
6.18
4.84
6.0m
7.89
6.94
5.85
5.56
5.04
4.00
2.80
2.56
2.61
2.06
0.89
0.51
0.41
0.47
0.40
0.48
0.50
0.34
0.00
0.34
0.39
0.43
0.40
0.37
0.39
0.39
0.44
0.47
0.60
0.40
0.59
6.14
4.83
6.5m
6.89
6.26
5.54
4.29
3.63
3.29
2.74
2.15
1.78
1.47
0.78
0.43
0.39
0.42
0.40
0.46
0.47
0.35
0.00
0.35
0.35
0.41
0.38
0.37
0.38
0.37
0.41
0.44
0.53
0.34
0.54
6.12
4.84
7.0m
6.07
5.15
4.88
4.29
3.20
2.33
1.82
1.99
1.53
1.28
0.67
0.39
0.37
0.41
0.40
0.44
0.39
0.35
0.00
0.38
0.34
0.41
0.38
0.37
0.36
0.36
0.39
0.40
0.50
0.31
0.48
5.45
4.86
7.5m
5.19
4.12
4.17
3.21
2.93
1.88
1.68
1.52
1.59
1.26
0.64
0.38
0.36
0.39
0.41
0.43
0.37
0.39
0.00
0.45
0.33
0.39
0.35
0.35
0.34
0.36
0.36
0.39
0.45
0.30
0.46
0.44
4.87
8.0m
3.95
3.16
2.72
2.46
3.10
1.55
0.00
0.86
0.47
0.45
0.34
0.00
0.33
0.36
0.00
0.39
0.35
0.36
0.00
0.34
0.33
0.35
0.34
0.35
0.34
0.35
0.36
0.37
0.44
0.27
0.46
0.36
4.78
Table 2.3 pH observation in 2015
Y/M/D
2015/04/01
2015/04/09
2015/04/15
2015/04/22
2015/04/28
2015/05/07
2015/05/13
2015/05/20
2015/05/27
2015/06/02
2015/06/10
2015/06/17
2015/06/24
2015/07/08
2015/07/15
2015/07/29
2015/08/05
2015/08/20
2015/08/27
2015/09/03
2015/09/08
2015/09/18
2015/09/24
2015/09/30
2015/10/07
2015/10/14
2015/10/21
2015/10/28
2015/11/04
2015/11/11
2015/11/25
2015/12/02
2015/12/09
0.0m
7.95
7.54
7.56
7.74
8.53
8.83
8.41
8.80
9.35
9.28
8.73
8.98
8.89
8.85
8.72
8.85
8.85
8.94
8.27
8.78
7.73
8.79
9.06
7.72
7.35
7.39
7.42
7.57
7.42
7.29
7.20
7.02
6.08
0.5m
7.95
7.57
7.59
7.73
8.56
8.85
8.45
8.88
9.34
9.28
8.77
9.00
8.90
8.90
8.74
8.83
8.85
8.96
8.28
8.83
7.72
8.80
9.07
7.74
7.40
7.31
7.46
7.56
7.44
7.32
7.21
7.00
6.18
1.0m
7.99
7.58
7.61
7.72
8.42
8.82
8.45
8.63
9.30
9.30
8.79
8.99
8.89
8.46
8.76
8.81
8.84
8.96
7.76
8.80
7.70
8.78
8.66
7.75
7.39
7.27
7.50
7.51
7.46
7.32
7.22
6.99
6.31
1.5m
7.89
7.59
7.62
7.68
8.14
8.05
8.35
8.01
9.02
9.22
7.72
7.96
8.76
7.88
8.16
9.15
8.84
8.93
7.57
8.13
7.66
8.68
8.42
7.76
7.38
7.28
7.53
7.52
7.47
7.33
7.23
6.98
6.39
2.0m
7.85
7.59
7.62
7.42
7.44
7.42
7.85
7.57
7.57
8.51
7.25
7.19
7.20
7.49
7.17
7.91
8.70
8.80
7.40
7.27
7.64
8.60
8.10
7.75
7.38
7.29
7.54
7.52
7.48
7.35
7.25
6.97
6.46
2.5m
7.75
7.58
7.52
7.24
7.30
7.21
7.21
7.19
7.15
7.21
6.90
6.79
6.76
7.00
6.74
7.51
7.75
8.49
7.28
7.00
7.61
8.43
7.82
7.73
7.37
7.30
7.55
7.51
7.49
7.36
7.27
6.97
6.54
3.0m
7.64
7.45
7.38
7.21
7.17
7.15
7.11
7.08
7.00
7.05
6.69
6.63
6.62
6.70
6.55
7.19
7.23
7.72
7.21
6.87
7.57
7.91
7.47
6.92
7.37
7.32
7.55
7.49
7.50
7.32
7.29
6.98
6.61
3.5m
7.45
7.32
7.29
7.19
7.13
7.12
7.08
7.01
6.92
6.99
6.61
6.61
6.53
6.59
6.38
6.94
6.89
7.07
6.95
7.23
6.84
7.52
7.11
6.70
7.37
7.32
7.32
7.49
7.50
7.29
7.30
6.98
6.67
7
4.0m
7.37
7.22
7.22
7.16
7.09
7.09
7.05
6.98
6.92
6.95
6.61
6.62
6.55
6.52
6.30
6.64
6.64
7.05
7.10
7.09
6.65
6.95
6.92
6.64
6.74
7.32
7.05
7.49
7.49
7.27
7.31
6.99
6.71
4.5m
7.28
7.18
7.16
7.13
7.06
7.06
6.99
6.95
6.86
6.90
6.61
6.63
6.57
6.52
6.29
6.52
6.49
7.04
7.04
7.07
6.55
6.67
6.90
6.61
6.67
6.74
6.81
7.42
7.50
7.20
7.32
7.00
6.75
5.0m
7.20
7.09
7.06
7.08
7.01
7.02
6.99
6.91
6.84
6.85
6.61
6.65
6.58
6.51
6.32
6.46
6.40
7.01
7.01
7.01
6.60
6.80
6.55
6.57
6.62
6.66
6.77
6.75
7.25
6.99
7.33
7.00
6.77
5.5m
7.15
7.07
7.03
7.01
6.95
6.98
6.90
7.30
6.84
6.78
6.60
6.65
6.59
6.53
6.40
6.46
6.35
6.96
6.98
6.94
6.49
6.47
6.47
6.60
6.55
6.64
6.72
6.65
7.12
6.79
6.84
7.01
6.79
6.0m
7.07
6.98
6.95
6.94
6.88
6.95
6.87
7.17
6.83
6.74
6.62
6.66
6.61
6.53
6.55
6.46
6.36
6.90
6.92
6.88
6.52
6.49
6.48
6.54
6.61
6.53
6.61
6.55
7.00
6.59
6.57
7.01
6.80
6.5m
7.01
6.96
6.94
6.91
6.85
6.95
6.87
7.10
6.83
6.73
6.63
6.67
6.63
6.53
6.58
6.55
6.49
6.82
6.86
6.79
6.72
6.52
6.46
6.50
6.50
6.49
6.28
6.27
6.74
6.22
6.29
7.01
6.82
7.0m
6.97
6.93
6.93
6.92
6.84
6.93
6.86
7.06
6.84
6.73
6.65
6.69
6.69
6.55
6.64
6.65
6.83
6.80
6.79
6.70
6.66
6.51
6.42
6.45
6.49
6.45
6.30
6.35
6.56
6.26
6.17
6.69
6.83
7.5m
6.95
6.94
6.94
6.92
6.85
6.92
6.86
7.02
6.85
6.75
6.68
6.71
6.71
6.60
6.68
6.55
6.59
6.50
6.59
6.55
6.51
6.33
6.32
6.34
6.45
6.35
6.31
6.32
6.47
6.30
6.15
6.15
6.84
8.0m
6.93
6.93
6.92
6.96
6.88
6.88
6.89
6.82
6.64
6.56
6.72
6.70
6.63
6.60
6.59
6.57
6.54
6.45
6.48
6.41
6.46
6.49
6.48
6.34
6.44
6.33
6.35
6.37
6.46
6.39
6.14
6.43
6.95
Table 2.4 ORP observation in 2015 (mV)
Y/M/D
2015/04/01
2015/04/09
2015/04/15
2015/04/22
2015/04/28
2015/05/07
2015/05/13
2015/05/20
2015/05/27
2015/06/02
2015/06/10
2015/06/17
2015/06/24
2015/07/08
2015/07/15
2015/07/29
2015/08/05
2015/08/20
2015/08/27
2015/09/03
2015/09/08
2015/09/18
2015/09/24
2015/09/30
2015/10/07
2015/10/14
2015/10/21
2015/10/28
2015/11/04
2015/11/11
2015/11/25
2015/12/02
2015/12/09
0.0m
253.3
225.0
208.0
218.0
189.0
207.0
234.0
233.0
202.0
191.0
235.0
209.0
207.0
214.0
306.0
241.0
333.0
259.0
188.0
165.0
197.0
167.0
216.0
206.0
223.0
258.0
279.0
225.0
203.0
209.0
332.0
291.0
307.0
0.5m
256.2
226.0
208.0
221.0
190.0
207.0
238.0
233.0
206.0
195.0
240.0
214.0
211.0
217.0
316.0
256.0
339.0
268.0
225.0
168.0
199.0
182.0
219.0
210.0
224.0
269.0
278.0
228.0
201.0
209.0
334.0
294.0
326.0
1.0m
256.6
227.0
208.0
226.0
201.0
209.0
240.0
245.0
211.0
198.0
247.0
219.0
216.0
231.0
322.0
263.0
346.0
280.0
252.0
175.0
201.0
196.0
244.0
215.0
230.0
274.0
276.0
236.0
205.0
211.0
335.0
296.0
337.0
1.5m
265.2
228.0
208.0
229.0
211.0
234.0
245.0
264.0
225.0
206.0
272.0
251.0
229.0
252.0
355.0
263.0
350.0
289.0
265.0
208.0
206.0
209.0
255.0
218.0
234.0
275.0
275.0
237.0
210.0
212.0
336.0
298.0
339.0
2.0m
270.0
230.0
211.0
239.0
238.0
256.0
259.0
278.0
284.0
234.0
287.0
280.0
279.0
267.0
391.0
313.0
368.0
302.0
276.0
252.0
210.0
226.0
266.0
222.0
237.0
277.0
274.0
239.0
214.0
213.0
337.0
299.0
342.0
2.5m
275.6
234.0
216.0
247.0
244.0
266.0
282.0
291.0
297.0
278.0
301.0
291.0
297.0
284.0
408.0
333.0
406.0
318.0
286.0
268.0
214.0
241.0
278.0
227.0
241.0
278.0
274.0
242.0
217.0
214.0
338.0
302.0
344.0
3.0m
280.4
243.0
225.0
249.0
253.0
271.0
287.0
298.0
309.0
286.0
311.0
301.0
305.0
281.0
416.0
350.0
427.0
355.0
293.0
277.0
219.0
269.0
288.0
265.0
245.0
279.0
275.0
247.0
218.0
220.0
338.0
303.0
346.0
3.5m
287.9
251.0
232.0
252.0
259.0
275.0
291.0
305.0
314.0
289.0
323.0
311.0
317.0
291.0
425.0
366.0
442.0
-23.0
310.0
-49.0
205.0
283.0
282.0
265.0
248.0
281.0
285.0
249.0
219.0
223.0
339.0
304.0
346.0
4.0m
291.1
255.0
237.0
255.0
266.0
279.0
294.0
308.0
315.0
292.0
328.0
317.0
322.0
300.0
430.0
384.0
452.0
-63.0
297.0
-121.0
0.0
-111.0
-83.0
259.0
272.0
282.0
296.0
251.0
218.0
225.0
340.0
305.0
347.0
8
4.5m
294.1
256.0
240.0
258.0
269.0
282.0
298.0
311.0
319.0
297.0
331.0
320.0
326.0
304.0
434.0
393.0
460.0
-70.0
-146.0
-130.0
-46.0
-125.0
-105.0
267.0
273.0
310.0
279.0
256.0
218.0
230.0
340.0
306.0
347.0
5.0m
296.6
260.0
244.0
261.0
274.0
283.0
300.0
314.0
321.0
301.0
333.0
321.0
327.0
310.0
432.0
399.0
465.0
-88.0
-153.0
-156.0
-48.0
-125.0
-100.0
267.0
269.0
226.0
275.0
152.0
230.0
241.0
341.0
307.0
346.0
5.5m
297.9
260.0
245.0
264.0
276.0
283.0
302.0
267.0
319.0
305.0
333.0
320.0
327.0
310.0
420.0
401.0
469.0
-124.0
-157.0
-159.0
-55.0
-122.0
-121.0
91.0
104.0
170.0
211.0
145.0
-26.0
179.0
308.0
308.0
346.0
6.0m
299.6
262.0
247.0
267.0
278.0
283.0
302.0
269.0
316.0
308.0
330.0
317.0
322.0
310.0
333.0
399.0
462.0
-130.0
-158.0
-159.0
-72.0
-128.0
-137.0
-123.0
-136.0
-99.0
111.0
119.0
-58.0
97.0
-32.0
309.0
346.0
6.5m
300.1
263.0
247.0
268.0
267.0
281.0
302.0
271.0
313.0
308.0
329.0
310.0
309.0
305.0
263.0
346.0
405.0
-131.0
-160.0
-158.0
-138.0
-135.0
-153.0
-152.0
-156.0
-167.0
-146.0
-123.0
-145.0
-146.0
-117.0
300.0
345.0
7.0m
299.6
263.0
247.0
268.0
248.0
279.0
300.0
272.0
311.0
307.0
326.0
302.0
269.0
298.0
210.0
237.0
121.0
-134.0
-164.0
-167.0
-169.0
-156.0
-168.0
-173.0
-184.0
-178.0
-165.0
-141.0
-164.0
-168.0
-142.0
120.0
345.0
7.5m
298.6
262.0
247.0
266.0
223.0
277.0
298.0
272.0
310.0
306.0
324.0
281.0
235.0
287.0
-32.0
-61.0
-101.0
-151.0
-166.0
-172.0
-182.0
-164.0
-174.0
-173.0
-190.0
-174.0
-176.0
-143.0
-168.0
-179.0
-146.0
-118.0
345.0
8.0m
296.3
262.0
246.0
220.0
183.0
57.0
-25.0
-69.0
-144.0
-147.0
-171.0
-161.0
-171.0
-174.0
-167.0
-161.0
-133.0
-155.0
-180.0
-174.0
-178.0
-185.0
-186.0
-173.0
-188.0
-172.0
-181.0
-145.0
-168.0
-185.0
-142.0
-172.0
209.0
Table 2.5 EC observation in 2015
Y/M/D
2015/04/01
2015/04/09
2015/04/15
2015/04/22
2015/04/28
2015/05/07
2015/05/13
2015/05/20
2015/05/27
2015/06/02
2015/06/10
2015/06/17
2015/06/24
2015/07/08
2015/07/15
2015/07/29
2015/08/05
2015/08/20
2015/08/27
2015/09/03
2015/09/08
2015/09/18
2015/09/24
2015/09/30
2015/10/07
2015/10/14
2015/10/21
2015/10/28
2015/11/04
2015/11/11
2015/11/25
2015/12/02
2015/12/09
0.0m
0.107
0.095
0.088
0.095
0.103
0.104
0.101
0.103
0.111
0.113
0.097
0.102
0.103
0.095
0.105
0.113
0.120
0.112
0.108
0.110
0.103
0.105
0.109
0.106
0.098
0.098
0.099
0.098
0.098
0.098
0.095
0.100
0.112
0.5m
0.107
0.095
0.088
0.094
0.103
0.103
0.100
0.102
0.109
0.112
0.095
0.101
0.103
0.094
0.103
0.112
0.119
0.112
0.107
0.106
0.103
0.105
0.106
0.106
0.098
0.097
0.099
0.098
0.097
0.098
0.095
0.100
0.111
1.0m
0.104
0.094
0.088
0.094
0.100
0.103
0.100
0.098
0.108
0.111
0.095
0.101
0.102
0.093
0.102
0.111
0.119
0.111
0.103
0.106
0.103
0.105
0.106
0.106
0.098
0.097
0.098
0.098
0.097
0.098
0.095
0.100
0.111
1.5m
0.100
0.094
0.088
0.092
0.096
0.104
0.100
0.096
0.103
0.107
0.092
0.096
0.099
0.092
0.097
0.108
0.119
0.111
0.103
0.106
0.103
0.104
0.104
0.106
0.098
0.097
0.099
0.098
0.097
0.098
0.095
0.100
0.110
2.0m
0.098
0.094
0.088
0.090
0.092
0.096
0.100
0.097
0.099
0.102
0.093
0.094
0.097
0.092
0.096
0.105
0.112
0.108
0.104
0.105
0.103
0.103
0.104
0.106
0.098
0.097
0.099
0.098
0.097
0.098
0.095
0.100
0.110
2.5m
0.095
0.095
0.088
0.089
0.090
0.091
0.095
0.098
0.100
0.101
0.097
0.097
0.099
0.095
0.099
0.100
0.107
0.107
0.110
0.108
0.103
0.103
0.106
0.106
0.098
0.097
0.098
0.098
0.096
0.098
0.095
0.099
0.110
3.0m
0.093
0.095
0.092
0.092
0.093
0.094
0.095
0.096
0.098
0.100
0.103
0.104
0.106
0.109
0.110
0.112
0.115
0.119
0.112
0.109
0.103
0.105
0.106
0.108
0.098
0.097
0.098
0.098
0.096
0.097
0.095
0.099
0.110
3.5m
0.090
0.092
0.094
0.095
0.095
0.096
0.097
0.097
0.099
0.100
0.102
0.104
0.105
0.108
0.109
0.113
0.115
0.120
0.115
0.112
0.108
0.106
0.106
0.107
0.098
0.097
0.098
0.098
0.096
0.097
0.095
0.099
0.110
9
4.0m
0.090
0.091
0.092
0.093
0.093
0.094
0.095
0.096
0.097
0.098
0.099
0.100
0.102
0.105
0.105
0.109
0.111
0.115
0.120
0.123
0.123
0.125
0.125
0.121
0.111
0.097
0.101
0.098
0.096
0.097
0.095
0.099
0.110
4.5m
0.089
0.090
0.091
0.092
0.092
0.093
0.094
0.094
0.095
0.097
0.097
0.098
0.100
0.102
0.103
0.106
0.106
0.110
0.112
0.114
0.117
0.122
0.121
0.122
0.124
0.123
0.120
0.100
0.097
0.097
0.095
0.099
0.110
5.0m
0.089
0.090
0.091
0.091
0.092
0.093
0.093
0.095
0.094
0.096
0.098
0.097
0.099
0.101
0.103
0.104
0.105
0.108
0.110
0.111
0.112
0.115
0.115
0.117
0.119
0.123
0.122
0.124
0.113
0.114
0.095
0.099
0.110
5.5m
0.089
0.090
0.091
0.092
0.093
0.093
0.095
0.096
0.096
0.097
0.100
0.099
0.102
0.102
0.104
0.105
0.106
0.108
0.110
0.111
0.111
0.116
0.115
0.116
0.118
0.120
0.121
0.124
0.126
0.128
0.127
0.099
0.110
6.0m
0.089
0.091
0.092
0.093
0.096
0.095
0.097
0.097
0.098
0.099
0.101
0.102
0.104
0.104
0.106
0.108
0.109
0.111
0.112
0.113
0.113
0.117
0.116
0.119
0.124
0.123
0.125
0.124
0.132
0.133
0.141
0.099
0.110
6.5m
0.090
0.091
0.093
0.094
0.095
0.096
0.097
0.098
0.099
0.101
0.102
0.104
0.105
0.107
0.108
0.109
0.111
0.114
0.115
0.115
0.115
0.117
0.124
0.125
0.135
0.146
0.149
0.159
0.158
0.167
0.167
0.100
0.110
7.0m
0.090
0.092
0.093
0.094
0.097
0.097
0.098
0.099
0.100
0.101
0.102
0.104
0.105
0.107
0.108
0.110
0.112
0.116
0.118
0.125
0.129
0.127
0.138
0.145
0.167
0.168
0.204
0.192
0.195
0.202
0.220
0.114
0.110
7.5m
0.091
0.093
0.093
0.096
0.097
0.099
0.100
0.100
0.099
0.101
0.102
0.104
0.105
0.107
0.117
0.129
0.157
0.161
0.165
0.176
0.194
0.199
0.226
0.213
0.238
0.240
0.281
0.275
0.275
0.300
0.271
0.276
0.110
8.0m
0.092
0.095
0.098
0.099
0.097
0.109
0.102
0.107
0.198
0.221
0.178
0.169
0.228
0.226
0.247
0.243
0.246
0.305
0.257
0.291
0.271
0.262
0.292
0.280
0.286
0.288
0.311
0.336
0.331
0.349
0.329
0.336
0.110
Table 2.6 Transparency observation in 2015
Y/M/D
2015/04/01
2015/04/09
2015/04/15
2015/04/22
2015/04/28
2015/05/07
2015/05/13
2015/05/20
2015/05/27
2015/06/02
2015/06/10
2015/06/17
2015/06/24
2015/07/08
2015/07/15
2015/07/29
2015/08/05
2015/08/20
2015/08/27
2015/09/03
2015/09/08
2015/09/18
2015/09/24
2015/09/30
2015/10/07
2015/10/14
2015/10/21
2015/10/28
2015/11/04
2015/11/11
2015/11/25
2015/12/02
2015/12/09
Lapsed
Days
1
9
15
22
28
37
43
50
57
63
71
78
85
99
106
120
127
142
149
156
161
171
177
183
190
197
204
211
218
225
239
246
253
10
Extinction
Coefficient
0.813
1.748
3.194
1.853
1.589
1.264
1.317
1.901
1.599
1.175
1.737
1.381
0.921
1.433
0.854
1.074
0.798
0.774
1.497
1.363
1.690
1.620
1.047
0.854
0.919
0.905
0.878
0.809
0.818
0.757
0.926
0.952
0.971
Transparency
2.5
0.9
0.5
1.7
1.3
1.5
1.3
1.1
1.9
2.1
0.9
1.4
1.7
1.2
1.8
1.5
1.4
1.5
1.0
1.5
1.4
1.2
1.4
3.5
2.8
3.4
4.1
3.4
4.5
4.5
2.5
2.7
2.7
Table 2.7 Chlorophyll-a in 2015 (µg/l)
Y/M/D
0.0m
1.0m
2.0m
3.0m
4.0m
5.0m
6.0m
7.0m
8.0m
2015/04/01
2.720
3.480
2.920
1.730
1.490
1.310
0.760
0.590
1.100
2015/04/09
2.540
2.530
2.230
1.660
1.670
1.220
1.050
1.180
1.340
2015/04/15
4.520
5.330
4.570
3.520
0.920
3.260
0.880
0.700
0.840
2015/04/22
2.080
2.900
3.110
2.360
1.410
1.130
0.950
1.050
1.270
2015/04/28
3.980
5.560
6.890
5.410
2.790
1.900
1.270
1.230
1.650
2015/05/07
7.260
6.600
7.140
6.020
3.780
1.880
2.010
1.830
1.490
2015/05/13
4.720
3.550
3.970
4.290
1.740
1.000
1.170
1.180
1.300
2015/05/20
9.920
19.910
7.610
3.420
1.850
1.930
1.320
1.200
2.370
2015/05/27
4.150
4.180
11.640
12.960
7.250
3.250
1.540
0.840
1.250
2015/06/02
1.660
1.560
3.370
13.490
12.170
6.600
5.680
2.370
3.240
2015/06/10
6.910
17.790
10.650
6.720
2.860
1.740
1.420
1.030
1.300
2015/06/17
8.315
9.888
13.095
7.878
3.709
2.155
1.451
1.663
2.560
2015/06/24
3.580
3.340
5.820
4.550
3.165
3.470
1.260
0.810
1.430
2015/07/01
|
|
|
|
|
|
|
|
|
2015/07/08
27.390
28.430
23.560
15.920
5.910
4.690
3.180
2.920
2.700
2015/07/15
5.060
7.074
11.040
14.130
8.200
4.270
3.270
1.600
3.500
2015/07/21
|
|
|
|
|
|
|
|
|
2015/07/29
13.240
11.770
20.200
19.150
22.490
15.660
11.930
5.740
5.930
2015/08/05
8.620
8.420
9.390
13.690
15.090
16.910
10.150
8.850
14.500
2015/08/12
|
|
|
|
|
|
|
|
|
2015/08/20
5.560
3.920
3.740
10.990
11.800
11.060
6.920
2.690
4.400
2015/08/28
11.580
19.600
13.000
9.000
9.050
11.660
13.560
8.550
8.950
2015/09/03
16.930
21.640
7.388
3.260
7.580
10.280
6.970
6.940
4.230
2015/09/08
12.860
17.090
15.630
17.890
12.670
10.990
12.050
10.400
7.830
2015/09/18
35.110
36.430
35.800
25.580
16.020
17.500
20.290
17.420
15.870
2015/09/24
11.850
17.350
15.000
6.220
4.550
16.190
18.330
16.120
6.000
2015/09/30
4.000
2.840
4.560
2.330
4.190
9.300
36.930
19.520
29.600
2015/10/07
3.470
4.460
4.160
4.270
3.490
8.960
34.000
27.580
25.740
2015/10/14
1.690
3.260
2.880
2.420
2.940
69.280
71.600
45.760
31.190
2015/10/21
0.990
1.540
1.390
1.550
1.960
11.010
25.920
57.630
29.560
2015/10/28
1.480
1.550
1.760
1.990
1.960
6.630
46.630
48.180
26.600
2015/11/04
2.950
3.400
3.540
3.190
3.100
3.230
59.930
61.830
66.740
2015/11/11
2.540
3.440
3.160
2.570
2.270
2.020
30.960
38.460
40.760
2015/11/25
2.680
1.848
1.550
1.220
1.450
1.430
8.380
22.383
19.550
2015/12/02
1.220
1.694
2.220
1.876
2.091
2.386
2.123
2.931
19.940
2015/12/09
2.260
1.870
2.560
1.660
1.590
1.610
1.610
1.780
2.280
11
Table 2.8 TOC in 2015 (mg/l)
Y/M/D
0.0m
1.0m
2.0m
3.0m
4.0m
5.0m
6.0m
7.0m
8.0m
2015/04/01
4.900
4.960
4.860
4.360
4.080
4.090
4.000
4.070
4.110
2015/04/09
5.540
5.610
5.540
5.110
4.400
4.150
3.960
4.020
4.130
2015/04/15
6.010
5.850
5.900
5.670
4.210
5.550
4.570
4.570
4.220
2015/04/22
5.650
5.810
5.800
5.450
4.490
4.150
4.300
4.430
4.390
2015/04/28
5.670
5.900
5.880
5.400
4.770
4.430
4.450
4.540
4.510
2015/05/07
5.470
5.440
5.540
5.390
4.610
4.180
4.150
4.180
4.130
2015/05/13
5.040
5.180
5.170
4.980
4.200
3.990
4.110
4.150
4.190
2015/05/20
5.840
6.040
5.630
5.570
4.340
4.070
4.000
4.050
4.130
2015/05/27
5.550
5.390
5.900
5.700
4.770
4.170
3.870
3.810
3.840
2015/06/02
5.060
5.120
5.240
6.420
4.970
4.430
4.110
4.000
4.140
2015/06/10
5.920
6.080
5.720
5.120
4.580
4.390
4.060
3.920
3.920
2015/06/17
5.760
5.970
5.760
5.220
4.450
4.040
3.900
3.940
3.930
2015/06/24
5.530
5.390
5.460
5.140
4.340
4.150
3.940
3.970
4.240
2015/07/01
|
|
|
|
|
|
|
|
|
2015/07/08
6.000
6.130
6.190
5.150
3.960
4.030
4.190
4.120
3.920
2015/07/15
5.480
5.550
5.850
5.380
4.240
4.130
4.020
4.040
4.250
2015/07/21
|
|
|
|
|
|
|
|
|
2015/07/29
5.850
5.800
6.020
5.680
4.720
4.150
4.310
4.020
4.170
2015/08/05
5.750
5.730
5.825
4.930
4.710
4.385
4.275
4.155
5.545
2015/08/12
|
|
|
|
|
|
|
|
|
2015/08/20
5.440
5.600
5.450
5.380
5.050
4.730
4.280
4.420
5.200
2015/08/28
5.810
5.930
5.870
5.710
5.530
4.440
4.290
4.360
5.130
2015/09/03
6.610
6.730
6.540
5.900
5.640
4.620
4.380
4.440
4.910
2015/09/08
6.400
6.430
6.370
6.360
4.760
4.700
4.450
4.430
5.530
2015/09/18
6.810
6.820
6.700
6.160
5.560
4.490
4.400
4.360
5.930
2015/09/24
6.290
6.330
6.260
5.650
5.430
4.690
4.480
4.430
6.020
2015/09/30
5.850
5.760
5.510
5.670
5.300
4.420
4.460
4.670
5.090
2015/10/07
5.500
5.420
5.420
5.450
5.020
4.720
4.620
4.800
5.440
2015/10/14
5.290
5.370
5.330
5.360
5.170
4.630
4.750
4.530
6.110
2015/10/21
6.190
5.190
5.210
5.200
5.100
4.710
4.700
4.660
5.540
2015/10/28
5.040
5.100
5.070
5.180
5.040
4.650
4.570
4.740
6.560
2015/11/04
4.860
4.990
4.840
4.800
4.880
4.840
4.800
4.700
5.370
2015/11/11
4.840
4.980
4.860
4.750
4.760
4.690
4.340
4.610
5.678
2015/11/25
4.750
4.800
4.930
4.780
4.790
4.790
4.410
4.700
5.305
2015/12/02
4.610
4.790
4.750
4.620
4.730
4.590
4.580
4.660
5.490
2015/12/09
4.640
4.730
4.680
4.700
4.610
4.650
4.550
4.590
4.690
12
Table 2.9 DOC in 2015 (mg/l)
Y/M/D
0.0m
1.0m
2.0m
3.0m
4.0m
5.0m
6.0m
7.0m
8.0m
2015/04/01
4.320
4.420
4.260
4.020
3.890
3.880
3.880
3.860
3.990
2015/04/09
5.200
5.160
5.170
4.910
4.310
4.050
3.900
3.910
3.990
2015/04/15
5.700
5.440
5.400
5.250
3.990
4.720
3.910
3.950
4.000
2015/04/22
5.320
5.340
5.360
5.090
4.110
3.940
3.860
3.850
3.910
2015/04/28
5.240
5.270
5.220
5.020
4.290
4.110
3.860
3.910
3.970
2015/05/07
4.860
4.750
4.840
4.800
4.250
3.950
3.910
3.880
3.950
2015/05/13
4.680
4.740
4.830
4.710
4.010
3.890
3.790
3.830
3.820
2015/05/20
5.070
5.090
5.060
4.790
4.140
3.950
3.900
3.790
3.890
2015/05/27
5.270
5.000
4.970
4.720
4.280
3.960
3.770
3.730
3.700
2015/06/02
4.890
4.980
5.060
5.330
4.360
4.040
3.950
3.840
3.920
2015/06/10
5.410
5.290
5.090
4.750
4.450
4.140
3.780
3.770
3.860
2015/06/17
5.110
5.240
5.120
4.690
4.160
3.850
3.780
3.810
3.730
2015/06/24
4.860
4.870
4.830
4.620
4.090
3.920
3.830
3.790
3.880
2015/07/01
|
|
|
|
|
|
|
|
|
2015/07/08
5.100
5.150
5.490
4.660
3.850
3.870
3.790
3.780
3.850
2015/07/15
5.040
5.180
5.330
4.910
4.050
3.960
3.900
3.880
3.990
2015/07/21
|
|
|
|
|
|
|
|
|
2015/07/29
4.940
5.010
4.980
4.700
3.990
3.680
3.700
3.780
4.010
2015/08/05
4.780
4.830
4.880
4.180
4.000
3.810
3.750
3.780
4.680
2015/08/12
|
|
|
|
|
|
|
|
|
2015/08/20
4.700
4.780
4.770
4.580
4.360
3.990
3.850
4.030
4.620
2015/08/28
5.410
5.380
5.360
5.370
5.160
4.110
3.790
4.320
4.920
2015/09/03
5.660
5.810
6.050
5.480
5.290
4.200
4.060
4.150
4.570
2015/09/08
5.430
5.560
5.590
5.610
4.410
4.330
4.100
4.070
5.100
2015/09/18
5.460
5.520
5.690
5.320
5.140
4.140
4.040
4.040
4.950
2015/09/24
5.820
5.810
5.820
5.430
5.270
4.370
4.060
3.970
5.500
2015/09/30
5.550
5.310
5.320
5.250
4.890
4.040
3.870
4.180
4.500
2015/10/07
5.080
5.150
5.170
5.160
4.850
4.490
4.090
4.120
4.810
2015/10/14
5.060
4.990
5.010
5.080
5.050
4.010
4.010
4.130
5.430
2015/10/21
5.760
4.930
5.010
4.990
4.890
4.480
4.260
4.100
4.550
2015/10/28
4.790
4.840
4.870
4.910
4.900
4.410
4.240
4.300
6.150
2015/11/04
4.640
4.620
4.630
4.640
4.660
4.610
4.050
4.180
4.750
2015/11/11
4.480
4.520
4.540
4.560
4.560
4.530
3.960
4.120
5.158
2015/11/25
4.560
4.630
4.670
4.640
4.700
4.620
4.310
4.280
4.780
2015/12/02
4.300
4.360
4.420
4.430
4.460
4.450
4.430
4.500
4.880
2015/12/09
4.490
4.580
4.560
4.560
4.550
4.590
4.530
4.550
4.560
13
Table 2.10 TN in 2015 (mg/l)
Y/M/D
0.0m
1.0m
2.0m
3.0m
4.0m
5.0m
6.0m
7.0m
8.0m
2015/04/01
1.291
1.304
1.114
0.978
0.815
0.646
0.671
0.816
1.225
2015/04/09
1.005
0.774
0.753
0.840
0.674
0.734
0.684
0.676
1.013
2015/04/15
1.134
0.876
1.006
0.865
0.968
1.214
1.040
0.901
0.805
2015/04/22
0.635
0.934
1.038
0.894
0.726
0.699
0.847
0.649
0.926
2015/04/28
0.932
1.040
0.868
0.906
0.786
0.872
0.754
0.711
1.158
2015/05/07
0.895
0.561
0.538
0.575
0.478
0.843
0.942
1.157
1.273
2015/05/13
0.667
0.507
0.792
0.819
0.823
0.772
0.832
0.758
0.799
2015/05/20
0.563
0.850
0.460
0.647
0.654
0.560
0.671
0.620
0.754
2015/05/27
0.625
0.521
0.638
0.712
0.904
0.749
0.621
0.648
0.817
2015/06/02
0.583
0.467
0.635
0.910
0.884
0.928
0.768
0.981
0.989
2015/06/10
0.593
0.725
0.571
0.387
0.574
0.704
0.698
0.713
0.983
2015/06/17
0.530
0.694
0.793
0.565
0.645
0.591
0.767
0.809
1.015
2015/06/24
0.458
0.384
0.405
0.436
0.648
0.591
0.660
0.623
0.744
2015/07/01
|
|
|
|
|
|
|
|
|
2015/07/08
0.761
0.852
0.708
0.608
0.455
0.544
0.719
0.523
0.643
2015/07/15
0.615
0.632
0.695
0.807
0.732
0.818
0.708
0.807
0.967
2015/07/21
|
|
|
|
|
|
|
|
|
2015/07/29
0.555
0.483
0.626
0.554
0.693
0.557
0.620
0.479
0.828
2015/08/05
0.563
0.583
0.669
0.658
0.760
0.893
0.639
0.462
0.818
2015/08/12
|
|
|
|
|
|
|
|
|
2015/08/20
0.619
0.758
0.468
0.672
0.774
0.627
0.459
0.901
1.650
2015/08/28
0.520
0.611
0.560
0.482
0.598
0.505
0.517
0.596
1.511
2015/09/03
0.780
0.858
0.804
0.554
0.573
0.550
0.504
0.748
1.394
2015/09/08
0.498
0.747
0.615
0.737
0.601
0.593
0.605
0.915
2.117
2015/09/18
1.126
0.907
0.911
0.785
0.677
0.429
0.546
0.980
1.906
2015/09/24
0.773
0.777
0.700
0.749
0.667
0.614
0.808
0.959
1.990
2015/09/30
0.698
0.593
0.643
0.687
0.586
0.599
0.843
1.498
1.992
2015/10/07
0.731
0.623
0.593
0.614
0.731
0.674
0.896
1.388
2.193
2015/10/14
0.510
0.452
0.471
0.425
0.458
0.709
0.734
1.270
2.288
2015/10/21
0.984
0.548
0.561
0.588
0.414
0.754
0.744
1.418
2.131
2015/10/28
0.567
0.645
0.587
0.605
0.661
0.452
0.970
1.332
3.363
2015/11/04
0.577
0.507
0.544
0.627
0.529
0.683
1.066
1.386
2.522
2015/11/11
0.610
0.747
0.528
0.412
0.491
0.497
0.733
1.372
2.669
2015/11/25
0.902
0.757
1.093
0.835
0.818
0.827
0.880
1.700
3.005
2015/12/02
0.727
0.622
0.724
0.665
0.744
0.712
0.617
0.732
2.576
2015/12/09
0.883
0.951
0.842
0.799
0.962
0.953
0.837
0.831
0.896
14
Table 2.11 TP in 2015 (mg/l)
Y/M/D
0.0m
1.0m
2.0m
3.0m
4.0m
5.0m
6.0m
7.0m
8.0m
2015/04/01
0.020
0.020
0.029
0.025
0.022
0.030
0.029
0.041
0.051
2015/04/09
0.034
0.029
0.031
0.029
0.026
0.030
0.035
0.046
0.059
2015/04/15
0.055
0.051
0.050
0.059
0.043
0.051
0.044
0.050
0.056
2015/04/22
0.038
0.041
0.039
0.046
0.033
0.030
0.042
0.047
0.052
2015/04/28
0.030
0.037
0.037
0.041
0.030
0.033
0.049
0.050
0.061
2015/05/07
0.027
0.026
0.026
0.025
0.026
0.030
0.038
0.045
0.051
2015/05/13
0.020
0.022
0.023
0.027
0.022
0.027
0.047
0.047
0.050
2015/05/20
0.033
0.047
0.042
0.036
0.027
0.033
0.037
0.050
0.049
2015/05/27
0.025
0.024
0.033
0.033
0.029
0.022
0.038
0.050
0.051
2015/06/02
0.020
0.018
0.022
0.032
0.031
0.019
0.023
0.039
0.035
2015/06/10
0.038
0.057
0.052
0.039
0.029
0.025
0.021
0.030
0.036
2015/06/17
0.023
0.032
0.027
0.027
0.022
0.016
0.020
0.025
0.042
2015/06/24
0.027
0.022
0.021
0.026
0.024
0.016
0.029
0.030
0.043
2015/07/01
|
|
|
|
|
|
|
|
|
2015/07/08
0.044
0.060
0.050
0.039
0.016
0.012
0.016
0.026
0.035
2015/07/15
0.027
0.031
0.031
0.035
0.016
0.021
0.017
0.026
0.034
2015/07/21
|
|
|
|
|
|
|
|
|
2015/07/29
0.029
0.030
0.035
0.036
0.036
0.021
0.024
0.028
0.036
2015/08/05
0.021
0.026
0.026
0.022
0.034
0.030
0.025
0.022
0.033
2015/08/12
|
|
|
|
|
|
|
|
|
2015/08/20
0.022
0.018
0.021
0.025
0.024
0.024
0.013
0.023
0.050
2015/08/28
0.043
0.059
0.049
0.041
0.046
0.027
0.035
0.031
0.077
2015/09/03
0.039
0.048
0.034
0.029
0.037
0.033
0.030
0.029
0.054
2015/09/08
0.033
0.039
0.038
0.034
0.035
0.035
0.022
0.034
0.130
2015/09/18
0.029
0.023
0.021
0.022
0.017
0.021
0.033
0.031
0.149
2015/09/24
0.025
0.042
0.033
0.035
0.022
0.018
0.029
0.041
0.129
2015/09/30
0.016
0.016
0.014
0.012
0.013
0.021
0.026
0.061
0.138
2015/10/07
0.015
0.019
0.014
0.020
0.022
0.018
0.036
0.076
0.160
2015/10/14
0.017
0.018
0.018
0.013
0.015
0.048
0.044
0.068
0.174
2015/10/21
0.016
0.014
0.017
0.011
0.013
0.017
0.035
0.113
0.197
2015/10/28
0.013
0.012
0.014
0.014
0.017
0.012
0.033
0.078
0.254
2015/11/04
0.012
0.012
0.011
0.013
0.011
0.012
0.040
0.085
0.213
2015/11/11
0.012
0.014
0.010
0.011
0.010
0.009
0.033
0.081
0.234
2015/11/25
0.020
0.017
0.025
0.023
0.017
0.020
0.030
0.117
0.255
2015/12/02
0.021
0.022
0.026
0.026
0.026
0.022
0.024
0.038
0.232
2015/12/09
0.047
0.050
0.054
0.049
0.050
0.045
0.044
0.054
0.050
15
Table 2.12 NH4-N in 2015 (mg/l)
Y/M/D
0.0m
1.0m
2.0m
3.0m
4.0m
5.0m
6.0m
7.0m
8.0m
2015/04/01
0.210
0.197
0.145
0.140
0.143
0.137
0.147
0.150
0.133
2015/04/09
0.313
0.273
0.270
0.260
0.197
0.167
0.150
0.160
0.170
2015/04/15
0.360
0.247
0.240
0.233
0.160
0.180
0.133
0.147
0.167
2015/04/22
0.257
0.233
0.240
0.257
0.197
0.157
0.167
0.180
0.203
2015/04/28
0.260
0.207
0.240
0.240
0.200
0.183
0.150
0.163
0.197
2015/05/07
0.283
0.213
0.230
0.193
0.180
0.167
0.167
0.160
0.170
2015/05/13
0.233
0.256
0.257
0.252
0.173
0.170
0.205
0.193
0.217
2015/05/20
0.246
0.200
0.200
0.200
0.163
0.153
0.156
0.183
0.180
2015/05/27
0.283
0.260
0.253
0.230
0.200
0.153
0.133
0.172
0.170
2015/06/02
0.203
0.197
0.220
0.317
0.203
0.177
0.167
0.197
0.203
2015/06/10
0.287
0.280
0.287
0.247
0.257
0.237
0.203
0.240
0.260
2015/06/17
0.247
0.290
0.260
0.237
0.213
0.197
0.217
0.237
0.300
2015/06/24
0.213
0.207
0.213
0.233
0.177
0.173
0.190
0.253
0.290
2015/07/01
|
|
|
|
|
|
|
|
|
2015/07/08
0.237
0.250
0.260
0.210
0.153
0.163
0.210
0.283
0.300
2015/07/15
0.243
0.233
0.260
0.250
0.163
0.180
0.230
0.386
0.506
2015/07/21
|
|
|
|
|
|
|
|
|
2015/07/29
0.223
0.210
0.220
0.193
0.150
0.150
0.233
0.383
0.717
2015/08/05
0.203
0.200
0.197
0.160
0.150
0.150
0.247
0.327
0.237
2015/08/12
|
|
|
|
|
|
|
|
|
2015/08/20
0.173
0.180
0.170
0.170
0.150
0.147
0.257
0.760
1.320
2015/08/28
0.257
0.213
0.220
0.233
0.237
0.233
0.287
0.573
1.374
2015/09/03
0.290
0.327
0.440
0.377
0.380
0.293
0.434
0.720
1.377
2015/09/08
0.303
0.331
0.317
0.310
0.310
0.323
0.452
0.892
2.072
2015/09/18
0.243
0.253
0.253
0.326
0.366
0.380
0.496
0.850
1.867
2015/09/24
0.297
0.257
0.273
0.313
0.367
0.374
0.526
0.908
1.866
2015/09/30
0.350
0.330
0.323
0.333
0.390
0.326
0.366
1.200
1.580
2015/10/07
0.373
0.310
0.320
0.323
0.350
0.317
0.315
1.130
1.815
2015/10/14
0.387
0.320
0.317
0.313
0.317
0.354
0.466
1.135
2.158
2015/10/21
0.347
0.267
0.280
0.293
0.293
0.326
0.434
1.065
1.835
2015/10/28
0.287
0.280
0.280
0.310
0.283
0.300
0.460
1.185
2.800
2015/11/04
0.303
0.287
0.287
0.287
0.283
0.300
0.606
1.185
2.150
2015/11/11
0.283
0.263
0.267
0.267
0.293
0.280
0.520
1.100
2.450
2015/11/25
0.250
0.257
0.267
0.270
0.270
0.273
0.227
1.400
2.395
2015/12/02
0.417
0.400
0.393
0.393
0.387
0.393
0.383
0.500
2.230
2015/12/09
0.543
0.543
0.567
0.577
0.573
0.577
0.587
0.567
0.580
16
Table 2.13 NO3-N in 2015 (mg/l)
Y/M/D
0.0m
1.0m
2.0m
3.0m
4.0m
5.0m
6.0m
7.0m
8.0m
2015/04/01
0.245
0.245
0.252
0.271
0.296
0.325
0.343
0.360
0.366
2015/04/09
0.240
0.243
0.242
0.246
0.279
0.309
0.338
0.352
0.341
2015/04/15
0.231
0.232
0.231
0.238
0.311
0.260
0.341
0.344
0.337
2015/04/22
0.210
0.218
0.218
0.242
0.294
0.318
0.350
0.355
0.350
2015/04/28
0.168
0.170
0.187
0.229
0.283
0.316
0.384
0.379
0.368
2015/05/07
0.104
0.102
0.132
0.121
0.279
0.355
0.392
0.397
0.413
2015/05/13
0.097
0.098
0.155
0.169
0.321
0.371
0.413
0.406
0.404
2015/05/20
0.030
0.034
0.061
0.187
0.302
0.366
0.401
0.417
0.412
2015/05/27
0.005
0.007
0.003
0.078
0.235
0.348
0.402
0.415
0.396
2015/06/02
0.004
0.008
0.005
0.024
0.153
0.324
0.382
0.431
0.394
2015/06/10
0.003
0.018
0.025
0.022
0.173
0.261
0.345
0.364
0.363
2015/06/17
0.005
0.007
0.005
0.010
0.168
0.310
0.348
0.336
0.338
2015/06/24
0.002
0.007
0.004
0.002
0.166
0.271
0.323
0.303
0.296
2015/07/01
|
|
|
|
|
|
|
|
|
2015/07/08
0.003
0.012
0.007
0.004
0.181
0.237
0.250
0.195
0.206
2015/07/15
0.002
0.006
0.004
0.003
0.064
0.189
0.197
0.150
0.116
2015/07/21
|
|
|
|
|
|
|
|
|
2015/07/29
0.002
0.002
0.002
0.002
0.011
0.148
0.105
0.029
0.034
2015/08/05
0.002
0.001
0.003
0.002
0.003
0.065
0.050
0.024
0.010
2015/08/12
|
|
|
|
|
|
|
|
|
2015/08/20
0.002
0.002
0.002
0.002
0.003
0.004
0.003
0.003
0.004
2015/08/28
0.012
0.025
0.052
0.067
0.065
0.005
0.012
0.004
0.005
2015/09/03
0.008
0.008
0.042
0.057
0.032
0.014
0.004
0.005
0.003
2015/09/08
0.031
0.030
0.031
0.031
0.007
0.010
0.006
0.004
0.004
2015/09/18
0.004
0.004
0.007
0.007
0.010
0.004
0.003
0.003
0.002
2015/09/24
0.022
0.025
0.034
0.037
0.025
0.009
0.006
0.004
0.002
2015/09/30
0.032
0.029
0.029
0.029
0.016
0.006
0.003
0.004
0.006
2015/10/07
0.069
0.067
0.068
0.066
0.047
0.032
0.015
0.006
0.008
2015/10/14
0.061
0.058
0.059
0.059
0.059
0.010
0.008
0.005
0.010
2015/10/21
0.061
0.056
0.057
0.058
0.055
0.032
0.012
0.009
0.008
2015/10/28
0.055
0.052
0.054
0.051
0.055
0.027
0.016
0.012
0.010
2015/11/04
0.048
0.046
0.046
0.046
0.045
0.043
0.011
0.011
0.008
2015/11/11
0.050
0.050
0.049
0.049
0.048
0.046
0.010
0.009
0.007
2015/11/25
0.082
0.081
0.081
0.078
0.082
0.076
0.038
0.012
0.009
2015/12/02
0.073
0.073
0.075
0.075
0.077
0.074
0.073
0.073
0.030
2015/12/09
0.081
0.081
0.082
0.081
0.082
0.082
0.082
0.083
0.083
17
Table 2.14 PO4-P in 2015 (mg/l)
Y/M/D
0.0m
1.0m
2.0m
3.0m
4.0m
5.0m
6.0m
7.0m
8.0m
2015/04/01
0.009
0.009
0.010
0.009
0.010
0.017
0.023
0.035
0.039
2015/04/09
0.016
0.014
0.017
0.014
0.011
0.015
0.024
0.035
0.037
2015/04/15
0.023
0.022
0.022
0.021
0.022
0.026
0.025
0.035
0.039
2015/04/22
0.014
0.014
0.012
0.020
0.017
0.017
0.026
0.032
0.037
2015/04/28
0.010
0.013
0.014
0.019
0.019
0.021
0.035
0.039
0.041
2015/05/07
0.008
0.007
0.008
0.010
0.011
0.020
0.026
0.033
0.038
2015/05/13
0.003
0.005
0.007
0.011
0.010
0.011
0.032
0.034
0.038
2015/05/20
0.009
0.009
0.011
0.011
0.008
0.017
0.017
0.036
0.034
2015/05/27
0.007
0.008
0.010
0.010
0.010
0.010
0.023
0.039
0.036
2015/06/02
0.010
0.010
0.008
0.010
0.011
0.011
0.015
0.034
0.028
2015/06/10
0.010
0.012
0.014
0.015
0.010
0.010
0.013
0.023
0.022
2015/06/17
0.010
0.010
0.008
0.010
0.016
0.014
0.015
0.020
0.026
2015/06/24
0.008
0.006
0.006
0.010
0.010
0.008
0.014
0.021
0.026
2015/07/01
|
|
|
|
|
|
|
|
|
2015/07/08
0.011
0.017
0.012
0.010
0.011
0.008
0.008
0.013
0.021
2015/07/15
0.007
0.010
0.010
0.007
0.010
0.007
0.012
0.018
0.017
2015/07/21
|
|
|
|
|
|
|
|
|
2015/07/29
0.008
0.007
0.007
0.007
0.008
0.009
0.010
0.015
0.019
2015/08/05
0.008
0.006
0.004
0.004
0.007
0.007
0.006
0.008
0.004
2015/08/12
|
|
|
|
|
|
|
|
|
2015/08/20
0.010
0.009
0.007
0.009
0.007
0.007
0.008
0.015
0.037
2015/08/28
0.013
0.009
0.014
0.015
0.015
0.012
0.014
0.015
0.041
2015/09/03
0.005
0.010
0.011
0.010
0.009
0.007
0.010
0.014
0.041
2015/09/08
0.011
0.007
0.010
0.008
0.016
0.010
0.011
0.020
0.104
2015/09/18
0.007
0.008
0.007
0.007
0.009
0.011
0.023
0.025
0.116
2015/09/24
0.006
0.007
0.008
0.007
0.008
0.006
0.012
0.029
0.116
2015/09/30
0.011
0.009
0.007
0.009
0.007
0.004
0.007
0.045
0.097
2015/10/07
0.009
0.011
0.009
0.009
0.012
0.008
0.008
0.053
0.120
2015/10/14
0.008
0.010
0.009
0.010
0.008
0.008
0.010
0.051
0.166
2015/10/21
0.010
0.010
0.007
0.009
0.009
0.012
0.013
0.046
0.129
2015/10/28
0.009
0.009
0.007
0.009
0.008
0.010
0.017
0.066
0.248
2015/11/04
0.010
0.009
0.010
0.009
0.009
0.010
0.028
0.064
0.175
2015/11/11
0.005
0.007
0.009
0.008
0.009
0.005
0.027
0.065
0.223
2015/11/25
0.016
0.015
0.016
0.014
0.015
0.016
0.017
0.110
0.240
2015/12/02
0.018
0.020
0.020
0.017
0.017
0.015
0.015
0.028
0.220
2015/12/09
0.020
0.025
0.019
0.025
0.017
0.017
0.024
0.014
0.021
18
Table 2.15 SO42- in 2015 (mg/l)
Y/M/D
0.0m
1.0m
2.0m
3.0m
4.0m
5.0m
6.0m
7.0m
8.0m
2015/04/01
6.921
6.896
6.852
6.707
6.701
6.512
6.475
6.388
6.350
2015/04/09
6.455
6.509
6.524
6.700
6.460
6.430
6.418
6.350
6.361
2015/04/15
6.021
6.031
6.131
6.126
6.445
6.151
6.308
6.293
6.278
2015/04/22
6.106
6.192
6.053
6.085
6.476
6.471
6.387
6.221
6.451
2015/04/28
5.970
5.967
5.961
5.992
6.172
6.224
6.081
6.008
5.863
2015/05/07
6.103
6.122
6.165
5.923
6.531
6.222
6.142
6.177
6.129
2015/05/13
6.121
6.074
6.083
6.585
6.358
6.263
6.200
6.250
6.070
2015/05/20
5.735
5.729
5.800
5.156
6.308
6.238
6.192
6.153
6.157
2015/05/27
5.725
5.650
5.604
5.984
6.289
6.290
6.188
6.206
6.094
2015/06/02
5.689
5.816
5.768
6.175
6.062
6.500
6.568
6.280
6.231
2015/06/10
4.998
5.067
5.070
5.581
6.132
6.230
6.203
6.086
6.087
2015/06/17
4.917
4.975
4.936
5.576
6.121
6.285
6.173
6.641
6.140
2015/06/24
4.987
5.101
4.953
5.249
6.336
6.176
6.169
6.126
6.043
2015/07/01
|
|
|
|
|
|
|
|
|
2015/07/08
4.566
4.610
4.453
4.925
6.092
6.147
6.058
5.789
5.780
2015/07/15
4.471
4.498
4.444
4.885
6.051
6.014
5.907
5.818
5.649
2015/07/21
|
|
|
|
|
|
|
|
|
2015/07/29
4.765
4.784
4.928
5.088
6.097
6.318
6.224
6.970
5.854
2015/08/05
4.947
4.888
5.018
6.134
6.433
6.548
6.966
6.863
5.390
2015/08/12
|
|
|
|
|
|
|
|
|
2015/08/20
4.833
4.928
4.894
5.563
5.442
6.113
5.978
5.207
3.848
2015/08/28
4.815
4.784
4.691
5.204
5.040
5.933
5.843
5.151
3.261
2015/09/03
4.689
4.678
4.667
4.748
5.106
5.896
5.555
5.268
3.211
2015/09/08
4.710
4.676
4.612
4.612
5.498
5.564
5.467
4.613
2.478
2015/09/18
5.007
5.009
5.003
5.252
5.706
5.391
5.570
4.570
2.010
2015/09/24
4.976
4.937
4.899
5.108
5.084
5.535
4.934
3.189
1.789
2015/09/30
4.999
4.985
4.950
4.954
5.125
5.606
5.525
2.438
2.796
2015/10/07
4.728
4.717
4.743
4.716
4.892
5.292
5.462
3.704
2.708
2015/10/14
4.834
6.842
4.849
4.863
4.858
5.490
5.247
2.832
2.580
2015/10/21
5.073
5.234
5.484
5.011
5.109
5.370
5.172
3.921
3.057
2015/10/28
5.061
5.979
5.041
4.974
5.168
5.288
5.255
2.860
1.944
2015/11/04
5.112
5.094
5.100
5.127
5.088
5.172
5.179
3.527
2.907
2015/11/11
5.091
5.137
5.140
5.197
5.124
5.194
5.285
3.856
3.223
2015/11/25
5.048
5.021
5.027
5.071
5.080
5.049
4.986
2.697
2.103
2015/12/02
5.144
5.165
5.140
5.242
5.135
5.135
5.164
5.027
3.076
2015/12/09
5.136
5.213
5.138
5.104
5.166
5.101
5.150
5.140
5.155
19
Table 2.16 Sulfide in 2015 (µg/l)
Y/M/D
0.0m
1.0m
2.0m
3.0m
4.0m
5.0m
6.0m
7.0m
8.0m
2015/04/01
2.000
2.300
3.300
2.300
4.000
2.300
2.300
4.700
7.300
2015/04/09
3.700
4.700
3.700
7.300
4.300
2.300
0.300
0.700
2.300
2015/04/15
1.000
7.300
2.000
7.300
6.700
5.000
5.000
4.000
4.000
2015/04/22
4.700
3.300
4.300
4.000
3.700
3.700
3.300
3.700
2.700
2015/04/28
5.000
5.000
5.000
4.000
3.000
3.000
3.000
3.000
0.000
2015/05/07
5.000
5.000
5.000
4.000
4.000
4.000
5.000
4.500
4.000
2015/05/13
5.000
5.000
2.000
3.000
5.000
5.000
5.000
4.000
4.000
2015/05/20
3.000
2.000
1.000
2.000
3.000
4.000
3.000
3.000
5.300
2015/05/27
0.000
0.000
3.000
2.000
4.000
3.000
4.300
4.300
4.300
2015/06/02
6.000
5.000
5.000
3.000
3.000
4.000
4.000
4.300
4.700
2015/06/10
3.000
3.000
3.000
0.000
3.000
4.000
2.300
4.300
8.000
2015/06/17
2.000
3.000
2.000
4.000
5.000
5.000
4.000
5.000
4.700
2015/06/24
3.000
5.000
3.000
5.000
4.000
4.000
4.300
4.700
12.300
2015/07/01
|
|
|
|
|
|
|
|
|
2015/07/08
4.000
2.000
3.000
3.000
3.000
4.000
5.700
5.300
5.600
2015/07/15
4.000
3.000
4.000
4.000
3.000
3.000
3.300
4.300
31.000
2015/07/21
|
|
|
|
|
|
|
|
|
2015/07/29
3.000
4.000
1.000
3.000
2.000
0.000
4.300
3.400
59.000
2015/08/05
5.000
4.000
3.000
5.000
5.000
3.000
6.700
7.700
5.300
2015/08/12
|
|
|
|
|
|
|
|
|
2015/08/20
4.000
4.000
2.000
1.000
4.000
5.000
8.000
91.700
131.400
2015/08/28
8.000
4.000
4.000
2.000
2.000
17.000
9.700
104.700
286.000
2015/09/03
2.000
5.000
5.000
6.000
6.000
13.700
70.000
135.000
491.700
2015/09/08
4.000
4.000
6.000
3.000
5.000
14.700
38.700
183.000
184.400
2015/09/18
0.000
0.000
0.000
0.000
3.000
86.700
133.000
283.700
237.000
2015/09/24
0.000
0.000
2.000
3.000
2.000
22.300
134.000
386.300
308.900
2015/09/30
2.000
1.000
1.000
1.000
1.000
5.300
20.600
754.600
458.800
2015/10/07
3.000
2.000
3.000
3.000
2.000
4.000
7.300
413.700
460.500
2015/10/14
4.000
4.000
4.000
4.000
4.000
7.300
35.700
728.700
513.200
2015/10/21
5.000
5.000
8.000
6.000
7.000
8.300
37.700
540.700
523.000
2015/10/28
3.000
5.000
2.000
1.000
1.000
2.000
25.300
715.600
659.200
2015/11/04
4.000
4.000
3.000
4.000
3.000
3.000
15.000
548.000
461.900
2015/11/11
3.000
3.000
4.000
4.000
4.000
4.000
7.300
553.000
520.000
2015/11/25
3.000
4.000
6.000
6.000
6.000
4.000
18.600
518.300
538.500
2015/12/02
3.000
6.000
6.000
5.000
6.000
5.000
6.000
33.000
358.300
2015/12/09
3.000
3.000
6.000
5.000
3.000
3.000
4.000
7.000
4.300
20
Table 2.17 Cl in 2015 (mg/l)
Y/M/D
0.0m
1.0m
2.0m
3.0m
4.0m
5.0m
6.0m
7.0m
8.0m
2015/04/01
6.427
6.356
6.372
6.496
6.458
6.457
6.437
4.424
4.437
2015/04/09
5.824
5.720
5.747
5.853
6.239
6.315
6.386
6.350
6.409
2015/04/15
5.089
5.035
5.033
5.155
6.273
5.482
6.311
6.290
6.338
2015/04/22
4.997
5.103
5.012
5.150
6.100
6.277
6.368
6.360
6.454
2015/04/28
5.076
5.047
5.018
5.126
5.957
6.166
6.308
6.276
6.317
2015/05/07
4.921
4.887
4.907
4.880
5.877
6.274
6.317
6.316
6.382
2015/05/13
4.887
4.893
4.992
5.009
6.217
6.315
6.368
6.351
6.338
2015/05/20
4.482
4.475
4.288
4.970
6.055
6.263
6.420
6.474
6.437
2015/05/27
4.454
4.513
4.414
5.018
5.705
6.220
6.327
6.492
6.335
2015/06/02
4.409
4.431
4.405
4.841
5.311
6.269
6.403
6.797
6.405
2015/06/10
3.481
3.647
3.628
4.112
5.443
5.819
6.234
6.294
6.319
2015/06/17
3.280
3.383
3.366
4.094
5.377
6.076
6.257
6.324
6.404
2015/06/24
3.390
3.400
3.377
3.815
3.470
5.881
5.280
5.345
5.448
2015/07/01
|
|
|
|
|
|
|
|
|
2015/07/08
3.092
3.152
2.946
2.372
6.016
6.059
6.236
6.268
6.285
2015/07/15
2.866
2.902
2.879
3.345
5.704
6.000
6.204
6.330
6.431
2015/07/21
|
|
|
|
|
|
|
|
|
2015/07/29
3.731
3.746
3.788
3.927
5.582
6.344
6.378
6.508
6.752
2015/08/05
3.740
3.737
3.831
4.880
5.683
6.160
6.253
6.313
4.391
2015/08/12
|
|
|
|
|
|
|
|
|
2015/08/20
3.603
3.643
6.604
4.166
4.732
5.787
6.350
6.560
7.196
2015/08/28
6.525
6.703
6.429
7.073
7.565
6.555
6.750
6.666
7.304
2015/09/03
6.859
6.834
7.110
7.688
7.326
6.762
6.562
6.668
7.160
2015/09/08
6.908
6.921
6.907
6.901
6.729
6.665
6.493
6.563
7.431
2015/09/18
7.190
7.185
7.196
7.172
7.172
7.243
6.701
6.627
6.637
2015/09/24
7.100
7.000
6.954
6.912
6.957
6.676
6.653
6.774
7.635
2015/09/30
7.034
6.923
6.952
6.926
6.896
6.608
6.542
6.838
7.586
2015/10/07
6.419
6.275
6.319
6.294
6.312
6.395
6.454
6.886
6.507
2015/10/14
6.413
6.283
6.319
6.337
6.328
6.391
6.473
6.920
7.766
2015/10/21
6.698
6.484
6.514
6.511
6.501
6.550
6.590
7.030
7.672
2015/10/28
6.535
6.494
6.505
6.492
6.513
6.487
6.604
7.195
8.622
2015/11/04
6.552
6.487
6.510
6.496
6.498
6.489
6.599
7.250
7.897
2015/11/11
6.439
6.390
6.418
6.427
6.478
6.488
6.569
7.176
8.486
2015/11/25
6.043
6.016
6.023
6.011
6.072
6.023
6.278
7.315
8.218
2015/12/02
6.347
6.316
6.416
6.436
6.388
6.366
6.382
6.474
8.071
2015/12/09
6.530
6.581
6.547
6.528
6.631
6.533
6.686
6.659
6.616
21
Table 2.18 Total iron ion in 2015 (mg/l)
Y/M/D
0.0m
1.0m
2.0m
3.0m
4.0m
5.0m
6.0m
7.0m
8.0m
2015/04/01
|
|
|
|
|
|
|
|
|
2015/04/09
|
|
|
|
|
|
|
|
|
2015/04/15
|
|
|
|
|
|
|
|
|
2015/04/22
|
|
|
|
|
|
|
|
|
2015/04/28
0.304
0.301
0.303
0.356
0.198
0.163
0.129
0.138
0.144
2015/05/07
0.203
0.212
0.232
0.226
0.189
0.114
0.114
0.109
0.107
2015/05/13
0.209
0.212
0.244
0.262
0.158
0.121
0.122
0.096
0.092
2015/05/20
0.238
0.245
0.336
0.326
0.186
0.167
0.111
0.085
0.076
2015/05/27
0.189
0.196
0.231
0.250
0.189
0.129
0.098
0.071
0.076
2015/06/02
0.142
0.152
0.152
0.188
0.157
0.115
0.101
0.061
0.085
2015/06/10
0.190
0.191
0.211
0.256
0.185
0.155
0.114
0.070
0.068
2015/06/17
0.160
0.166
0.175
0.232
0.175
0.129
0.090
0.137
0.066
2015/06/24
0.066
0.064
0.065
0.112
0.115
0.083
0.068
0.044
0.126
2015/07/01
|
|
|
|
|
|
|
|
|
2015/07/08
0.062
0.053
0.117
0.077
0.056
0.081
0.041
0.029
0.019
2015/07/15
0.020
0.016
0.027
0.031
0.025
0.026
0.033
0.070
0.071
2015/07/21
|
|
|
|
|
|
|
|
|
2015/07/29
0.019
0.052
0.014
0.024
0.039
0.027
0.003
0.039
0.153
2015/08/05
0.004
0.011
0.012
0.017
0.023
0.004
0.007
0.011
0.011
2015/08/12
|
|
|
|
|
|
|
|
|
2015/08/20
0.015
0.021
0.011
0.009
0.021
0.008
0.015
0.349
1.212
2015/08/28
0.065
0.065
0.123
0.083
0.083
0.013
0.023
0.133
1.225
2015/09/03
0.072
0.054
0.077
0.097
0.040
0.043
0.016
0.099
0.981
2015/09/08
0.069
0.069
0.076
0.084
0.043
0.034
0.037
0.171
2.429
2015/09/18
0.027
0.033
0.023
0.022
0.038
0.028
0.029
0.187
1.962
2015/09/24
0.026
0.024
0.049
0.053
0.043
0.078
0.145
0.307
2.243
2015/09/30
0.028
0.033
0.025
0.039
0.028
0.017
0.090
0.644
1.703
2015/10/07
0.079
0.093
0.082
0.080
0.067
0.050
0.046
0.861
2.351
2015/10/14
0.052
0.059
0.070
0.057
0.052
0.019
0.094
0.771
1.427
2015/10/21
0.060
0.023
0.037
0.042
0.035
0.015
0.071
0.636
1.800
2015/10/28
0.049
0.089
0.052
0.058
0.064
0.048
0.083
1.051
4.198
2015/11/04
0.043
0.054
0.085
0.085
0.044
0.056
0.136
1.033
2.871
2015/11/11
0.058
0.065
0.049
0.045
0.044
0.081
0.047
1.033
3.290
2015/11/25
0.079
0.074
0.074
0.095
0.099
0.068
0.059
1.368
3.625
2015/12/02
0.157
0.155
0.157
0.160
0.163
0.151
0.162
0.355
3.341
2015/12/09
0.441
0.452
0.472
0.438
0.447
0.457
0.452
0.455
0.464
22
Table 2.19 E254 in 2015 (cm-1)
Y/M/D
0.0m
1.0m
2.0m
3.0m
4.0m
5.0m
6.0m
7.0m
8.0m
2015/04/01
|
|
|
|
|
|
|
|
|
2015/04/09
|
|
|
|
|
|
|
|
|
2015/04/15
|
|
|
|
|
|
|
|
|
2015/04/22
|
|
|
|
|
|
|
|
|
2015/04/28
|
|
|
|
|
|
|
|
|
2015/05/07
|
|
|
|
|
|
|
|
|
2015/05/13
|
|
|
|
|
|
|
|
|
2015/05/20
0.223
0.224
0.265
0.249
0.175
0.160
0.140
0.131
0.129
2015/05/27
0.205
0.205
0.222
0.229
0.190
0.156
0.137
0.131
0.134
2015/06/02
0.185
0.185
0.186
0.201
0.176
0.152
0.142
0.132
0.139
2015/06/10
0.232
0.228
0.235
0.232
0.187
0.170
0.140
0.131
0.130
2015/06/17
0.207
0.214
0.211
0.220
0.176
0.146
0.133
0.125
0.125
2015/06/24
0.155
0.158
0.160
0.167
0.150
0.134
0.121
0.112
0.115
2015/07/01
|
|
|
|
|
|
|
|
|
2015/07/08
0.190
0.180
0.215
0.179
0.131
0.132
0.121
0.120
0.117
2015/07/15
0.169
0.171
0.182
0.163
0.126
0.122
0.112
0.120
0.128
2015/07/21
|
|
|
|
|
|
|
|
|
2015/07/29
0.167
0.167
0.170
0.163
0.130
0.118
0.112
0.119
0.132
2015/08/05
0.152
0.150
0.155
0.136
0.122
0.112
0.111
0.110
0.144
2015/08/12
|
|
|
|
|
|
|
|
|
2015/08/20
0.145
0.155
0.150
0.143
0.136
0.122
0.112
0.153
0.194
2015/08/28
0.199
0.199
0.199
0.204
0.188
0.112
0.135
0.130
0.190
2015/09/03
0.177
0.189
0.200
0.186
0.153
0.104
0.091
0.096
0.173
2015/09/08
0.210
0.210
0.209
0.208
0.142
0.140
0.128
0.132
0.321
2015/09/18
0.186
0.182
0.186
0.185
0.178
0.134
0.128
0.132
0.355
2015/09/24
0.179
0.182
0.185
0.181
0.176
0.134
0.128
0.140
0.335
2015/09/30
0.174
0.171
0.169
0.169
0.162
0.119
0.115
0.164
0.206
2015/10/07
0.201
0.197
0.195
0.195
0.177
0.155
0.133
0.173
0.284
2015/10/14
0.158
0.156
0.159
0.160
0.161
0.097
0.114
0.139
0.207
2015/10/21
0.185
0.182
0.185
0.178
0.181
0.151
0.146
0.183
0.279
2015/10/28
0.133
0.133
0.129
0.128
0.131
0.101
0.096
0.138
0.297
2015/11/04
0.159
0.159
0.158
0.158
0.161
0.157
0.136
0.210
0.352
2015/11/11
0.156
0.154
0.165
0.155
0.154
0.152
0.169
0.116
0.233
2015/11/25
0.165
0.163
0.164
0.155
0.162
0.163
0.138
0.179
0.243
2015/12/02
0.159
0.157
0.159
0.160
0.158
0.160
0.161
0.170
0.238
2015/12/09
0.172
0.169
0.167
0.170
0.171
0.172
0.172
0.173
0.171
23