Fundamental analysis
Bạn đang xem bản rút gọn của tài liệu. Xem và tải ngay bản đầy đủ của tài liệu tại đây (1.56 MB, 242 trang )
01_754463 ffirs.qxp
2/23/06
2:38 PM
Page iii
Getting Started in
FUNDAMENTAL
ANALYSIS
Michael C. Thomsett
John Wiley & Sons, Inc.
03_754463 flast.qxp
2/23/06
2:39 PM
Page viii
01_754463 ffirs.qxp
2/23/06
2:38 PM
Page i
Getting Started in
FUNDAMENTAL
ANALYSIS
01_754463 ffirs.qxp
2/23/06
2:38 PM
Page ii
The Getting Started In Series
Getting Started in Online Day Trading by Kassandra Bentley
Getting Started in Asset Allocation by Bill Bresnan and Eric P. Gelb
Getting Started in Online Investing by David L. Brown and
Kassandra Bentley
Getting Started in Investment Clubs by Marsha Bertrand
Getting Started in Internet Auctions by Alan Elliott
Getting Started in Stocks by Alvin D. Hall
Getting Started in Mutual Funds by Alvin D. Hall
Getting Started in Estate Planning by Kerry Hannon
Getting Started in Online Personal Finance by Brad Hill
Getting Started in 401(k) Investing by Paul Katzeff
Getting Started in Internet Investing by Paul Katzeff
Getting Started in Security Analysis by Peter J. Klein
Getting Started in Global Investing by Robert P. Kreitler
Getting Started in Futures by Todd Lofton
Getting Started in Financial Information by Daniel Moreau and
Tracey Longo
Getting Started in Emerging Markets by Christopher Poillon
Getting Started in Technical Analysis by Jack D. Schwager
Getting Started in Hedge Funds by Daniel A. Strachman
Getting Started in Options by Michael C. Thomsett
Getting Started in Real Estate Investing by Michael C. Thomsett and
Jean Freestone Thomsett
Getting Started in Tax-Savvy Investing by Andrew Westham and
Don Korn
Getting Started in Annuities by Gordon M. Williamson
Getting Started in Bonds by Sharon Saltzgiver Wright
Getting Started in Retirement Planning by Ronald M. Yolles and
Murray Yolles
Getting Started in Online Brokers by Kristine DeForge
Getting Started in Project Management by Paula Martin and
Karen Tate
Getting Started in Six Sigma by Michael C. Thomsett
Getting Started in Rental Income by Michael C. Thomsett
Getting Started in Chart Patterns by Thomas N. Bulkowski
Getting Started in Fundamental Analysis by Michael C. Thomsett
01_754463 ffirs.qxp
2/23/06
2:38 PM
Page iii
Getting Started in
FUNDAMENTAL
ANALYSIS
Michael C. Thomsett
John Wiley & Sons, Inc.
01_754463 ffirs.qxp
2/23/06
2:38 PM
Page iv
Copyright © 2006 by Michael C. Thomsett. All rights reserved.
Published by John Wiley & Sons, Inc., Hoboken, New Jersey.
Published simultaneously in Canada.
No part of this publication may be reproduced, stored in a retrieval system, or transmitted in any form or by
any means, electronic, mechanical, photocopying, recording, scanning, or otherwise, except as permitted under Section 107 or 108 of the 1976 United States Copyright Act, without either the prior written permission of the Publisher, or authorization through payment of the appropriate per-copy fee to the Copyright
Clearance Center, Inc., 222 Rosewood Drive, Danvers, MA 01923, (978) 750-8400, fax (978) 646-8600, or
on the web at www.copyright.com. Requests to the Publisher for permission should be addressed to the Permissions Department, John Wiley & Sons, Inc., 111 River Street, Hoboken, NJ 07030, (201) 748-6011, fax
(201) 748-6008, or online at />Limit of Liability/Disclaimer of Warranty: While the publisher and author have used their best efforts in
preparing this book, they make no representations or warranties with respect to the accuracy or completeness of the contents of this book and specifically disclaim any implied warranties of merchantability or fitness for a particular purpose. No warranty may be created or extended by sales representatives or written
sales materials. The advice and strategies contained herein may not be suitable for your situation. You should
consult with a professional where appropriate. Neither the publisher nor author shall be liable for any loss of
profit or any other commercial damages, including but not limited to special, incidental, consequential, or
other damages.
For general information on our other products and services or for technical support, please contact our Customer Care Department within the United States at (800) 762-2974, outside the United States at (317)
572-3993 or fax (317) 572-4002.
Wiley also publishes its books in a variety of electronic formats. Some content that appears in print may
not be available in electronic books. For more information about Wiley products, visit our website at
www.wiley.com.
Library of Congress Cataloging-in-Publication Data:
Thomsett, Michael C.
Getting started in fundamental analysis / Michael C. Thomsett.
p. cm.
Includes index.
ISBN-13 978-0-471-75446-6 (pbk.)
ISBN-10 0-471-75446-3 (pbk.)
1. Investment analysis. 2. Stocks. I. Title.
HG4529.T487 2006
332.63’2042—dc22
2005027857
Printed in the United States of America.
10 9 8 7 6 5 4 3 2 1
02_754463 ftoc.qxp
2/23/06
2:39 PM
Page v
Contents
Introduction: How Fundamental Are the Fundamentals?
1
Chapter 1
Financial Statements and What They Reveal
5
Chapter 2
Basic Stock Market Theories
33
Chapter 3
The Audited Statement—Flawed but Useful
57
Chapter 4
Finding Financial Information Online: Step-by-Step
Explanations
77
Chapter 5
How Accurate Are the Numbers?
95
Chapter 6
Confirmation: The Trend of the Trends
121
Chapter 7
Balance Sheet Ratios: Making the Analysis
137
Chapter 8
Income Statement Ratios: Tracking the Profits
v
155
02_754463 ftoc.qxp
2/23/06
2:39 PM
Page vi
CONTENTS
vi
Chapter 9
The Popular P/E Ratio and How to Use It
173
Chapter 10
Using Fundamental—and Technical—Analysis Together
187
Chapter 11
Indicators That Go beyond the Statements
201
Glossary
215
Notes
227
Index
229
03_754463 flast.qxp
2/23/06
2:39 PM
Page vii
Getting Started in
FUNDAMENTAL
ANALYSIS
03_754463 flast.qxp
2/23/06
2:39 PM
Page viii
04_754463 intro.qxp
2/23/06
2:39 PM
Page 1
Introduction
How Fundamental Are
the Fundamentals?
There is a vast difference between understanding something well
enough to buy it as opposed to understanding it well enough to sell it.
—Zig Ziglar, Secrets of Closing the Sale, 1984
asic, obvious, plain, simple—all of these words describe fundamental in some way. But in practice it is difficult to decide which
stocks to buy, how long to hold onto them, and when or if to sell.
The very concept of value is itself complex. So when it comes to the market, the “fundamentals” are not always basic, obvious, plain, or simple.
Indeed, they are far from it.
Nevertheless, there is a small but important number of guidelines
that you can follow to manage your investment decisions and to reduce
and control risk. The fundamentals come in many forms, some complex
and some simple. The best-known historical information is still found
on a company’s financial statements. The summary of what a company
owns and owes and its net worth, and the year’s operating results are, of
course, very revealing because they provide you with the basic (fundamental) view of how all corporate results are measured: by the numbers.
The numbers are never the whole story, only a starting point. Recognizing the complexity of accounting decisions made by a company and its
auditors, the timing of when transactions are put into the books, and the
internal valuation of assets a corporation uses, all affect the value of a corporation and of its stock. When you look at one company next to another, however, you do not know whether their financial statements were
prepared using the same or similar accounting assumptions.
B
1
04_754463 intro.qxp
2
2/23/06
2:39 PM
Page 2
INTRODUCTION
This presents every investor with a serious problem. If one corporation
is conservative in the way it prepares its financial reports, but another is aggressive, then you cannot make a meaningful comparison. In this respect, the
fundamentals are far from fundamental. The basis for comparison may not
even exist, which is why you need to employ specific tools designed to test
the numbers. Ratios and trend analyses are among the tools that fundamental analysts use every day. You do not need an accounting education to make
informed judgments about the numbers and the trends they represent.
The fundamentals contain far more than just the numbers. For example, most stock market experts would agree that nonfinancial aspects fall
within the range of fundamental information. Matters such as management, industry competitive stance, reputation, dividend rate and payment
history, and regulatory record, all affect what investors think about companies, even though these data are not strictly financial in nature.
In addition to the fundamentals in a range of information types, investors look at technical information, trends related specifically to market price. It is a mistake to use only one form of analysis to the exclusion
of other forms. Both fundamental and technical information are related
to one another. In this book you will see why using a combination of
fundamental and technical indicators is sensible and provides you with
valuable information.
Most investors recognize the importance and value of fundamental
analysis but are not sure that they can master its use. Anyone who does
not have an accounting education has a sense that fundamental analysis
may be too complex. This is not true. Accounting and the reports that are
derived from fiscal analysis are complex documents, but you will see in using this book that you do not require an accounting background to benefit from this range of analytical tools.
The sense that it is simply too complex comes from the unfortunate
fact that many information sources—such as the Internet, books, magazine articles—either present information in an overly complex format or
oversimplify and present the same ratios without giving you any realistic,
practical applications. This is unfortunate. Fundamental analysis does not
have to be so difficult that you cannot grasp the information and put it to
work to manage risks and make informed decisions. Here the information
is kept simple and presented with illustrations, examples, checklists, key
points, and definitions in context. This helps you move through the chapters, even when simply looking up a concept or to read a section, and then
understand how the information is useful to you.
04_754463 intro.qxp
2/23/06
2:39 PM
Page 3
Introduction
3
A problem every investor faces in deciding how to analyze stocks is
not enough choices. The problem is that there are too many choices.
There are many viable stocks to choose from, well-managed corporations
with subtle shades of investment potential. How do you select a handful
from among all of them? How do you achieve true diversification? How
can the fundamentals help you to cut through the volumes of available
information and simplify the decision? These are some of the questions
this book is designed to answer. The tools of fundamental analysis can
and should help you to narrow down your list of choices to a few important indicators. No one can reasonably be expected to study dozens of indicators and to then be able to make a sound selection. The key to
making the decision is based on your personal risk standards and identification of a few key but revealing indicators.
This book is not just an introduction to a range of analytical tools
collectively called fundamental analysis—it is more. It is designed to help
you put those tools to work in identifying risk levels, making valid and
reliable comparisons, and ultimately in picking stocks for your portfolio.
It is this activity—deciding which stocks to buy, how long to hold them,
and when to sell—that lies at the center of every investment program.
Even if you pick the stock of well-managed, financially sound companies,
if your timing is off, your profits will not be at the pace you would hope
and expect. Fundamental analysis helps you to quantify value and financial strength; of equal importance, it helps you to time your decisions to
maximize the potential for profits in your stock selection.
With this in mind, you need the numbers as a starting point, the
information you find in corporate audited financial statements and their
footnotes, which includes quarterly filing papers and annual statements.
Beyond these sources, you need to know how to read financial news and
apply new information to a stock’s value; how to anticipate economic
changes in the broad market; and how those changes are likely to affect
stocks; and how to identify a company’s position within its industry
and sector.
This book, part of the Getting Started In series, provides basic information on the complex topic of fundamental analysis in a way intended to help anyone go through the concepts and definitions without
trouble. The combined visual and learning tools—the many practical examples, definitions in context, key points, checklists, and graphics—take
vague concepts and put them into real-world action in a way that relates
to the same decisions you face as an investor every day.
04_754463 intro.qxp
2/23/06
2:39 PM
Page 4
05_754463 ch01.qxp
2/23/06
2:40 PM
Page 5
1
Chapter
Financial Statements
and What They Reveal
The universal regard for money is the one hopeful fact in our
civilization.
—George Bernard Shaw, Major Barbara, 1905
ou are faced with a daunting task whenever you attempt to tackle
a large body of information and digest it all at once. Advice to the
overwhelmed: Begin at the beginning, proceed through to the
end, and then stop. This explains why books are organized in chapters.
An example of a very big body of information is fundamental analysis because it is broad, complex, and encompasses many different principles.
This chapter “begins at the beginning” by looking at the best-known
type of fundamental analysis, the financial statements.
For many analysts, the fundamentals are limited to a study of just
the numbers. But if you confine your study and comparisons to the financial statements, then the study itself is flawed. Using financial statements as a starting point in a wider program of fundamental analysis, the
broader study includes much more. In the post-Enron age, you need to
be less trusting of even the audited financial statement; you need more
than just the word of the company and its auditors to ensure that the
conclusions you reach are based on valid information.
Y
Financial Statements: A Starting Point
The financial statement is a starting point, in many respects. Often
considered the most important form of what are broadly called the
5
05_754463 ch01.qxp
2/23/06
2:40 PM
Page 6
FINANCIAL STATEMENTS AND WHAT THEY REVEAL
6
Key Point
The financial statements are a starting point in analysis. They are
most useful when they highlight questions you need to ask to get
more details.
fundamental
analysis
the study of a
company’s financial strength,
based on historical
data; sector and
industry position;
management;
dividend history;
capitalization; and
the potential for
future growth. The
combination of
historical information and fiscal
status collectively
represent all data
not directly related
to the price of
stock, and this
body of information is used to
define value investing and to
compare one
stock to another.
ratio
an analytical expression of relationships between
values, expressed
in fractional or
percentage form.
The ratio clarifies
numerical relationships and makes
trend analysis
easier to manage
and understand.
“fundamentals,” the formal statements are a centerpiece and anyone embarking on the selection of
stocks needs to be able to read these statements.
They cannot, however, be used exclusively. They
give you a place to begin checking and judging the
financial results. The statements also provide an investigative starting point to confirm an existing
trend, or to show a deviation from that trend, or
even to launch further searches. In other words,
fundamental analysis should not be limited to a
passive view of recent historical reports; it is the
starting point for a dynamic investigation of the
fiscal validity in what you are being told. (Chapters
3 and 5 examine aspects of this all-important question in greater detail.)
Analysts use a series of tools to make judgments about financial statements and the numbers
they contain. The ratio is a valuable shorthand tool
used to track financial trends and to summarize
a report. It is valuable because it aids in comprehension. For example, “3 to 1” is easily comprehended, whereas “$40,494 to $13,498” is more
difficult to grasp.
Ratios are explored in considerable details in
Chapters 7 and 8. In fact, beyond the study of financial statements, effective use of ratios helps translate
the numbers into useful analytical conclusions. The
ratio is used to track information as part of a trend. It
is not enough to try and draw conclusions from just
looking at the numbers as they are reported this
quarter or this year; to truly understand what is going
on with a company, you want to look at the longer
view, the trend. A trend shows what was going on
05_754463 ch01.qxp
2/23/06
2:40 PM
Page 7
Financial Statements: A Starting Point
7
yesterday, what is going on today and—when properly studied—what is likely to go on tomorrow.
trend
Thinking for a moment about how trends
a long-term tenwork, you come to realize that the use of these data
dency reflected in
in trend form is quite powerful. For example, a
how a corporation’s financial
company may have reported ever-growing sales and
results change
profits over many years. Naturally, there comes a
over time; how
related accounts
point where an established trend of annual growth
emerge as status
cannot be sustained; the trend gradually flattens
changes; and how
out; its rate of acceleration decreases; and sales and
a previously established pattern
profits both “settle down” to a slower pace. This is
of growth begins,
not bad news, necessarily. In fact, trends do tend to
often gradually, to
change.
even out over time as a statistical reality. If the company maintains related ratio-based aspects (such as
a ceiling on expenses, for example) it is a sign that
the growth curve, while slowing down, is being managed well by the
company. On the other hand, if the sales levels begin to drop, but expenses keep rising, it means the company is heading for trouble.
In this situation it would not be revealing to simply look at the latest results from operations and draw conclusions. You need the larger
long-term trend to understand what the latest numbers reveal. Without
the trend, your analysis would be severely limited. This is what is meant
by the use of the financial statements as a starting point, while also relying on much more.
The trend is also going to be revealing when managed through statistical tools. In the following section, some of these tools are explained
in greater detail. Averaging of information over time is necessary because
it is difficult to appreciate a trend in the moment. Moving averages are
necessary to smooth out results. While many analysts do not like to admit it, financial results are chaotic. If you look at the immediate moment
in terms of a company’s sales, costs, expenses and profits, you see a lot of
inconsistency; widely diverse reported results; and temporary aberrations
from month to month. Even a full year’s report is going to represent an
averaging of 12 months’ reports. This averaging absorbs cyclical changes
from one season to the next; unusual activity (above or below the average) caused by numerous unforeseen events; and even unexplained
changes due to accounting timing problems, monthly cycles, and even
customer-based payments or order placement. The immediate trend is
largely chaotic and impossible to read. This is why you need to base
05_754463 ch01.qxp
2/23/06
2:40 PM
Page 8
FINANCIAL STATEMENTS AND WHAT THEY REVEAL
8
analysis on a variety of averaging devices. The moving average is the most
reliable among these because it smoothes out the chaos of what you see
and read today.
Moving Averages—In Various Forms
An examination of reported results is always difficult to interpret when
you look only at the raw data. Look at sales trends as an example. A particular company’s reported results show that sales have been increasing at
the rate of 12 to 15 percent every year over the past five years. Costs have
remained consistently at around 59 percent of sales; and expenses have
risen only slightly over the period. Thus, net profits have come in at
around 4 percent each and every year. Table 1.1 shows a summary with
the most recent years shown last.
Key Point
Moving averages reveal critical information. For example, if sales are
rising but profits are falling—or worse, the company is reporting
losses—that is a sign of poor management.
The sales, costs, expenses, and profit trend summarized here is one
of the most valuable analyses you can perform. It displays a positive trend
of ever-growing sales and increased dollar amount of profits, maintenance of cost, and expense and profit relationships to sales—which is a
sign of a well-planned fiscal program—and perhaps most important of
all, keeping expenses in check relative to the other numerical values.
TABLE 1.1
Sales Trends for One Company (in millions)
Year
Sales
Costs
Expenses
Profits
1
$4,775
$2,788
$1,796
$191
2
5,365
3,176
1,970
219
3
6,159
3,609
2,301
249
4
6,922
4,112
2,507
303
5
7,857
4,612
2,946
299
05_754463 ch01.qxp
2/23/06
2:40 PM
Page 9
Moving Averages—In Various Forms
9
By the same argument, it is likely that a poorly managed company
will experience deterioration of these relations specifically during periods
of growth. Thus, costs rise as a percentage of sales; the dollar amount of
expenses exceeds the rate of increase in sales, and, as a direct consequence, net profits decline. It is quite common to see a company’s sales
rising while profits decline, and even lead to net losses.
Because these trends are not easily spotted in
the moment (for example, from one quarterly finanmoving
cial statement to the next), moving averages are popaverage
ularly used in all types of stock market analysis.
a statistical tool
Technicians like moving averages to track and preused by market
analysts, involving
dict stock price changes over time and to prepare
the use of a field
and study price charts. However, fundamental
of values over
analysis benefits equally well from employing the
time. The moving
average employs a
moving average in its various forms.
specific number of
To understand the advanced variations of movfield values and as
a new value
ing averages, we begin by demonstrating how the
is added, an older
simple moving average works. It is a study of the averone is dropped
age using a set number of values. For example, if we
off.
look a series of entries in a field, we can develop a
simple moving average.
A field of several values over a period of time
simple
is shown next. This may be sales, net profits, exmoving average
penses, or any other financial value that you might
the most basic
variation of the
want to study as part of a program of fundamental
moving average.
analysis. These fields are numbered from the oldest
A field of the
(i.e., 1) to the most recent:
most recent valNumber
Value
Number
Value
1
2
3
4
5
427
833
619
211
952
6
7
8
9
10
1,113
800
634
1,005
716
ues is averaged
and, as each new
value is entered,
the oldest value is
dropped off so
that the number
of values studied
remains constant.
The first aspect of this field worth mentioning is that the range is
quite wide. With 10 different entries, it would be quite impossible to anticipate the next entry in this field, because it varies so much. However, if
05_754463 ch01.qxp
2/23/06
2:40 PM
Page 10
FINANCIAL STATEMENTS AND WHAT THEY REVEAL
10
you follow a moving average, you will gain a less volatile view of what is
occurring in this trend. To compute a moving average, add up the values
and then divide by the number of values.
Formula: Simple Moving Average
N1 + N2 + ... Nn = A
T
where
N = numerical; values in the field
T = total number of values
A = simple moving average
A simple moving average of the five most recent fields would show
how averaging smoothes out even the most volatile trend:
Fields
in Average
Calculation
1–5
2–6
3–7
4–8
5–9
6–10
(427 + 833 + 619 + 211 + 952) ÷ 5
(833 + 619 + 211 + 952 + 1,113) ÷ 5
(619 + 211 + 952 + 1,113 + 800) ÷ 5
(211 + 952 + 1,113 + 800 + 634) ÷ 5
(952 + 1,113 + 800 + 634 + 1,005) ÷ 5
(1,113 + 800 + 634 + 1,005 + 716) ÷ 5
weighted
moving average
a variation of
moving average
in which greater
influence is given
to more recent
field values and
less to older field
values.
Average
608
746
739
742
901
854
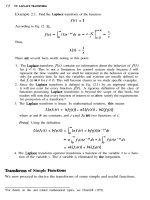
Figure 1.1 shows the range of all 10 fields and
the moving average in this example. Note that the
values in the field are quite volatile; but the moving
average reduces that volatility, so that tracking the
trend over time is made easier. This makes it easier
for you to see the general direction of the trend
over time.
Some variations on the moving average include the weighted moving average and the exponential moving average. You may consider the latest
information to be more important than older
05_754463 ch01.qxp
2/23/06
2:40 PM
Page 11
Moving Averages—In Various Forms
11
information, so more recent values may be
weighted, for example.
Example of a Weighted Moving Average
You are studying a field of five values, as in the previous example. You want to weight the average so
that the latest value has twice the influence on the
moving average; so you count each field once in a
five-part average, but you double the most recent
field. The total is then divided by six:
exponential
moving average
a type of weighted
moving average,
the formula for
which gives
greater weight to
the most recent
field value, while
accumulating the
overall average by
adding the latest
value to the existing field.
Fields
in Average Calculation
1–5
2–6
3–7
4–8
5–9
6–10
Average
(427 + 833 + 619 + 211 + 952 + 952) ÷ 6
(833 + 619 + 211 + 952 + 1,113 + 1,113) ÷ 6
(619 + 211 + 952 + 1,113 + 800 + 800) ÷ 6
(211 + 952 + 1,113 + 800 + 634 + 634) ÷ 6
(952 + 1,113 + 800 + 634 + 1,005 + 1,005) ÷ 6
(1,113 + 800 + 634 + 1,005 + 716 + 716) ÷ 6
666
807
749
724
918
831
These recalculated moving average results change the outcome slightly
when compared to the previous moving average. The distinction may appear minor, but it becomes important when it involves financial information, where most recent field importance can be a significant factor.
The exponential moving average is an example of a mathematical
process that is often made more complicated in its explanation than it needs
to be. It is simply a formulated moving average. It begins by calculating an
exponent (or multiplier). For example, if you are calculating a moving average for a field of five values, you divide 2 by the number of values—or 5:
2 ÷ 5 = 0.4
Next, you calculate the simply moving average for the first five periods. Returning to the previous example:
(427 + 833 + 619 + 211 + 952) ÷ 5 = 608
05_754463 ch01.qxp
2/23/06
2:40 PM
Page 12
FINANCIAL STATEMENTS AND WHAT THEY REVEAL
12
1,200
1,100
1,000
900
Values in the field
800
700
600
500
400
300
200
100
0
1
2
3
4
5
6
7
8
Periods in the moving average
Values in the field
Moving average
FIGURE 1.1 Range of All 10 Fields and Moving Average
9
10
05_754463 ch01.qxp
2/23/06
2:40 PM
Page 13
Moving Averages—In Various Forms
13
The moving average is then subtracted from the next occurring field
value (number 6):
1113 – 608 = 505
This remainder is multiplied by the exponent:
505 × 0.4 = 202
This value is then added to the previous moving average (or, if negative, subtracted from it) to arrive at the sixth period’s exponential moving average:
202 + 608 = 810
This process is carried through for each subsequent field:
Previous New
New
Field Value
Average Difference Exponent Value Average
1–5
6
7
8
9
10
0.4
1,113
800
634
1,005
716
608
608
810
806
737
844
608
505
–10
–172
268
–128
0.4
0.4
0.4
0.4
0.4
202
–4
–69
107
–51
810
806
737
844
793
The calculation of various types of moving averages may be programmed into a spreadsheet program such as Microsoft Excel; in that
case you would need to only enter the latest field value to arrive at a new
moving average. However, simplicity is often the best outcome to strive
for and, if the results of a more complex calculation are not much different than an easier one, it makes sense to go with the easier one.
Key Point
When two different methods of calculating moving average produce
little change in the outcome, go with the easier method. It saves
time, reduces the chance for error, and is more easily comprehended.
05_754463 ch01.qxp
14
2/23/06
2:40 PM
Page 14
FINANCIAL STATEMENTS AND WHAT THEY REVEAL
The essential value of using moving averages is to remove volatility
from an existing trend, so that its direction is more easily recognizable.
One final statistical rule of thumb is to remove exceptionally big changes
from a field of study when they are not typical. For example, if a field of
outcomes over a period of quarters is generally within a narrow range, and
one quarter’s results are exceptionally high or low, you may want to exclude
the exception, recognizing that it distorts the more “normal” range of outcomes. You should remove these spikes under the following guidelines:
1. The spike is far outside the normal range of outcomes.
2. The change is untypical of fields before and after. The range of
results returns to a previously established level.
3. The causes of the spike are nonrecurring and do not represent an
adjustment of previously reported results. (For example, if profits
are reported far below the average because previous outcomes
were incorrect, do not remove the spike. But if a one-time loss is
reported due to a natural disaster, it should be removed because it
is nonrecurring.)
Using averaging as a method for managing information makes
sense. Financial statements, consisting of dollar values, are difficult to interpret. Averaging of data, combined with the use of ratios, help to make
a trend recognizable and plain; this is far preferable to trying to make
sense of columns of numbers. The financial statements, expressed in dollars, are difficult to interpret
balance
without applying these tools. In fact, you should
sheet
never look at a single set of statements to draw conone of three financlusions about a corporation’s capital strength or
cial statements,
operating results; all fundamental analysis should
reporting values of
assets, liabilities,
be studied as part of a larger trend over time. Of
and net worth as
course, to begin, you will need to understand the
of a specific date;
that date is the
purpose of each of the three major financial stateending date of a
ments. The next section explains these in detail.
quarter or year.
The total of assets
(properties) is
equal to the sum
of liabilities
(debts) and net
worth (equity of
the company).
Balance Sheet
The first of three financial statements is the balance
sheet. This statement summarizes everything the
05_754463 ch01.qxp
2/23/06
2:40 PM
Page 15
Balance Sheet
company owns and everything it owes to others, as
well as its financial value.
This statement is called a “balance sheet” for
two reasons. First of all, it is a summary of the balances in all asset, liability, and net worth accounts
as of a specific date. Second, the various sections
are balanced to one another; the total of all assets is
always equal to the sum of all liability and net
worth accounts.
The properties of the company, its assets, constitute the first part of the balance sheet.
Assets fall into several subgroups and later on,
when it comes time to look at specific ratios of the
balance sheet, these subgroups will make sense. They
are arranged to classify assets according to their attributes and degree of liquidity. This is a critical distinction. So one set of assets is highly liquid (cash
and assets that can be converted to cash within one
year) and other assets are not liquid at all (such as
equipment and real estate, for example).
The most common subgroups of assets are described in the following list:
15
assets
the properties
owned by a company, listed on the
balance sheet in
dollar value and
making up the
first of three sections on the balance sheet.
liquidity
an attribute of an
asset relating to
its convertibility
to cash. Some
assets can be
quickly and easily
converted to cash
and are considered highly liquid;
other assets cannot be easily or
quickly converted,
and those assets
have low liquidity.
• Current assets exist in the form of cash or as
assets that can be converted to cash within
12 months (accounts receivable, notes receivable, marketable securities, and invencurrent
assets
tory, for example)
those assets in the
• Long-term assets, which are also called “fixed”
form of cash or
that are convertassets, include any capital assets that cannot
ible to cash within
be deducted in the year purchased but must
12 months, inbe depreciated over several years. These are
cluding accounts
and notes receivshown on the balance sheet at purchase price,
able, marketable
minus accumulated depreciation.
securities, and
inventory.
• Deferred assets and prepaid assets are special
classes of assets. These categories are used to
manage timing differences. For example, if a company pays for
merchandise this year, but that cost belongs in the following year, it
would be improper to report that as a cost for this year; it would