Comparative study of pasting and thermal transition characteristics
Bạn đang xem bản rút gọn của tài liệu. Xem và tải ngay bản đầy đủ của tài liệu tại đây (836.24 KB, 10 trang )
Available online at www.sciencedirect.com
Carbohydrate Polymers 72 (2008) 527–536
www.elsevier.com/locate/carbpol
Comparative study of pasting and thermal transition characteristics
of osmotic pressure and heat–moisture treated corn starch
Chirdchan Pukkahuta a, Bussawan Suwannawat a, Sujin Shobsngob b, Saiyavit Varavinit
a
a,*
Department of Biotechnology, Faculty of Science, Mahidol University, Rama 6 Road, Bangkok 10400, Thailand
b
Department of Chemistry, Faculty of Science, Mahidol University, Rama 6 Road, Bangkok 10400, Thailand
Received 22 January 2007; received in revised form 29 August 2007; accepted 25 September 2007
Available online 1 October 2007
Abstract
Osmotic-pressure-treatment (OPT) was introduced in order to produce the physically modified products similar to conventional heat–
moisture treatment (HMT) starches. OPT is a new method for physical modification of starch in the presence of excess amounts of salt or
sugar. Corn starch is selected for the comparative study of OPT and HMT. For the OPT method, corn starch is suspended in a saturated
solution of sodium sulfate and heated in an autoclave at 120 °C, which corresponds to a calculated osmotic pressure of 34,552 kPa
(assuming sodium sulfate dissociates completely) for 15, 30, and 60 min, respectively. For the HMT method, starch with 20% of moisture
content is packed in Duran bottle, then the same heat treatment method in an autoclave is followed. Scanning electron microscopy
(SEM) show a deformed structure in OPT starch granules, while HMT starch has slight change from the native starch. In the OPT,
the onset (To), peak (Tp), and conclusion (Tc) gelatinization temperatures of starch increase significantly with increasing treatment time,
whereas only Tp and Tc of HMT starches increase. Also the biphasic broadening of Tp for the HMT is found. The broadening of the
peaks (high Tc–To) can be explained by an inhomogeneous heat transfer during the HMT of starch. Narrow DSC peaks can be indication
of a better homogeneity for the OPT samples. Both methods provided similar decreased pattern of gelatinization enthalpy. RVA viscograms of OPT starch exhibited decrease of peak, breakdown and final viscosities, similar to those for HMT starch. Pasting temperature
of OPT starch increased with treatment time, whereas that of HMT starches remained unchanged. These properties indicate that OPT
starch is suitable for large scale production.
Ó 2007 Elsevier Ltd. All rights reserved.
Keywords: Heat–moisture treatment; Osmotic-pressure-treatment; Osmotic pressure; Corn starch; Sodium sulfate
1. Introduction
Annealing and heat–moisture treatment (HMT) are
common physical modifications of starch that do not rupture granules. Annealing generally involves heating granular starch in the presence of high quantity of water between
glass transition and onset temperature, whereas HMT is
carried out at limited moisture content and at elevated temperature (Eliasson & Gudmundsson, 1996).
In HMT, pressure is often required to assure sufficient
heating, although uniform heat distribution and penetra*
Corresponding author. Tel.: +66 22015315; fax: +66 23547160.
E-mail address: (S. Varavinit).
0144-8617/$ - see front matter Ó 2007 Elsevier Ltd. All rights reserved.
doi:10.1016/j.carbpol.2007.09.024
tion into the starch is not easy to accomplish. HMT starch
displays an increased paste stability and gelatinization temperature regardless of origin (Abraham, 1993; Collado &
Corke, 1999; Donovan, Lorenz, & Kulp, 1983; Hoover &
Vasanthan, 1994; Kulp & Lorenz, 1981; Lorenz & Kulp,
1982, 1983; Stute, 1992). Donovan et al. (1983) reported
that HMT makes starch melting endotherm biphasic as
indicated in a differential scanning calorimetry thermogram, and claimed that there is new crystal formation or
crystallite rearrangement in the treated starch granules.
Lim, Chang, and Chung (2001) proposed that the increased
melting range caused by the generation of high temperature
endotherm during HMT is due to annealing of starch crystalline regions. This transformation in the crystalline region
528
C. Pukkahuta et al. / Carbohydrate Polymers 72 (2008) 527–536
results in the new high temperature endotherm. Biphasic
endotherm indicate that the annealing is likely to take place
heterogeneously in the crystalline regions. A number of
authors have claimed that HMT induces changes not only
in crystalline regions but also in amorphous regions of the
starch granules (Hoover & Manuel, 1996; Hoover, Swamidas, & Vasanthan, 1993; Hoover & Vasanthan, 1994).
These investigators also found that amylose content and
starch chain length are two significant factors determining
the physical properties of the final products.
Pukkahuta, Shobsngob, and Varavinit (2007) introduced a new method of physical modification of starch in
the presence of excess amount of sodium sulfate solution,
called ‘‘Osmotic-pressure-treatment’’ (OPT), in order to
produce physically modified products similar to those from
conventional HMT of starch. The excess amount of
sodium sulfate not only increases the osmotic pressure
of the solution mixture but inhibits the gelatinization of
starch granules during the high temperature treatment.
Osmotic pressure is the pressure that must be applied to
prevent the spontaneous movement by osmosis of a solvent
across a semipermeable membrane from a more dilute solution to a more concentrated one. Normally osmotic pressure can be measured by an osmometer. The osmotic
pressure at a given temperature depends upon the molar
concentration. The mathematical relationship is as follows:
p ¼ MRT
where p, osmotic pressure in kPa; M, molarity; R, gas constant (R = 8.314 J molÀ1 KÀ1 or 8.314 L kPa molÀ1 KÀ1);
T, temperature in Kelvin.
In this study, the effects of OPT and HMT on pasting
and thermal transition characteristics of corn starch were
compared.
2. Materials and methods
2.1. Materials
Corn starch was purchased from Choheng Rice Vermicelli Factory Co., Ltd., Nakornpathom, Thailand, and
sodium sulfate from Carlo Erba Reagenti SpA (Rodano,
MI, Italy). All other reagents were of analytical grade, purchased from Merck Co., Ltd. (Darmstadt, Germany).
2.2. Methods
2.2.1. Preparation of OPT corn starch
In a 500-ml Duran glass bottle (Schott, Mainz, Germany), 100 g (dry basis) of starch was suspended in
200 ml of saturated solution of sodium sulfate (100 g
Na2SO4 per 200 ml of distilled water) and heated in an
autoclave (TOMY ES-315, TOMY Digital Biology Co.,
Ltd., Tokyo, Japan) at 120 °C, corresponding to a calculated osmotic pressure of 34552 kPa (assuming complete
dissociation of sodium sulfate) for 15, 30, and 60 min.
The glass bottle was then allowed to cool to room temper-
ature before the starch was removed and washed with distilled water (500 ml · 8) by sedimenting at 4552g (J-6M/E
centrifuge, Beckman Coulter Inc., CA, USA). The presence
of residue sodium sulfate in the starch was tested by precipitating with barium chloride solution. Starch was dried
overnight at 40 °C in a hot air oven (Memmert GmbH,
Schwabach, Germany).
2.2.2. Preparation of HMT corn starch
The moisture content of starch was adjusted to 20% by
spraying the calculated amount of distilled water onto the
starch in a mixing bowl and then mixing thoroughly for
15 min. The exact moisture content was measured using a
moisture analyzer (MA-30, Sartorius AG, Goettingen,
Germany). The moist starch was then placed in a Duran glass
bottle fitted with a screw cap and left to equilibrate for 1 h
before being placed in an autoclave at 120 °C for 15, 30,
and 60 min. After cooling to room temperature, HMT starch
was removed from the Duran bottle and dried overnight at
40 °C in a hot air oven.
2.2.3. Proximate analysis and amylose content
Proximate analysis of native corn starch was performed
using standard methods described in AOAC (1990a, 1990b,
1990c). Protein content was estimated from nitrogen content obtained by Kjeldahl method (model VAPODEST
50 Carousel 250 mL autosampler and model Kjeldatherm-Digestion unit equipped with 250 mL digestion
tubes, Gerhardt, Ko¨nigswinter, Germany), multiplied by
6.25 (AOAC, 1990a, 1990b, 1990c). Fat content of the sample was determined by standard method (AOAC, 1990a,
1990b, 1990c). Carbohydrate content was calculated by
subtracting the percentage of aforementioned compounds
from 100. Amylose content of native corn starch (based
on weight that is free of moisture, protein, fat, and ash)
was determined by iodine affinity method (Knutson, 1986).
2.2.4. Morphology observation
2.2.4.1. Light microscopy. Native, OPT, and HMT corn
starch were suspended in distilled water and viewed under
normal and polarized light microscope (Olympus BX 51,
Olympus, Tokyo, Japan) equipped with a camera set
(Olympus DP 12, Olympus, Tokyo, Japan).
2.2.4.2. Scanning electron microscopy (SEM). Starch sample was mounted on SEM stub with double-sided adhesive
tape and coated with gold. Scanning electron micrographs
were taken using a JOEL JSM-5410LV microscope (JOEL,
Tokyo, Japan). The accelerating voltage and the magnification are indicated on the micrograph.
2.2.5. Determination of thermal property
Thermal property of native and OPT corn starch was
assessed in a differential scanning calorimeter (DSC) (Pyris,
Perkin Elmer, Belerica, MA, USA). Both native and
modified starch (based on weight free of moisture) were
dispersed in distilled water to obtain a starch:water ratio
C. Pukkahuta et al. / Carbohydrate Polymers 72 (2008) 527–536
of 1:2. Corn starch in the presence of saturated solution of
sodium sulfate was also assessed by DSC, by dispersing in
sodium sulfate solution (distilled water:sodium sulfate = 2:1) to obtain starch/sodium sulfate solution ratio
of 1:2. Starch suspension was then transferred to an aluminum pan (30 lL) and hermetically sealed. After equilibration at room temperature for 1 h., sample was heated
from 20 to 150 °C at a rate of 10 °C/min. The empty pan
was used as reference and the DSC was calibrated with
indium. Onset (To), peak (Tp), and conclusion (Tc) gelatinization temperatures, and gelatinization enthalpy (DH) (J/g
of dry starch) were recorded.
2.2.6. Determination of pasting property
A Rapid Visco Analyzer (Series 4V, Newport Scientific
Pty. Ltd, Warriewood, Australia) was employed to investigate the pasting property of native and modified starch.
Starch sample (2.5 g dry basis) and 25 mL of distilled water
were mixed with a paddle in an aluminum can. Heating and
cooling cycles were programmed as follows: holding at
529
50 °C for 1 min, heating from 50 to 95 °C at a rate of
12 °C/min, holding at 95 °C for 2.5 min, and finally cooling
to 50 °C at a rate of 12 °C/min and holding at 50 °C for
2 min.
2.2.7. Determination of swelling power and percent solubility
Swelling power (SP) and percent solubility (%SOL) were
determined by a modified method of Schoch (1964). Starch
samples (0.5 g dry basis (db) suspended in 15 mL of distilled water) were placed in 30 mL centrifuge tubes fitted
with screw caps and heated in a water bath shaker
(150 rpm) at 60–95 °C for 30 min. After heating, the centrifuge tubes were cooled to room temperature and centrifuged at 1638g (18/80R Sanyo Harrier Centrifuge, Osaka,
Japan) for 15 min. The supernatants were dried to constant
weight in a hot air oven at 100 °C. Precipitated paste and
dried supernatant were weighed. All measurements were
done in triplicate. Swelling power and percent solubility
were calculated as follows:
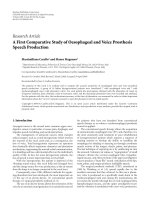
Fig. 1. Light and polarized light micrograph of native corn starch (A1 and A2), OPT corn starch treated at 120 °C, 60 min (B1 and B2), and HMT corn
starch treated at 120 °C, 60 min (C1 and C2).
530
C. Pukkahuta et al. / Carbohydrate Polymers 72 (2008) 527–536
A
 100
S
B Â 100
SP ¼
Sð100 À %SOLÞ
%SOL ¼
a 100% RH desiccator for 24 h at room temperature prior
to measurement.
where %SOL, percent solubility; SP, swelling power; A,
weight of dried soluble starch; B, weight of sediment paste;
S, weight of dried sample.
2.2.9. Statistical analysis
Analytical determinations of individual samples were
conducted in triplicate and mean values and standard
deviations reported. Data were analyzed using variance
(ANOVA) test procedure. Statistically significant difference was identified by Tukey’s HSD test (p < .05)
using SPSS 12.0 program for Windows (SPSS Inc., IL,
USA).
2.2.8. Wide-angle X-ray powder diffraction measurement
Wide-angle X-ray diffraction patterns of native and
modified starch were recorded with a Bruker X-ray powder
diffractometer (D-8 type, Bruker, Rheinfelden, Germany)
with copper anode X-ray tube (Cu-Ka radiation) at
30 kV and 30 mA. A scanning region of the diffraction
angle (2h) was adjusted from 5o to 30o at a step size of
0.4o with a count time of 1.0 s and rotary speed of sample
holder of 30 minÀ1. The starch samples were equilibrated in
3. Results and discussion
3.1. Proximate analysis and corn starch amylose content
Native corn starch used contained 0.25% protein, 0.07%
fat, 0.06% ash, 13.16% moisture, and 86.46% carbohydrate,
with amylose content 33.73%.
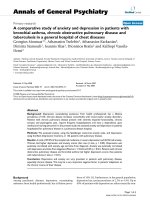
Fig. 2. Scanning electron micrograph of native corn starch (A1 and A2), OPT corn starch treated at 120 °C, 60 min (B1 and B2), and HMT corn starch
treated at 120 °C, 60 min (C1 and C2).
C. Pukkahuta et al. / Carbohydrate Polymers 72 (2008) 527–536
531
3.2. Granule morphology
3.3. Thermal property
3.2.1. Light microscopy
Light and polarized light micrographs of native, OPT,
and HMT corn starch are shown in Fig. 1. There was no
significant change between native and modified starch
when observing under light microscope. Polarized light
micrographs of both HMT and OPT starch show birefringence confirming the presence of non-gelatinized granules.
DSC thermogram of corn starch in the presence of saturated sodium sulfate solution showed To, Tp, and Tc of
121, 129, and 134 °C, respectively, indicating that OPT
corn starch can be prepared without gelatinization at a
maximum temperature of 120 °C.
Ahmad and Williams (1999), using DSC, showed that
Tp of sago starch increased with increasing concentration
of sodium sulfate. Jane (1993) proposed that the higher
To of corn starch in sodium sulfate solution can be attributed to the diminished fraction of free water and the higher
viscosity of the solution. Increased viscosity retards diffusion of salt into the starch granules and further decreases
the diluent concentration within the granules. Also, repulsion between the electronegative OH groups of starch and
the strongly negatively charged SO4 À2 ions increases the
resistance of starch to gelatinization.
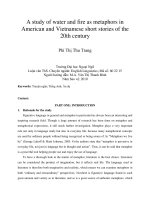
The melting peak appeared as a single narrow curve at
every treatment time (Fig. 3, Table 1). When corn starch
was treated at 120 °C for 60 min, the melting range was
10.93 °C, only 0.43 °C greater than that of untreated
starch. To, Tp, and Tc gelatinization temperatures increased
linearly with treatment time (Fig. 5a–c). These results indicate that the reformation of crystalline regions results in
newly developed high temperature endotherm. Narrow
endotherm curve with small increase of melting range indicate the possibility of having homogeneously annealing
process in the crystalline regions of OPT starch. The
OPT process of starch provided the same results of the
thermal properties as that of the annealing process. However, the higher temperature used in the OPT process can
accelerate the annealing process.
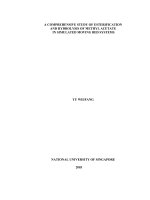
For HMT, corn starch was treated at 120 °C with 20%
moisture content for 15, 30, and 60 min. The melting curve
appeared to be biphasic in every treatment time (Fig. 4).
These phenomena have been described by Donovan et al.
(1983) as being due to new crystal formation or crystallite
rearrangement in the treated starch granules. Lim et al.
3.2.2. Scanning electron microscopy
Scanning electron micrographs of native, OPT, and
HMT corn starch are shown in Fig. 2. Native corn starch
granules were in the form of a polyhedron without any
pores (A1 and A2), but the deformation of surface was
observed in OPT corn starch (B1 and B2), similar to previous studies on HMT potato starch (Pukkahuta et al.,
2007). On the other hand, HMT corn starch showed only
a few number of starch granules that have deformed structure (C1 and C2).
60 min
Endothermic heat flow
30 min
15 min
Native
40
50
60
70
80
90
100
Temperature (oC)
Fig. 3. Differential scanning calorimetry thermogram of native and OPT
corn starch after various treatment times.
Table 1
Differential scanning calorimetry characteristics of OPT and HMT of corn starches treated at 120 °C after various treatment times
Treatment
Treatment
temperature (°C)
Treatment time
(min)
Transition temperatures
To (°C)
Tp (°C)
Tc (°C)
Tc–To(°C)
DH (J/g)
Native
–
–
67.84 ± 0.02b
72.05 ± 0.04a
78.34 ± 0.04a
10.50 ± 0.03a
12.30 ± 0.03e
OPT
120
15
30
60
70.80 ± 0.05e
73.23 ± 0.03f
76.77 ± 0.01g
74.72 ± 0.03e
77.03 ± 0.03f
80.39 ± 0.04i
82.37 ± 0.03b
85.39 ± 0.03e
87.70 ± 0.03g
11.57 ± 0.03c
12.16 ± 0.04d
10.93 ± 0.04b
11.73 ± 0.04c
11.78 ± 0.02c
6.71 ± 0.03a
HMT
120
15
67.98 ± 0.03c
83.76 ± 0.03c
15.78 ± 0.05e
12.00 ± 0.04d
30
67.73 ± 0.04a
85.14 ± 0.03d
17.41 ± 0.06f
12.00 ± 0.03d
60
68.15 ± 0.04d
72.38 ± 0.04b,
77.87 ± 0.03g
72.71 ± 0.03c,
80.21 ± 0.03h
72.90 ± 0.04d,
82.22 ± 0.03j
86.73 ± 0.03f
18.58 ± 0.02g
8.87 ± 0.03b
All data represent the mean of three determinations.
Mean ± standard deviation.
Means with the same letter in each column are not significantly different (p < .05).
532
C. Pukkahuta et al. / Carbohydrate Polymers 72 (2008) 527–536
Endothermic heat flow
60 min
30 min
15 min
Native
50
40
80
70
60
Temperature
100
90
(oC)
Fig. 4. Differential scanning calorimetry thermogram of native and HMT
corn starch after various treatment times.
(2001) indicated that biphasic endotherm might reflect
annealing taking place heterogeneously in the location of
crystalline regions. To remained unchanged whereas Tp
and Tc gelatinization temperatures increased linearly with
the treatment time (Table 1, Fig. 5b and c). The transition
temperature range (Tc–To) increased linearly with treatment time (Figs. 4 and 5d). When corn starch with 20%
moisture was treated at 120 °C for 60 min, the melting
range of the treated starch was 18.58 °C, 8.08 °C greater
Fig. 6. Pasting profile of native and OPT corn starches after various
treatment times.
than that of the untreated starch. The increased melting
range by HMT has already been reported (Pukkahuta
et al., 2007). Furthermore, Hoover et al. (1993) and Hoover
and Manuel (1996) claimed that HMT allows amylose molecules located in the bulk amorphous regions to interact
with the branched segments of amylopectin in the crystalline regions. These interactions consequently reduce the
100
100
90
80
R = 0.9839
OPT
70
HMT
R2 = 0.3681
60
R2 = 0.8316
R2 = 0.9865
70
HMT (Tp1)
R2 = 0.91
60
50
50
40
40
0
15
30
45
60
75
0
15
30
45
60
75
Treatment time (min)
Treatment time (min)
25
100
R2 = 0.9124
HMT
OPT
R2 = 0.7826
80
R2 = 0.761
20
Tc – To (oC)
90
Tc (oC)
HMT (Tp2)
OPT
80
2
Tp (oC)
To (oC)
90
70
HMT
15
OPT
10
R2 = 0.0242
60
5
50
0
40
0
15
30
45
Treatment time (min)
60
75
0
15
30
45
60
Treatment time (min)
Fig. 5. Relationship between treatment time and To (a), Tp (b), Tc (c), and Tc–To (d) of HMT and OPT corn starch.
75
C. Pukkahuta et al. / Carbohydrate Polymers 72 (2008) 527–536
533
gelatinization temperatures, the former narrowing the gelatinization temperature range while the latter broadening it.
However, both methods provide similar decreased pattern
of gelatinization enthalpy, indicating a partial loss of crystallinity of the treated starch.
3.4. Pasting property
Fig. 7. Pasting profiles of native and HMT corn starch after various
treatment times.
mobility of the amylopectin chains and thus increase the
transition temperature for melting. The transition, perhaps
by rearrangement of the shorter amylopectin chains, is
facilitated by thermal energy and water provided in the
treatment. Lim et al. (2001) proposed that the increased
melting range caused by the generation of high temperature
endotherm was due to annealing of starch crystalline
regions during HMT. This transformation in the crystalline
region results in the new high temperature endotherm. Vermeylen, Goderis, and Delcour (2006) also reported that
both annealing and HMT of potato starch increase DSC
Break down viscosity (RVU)
Peak viscosity (RVU)
250
2
R = 0.9906
200
HMT
150
100
2
R = 0.9762
OPT
50
0
0
15
30
45
60
RVA pasting curves of native, OPT, and HMT modified
starch are presented in Figs. 6 and 7. The major RVA
parameters, such as PKV (peak viscosity), BDV (breakdown viscosity), FNV (final viscosity), and PT (pasting
temperature), are listed in Table 2. RVA viscograms for
both OPT (Fig. 6) and HMT (Fig. 7) starch exhibited a
decrease of PKV, BDV, and FNV in comparison with
native corn starch and an increase with treatment time
(Fig. 8a–c). Lower PKV, reduced BDV, and higher FNV
have been reported for heat–moisture treated potato starch
(Stute, 1992). Decrease of PKV, BDV, and FNV can be
attributed to the formation of amylose–lipid complex during HMT and OPT processes (Hoover et al., 1993). These
pasting properties can be accounted for the reduction in
granular swelling and improvement in paste stability upon
prolonged heating. However, only PT of OPT starch
increased with increase of treatment time, whereas PT of
the HMT starch remained unchanged (Fig. 8d). These pasting properties confirm the similarity of pasting characteristics for both HMT and OPT starch except for PT, which is
100
80
60
R2 = 0.8831
40
20
OPT
0
0
75
15
250
100
R2 = 0.7533
200
Pasting temperature (oC)
Final viscosity (RVU)
30
45
60
75
Treatment time (min)
Treatment time (min)
HMT
150
R2 = 0.9707
100
HMT
R2 = 0.9111
OPT
50
R2 = 0.8657
OPT
HMT
80
R2 = 0.5972
60
40
20
0
0
0
15
30
45
Treatment time (min)
60
75
0
15
30
45
60
75
Treatment time (min)
Fig. 8. Relationship between treatment time of HMT and OPT corn starch and peak viscosity (a), breakdown viscosity (b), final viscosity (c), and pasting
temperature (d).
534
C. Pukkahuta et al. / Carbohydrate Polymers 72 (2008) 527–536
Table 2
Pasting properties of OPT and HMT of corn starches treated at 120 °C after various treatment times
Treatment
Treatment
temperature (°C)
Treatment
time (min)
Peak (RVU)
Holding
strength (RVU)
Breakdown
(RVU)
Final viscosity
(RVU)
Setback
(RVU)
Pasting
temperature (°C)
Native
–
–
217.83 ± 0.76g
143.92 ± 1.27d
73.92 ± 0.99e
218.92 ± 1.01e
75.00 ± 1.08g
78.35 ± 0.30a
OPT
120
15
30
60
176.67 ± 1.11d
160.92 ± 1.73b
67.25 ± 1.09a
138.83 ± 1.75c
133.83 ± 1.04b
64.25 ± 0.95a
37.83 ± 1.33c
27.08 ± 0.99b
3.00 ± 0.30a
188.50 ± 0.72c
172.08 ± 1.51b
83.67 ± 0.70a
49.67 ± 1.15d
38.25 ± 0.66b
29.42 ± 1.07a
84.70 ± 0.61c
86.40 ± 0.53d
89.60 ± 0.53e
HMT
120
15
30
60
201.75 ± 1.08f
193.92 ± 1.16e
169.42 ± 1.02c
155.33 ± 1.01f
149.25 ± 1.09e
144.58 ± 1.24d
46.42 ± 0.73d
44.67 ± 0.76d
24.83 ± 0.97b
214.42 ± 0.81d
219.00 ± 1.32e
188.33 ± 0.65c
59.08 ± 1.03e
69.75 ± 1.01f
43.75 ± 0.66c
83.05 ± 0.83b
83.10 ± 0.36bc
83.80 ± 0.72bc
All data represent the mean of three determinations.
Mean ± standard deviation.
Means with the same letter in each column are not significantly different (p < .05).
in agreement with the increase of onset temperature (To) of
OPT starch with treatment time seen in the DSC
measurements.
3.5. Swelling power (SP) and % solubility (%SOL)
SP and %SOL of OPT and HMT corn starch at 120 °C
for 15, 30, and 60 min are shown in Figs. 9 and 10, respectively. All samples from OPT process exhibited a good lin-
16
16
Native
OPT 15 min
OPT 30 min
OPT 60 min
2
Native (R =0.98)
2
OPT 15 min (R =0.98)
2
OPT 30 min (R2=0.99)
OPT 60 min (R =0.94)
12
10
Native
HMT 15 min
HMT 30 min
HMT 60 min
2
Native (R =0.99)
2
HMT 15 min (R =0.96)
2
HMT 30 min (R =0.93)
2
HMT 60 min (R =0.94)
14
Swelling power
14
Swelling power
ear relationship (R2 > .9) between the increase in SP and
%SOL with the increase of heating temperature from 60
to 95 °C. However, OPT corn starch exhibited a decrease
of SP value with treatment time in the tested temperature
range, whereas an increase of %SOL value with treatment
time was observed. These results demonstrated that OPT
corn starch inhibits starch swelling and allows amylose to
leach out from the starch granules, suggesting that %SOL
of OPT corn starches is influenced by the gelatinization
8
6
12
10
8
6
4
4
2
2
0
0
50
50
60
70
80
90
60
100
70
80
90
100
90
100
Temperature (oC)
Temperature (oC)
7
6
Native
OPT 15 min
OPT 30 min
OPT 60 min
2
Native (R =0.99)
2
OPT 15 min (R =0.96)
2
OPT 30 min (R2=0.93)
OPT 60 min (R =0.94)
4
3
% Solubility
% Solubility
5
Native
HMT 15 min
HMT 30 min
HMT 60 min
2
Native (R =0.99)
2
HMT 15 min (R =0.83)
2
HMT 30 min (R =0.67)
2
HMT 60 min (R =0.94)
6
2
5
4
3
2
1
1
0
0
50
60
70
80
90
100
Temperature (oC)
Fig. 9. Swelling power (a) and % solubility (b) as a function of
temperatures of OPT corn starch at various treatment times. Error bars
represent standard deviations.
50
60
70
80
Temperature (oC)
Fig. 10. Swelling power (a) and % solubility (b) as a function of
temperature of HMT corn starch at various treatment times. Error bars
represent standard deviations.
C. Pukkahuta et al. / Carbohydrate Polymers 72 (2008) 527–536
enthalpy of starch. The decrease of gelatinization enthalpy
(DH) after OPT process at various treatment times correlated well with that of the increase of %SOL (R2 = .92)
at 95 °C (data not shown). The reduction of DH after
OPT process results in an increase in the amorphous region
within the starch granules. This could be attributed to the
fact that amorphous regions are more susceptible to be
dissolved in hot distilled water than those of the crystalline
regions and thus high amorphous region has high
solubility. The results of SP of HMT starch gave similar
patterns as those of OPT starch. However, the pattern of
%SOL of HMT starch was different from that of OPT
starch. Some graphs were not linear and were not in
ordered positions as those of the OPT process. These
properties indicate the heterogeneous treatment by HMT
process. Furthermore, there was no relationship between
DH and %SOL at 95 °C.
3.6. Wide-angle X-ray diffraction
Wide-angle X-ray diffraction pattern of the native, OPT,
and HMT corn starch is given in Figs. 11 and 12. Treated
corn starch retained the typical A-type diffraction pattern
with strong peaks at 2h of about 15o and 23o and a doublet
at 17o and 18o of the original starch. Thus, OPT and HMT
starch in this study do not have basically changed molecular arrangements in residual granules. Vermeylen et al.
(2006), studying wide-angle X-ray diffraction and smallangle X-ray scattering (SAXS) of hydrothermal treated
potato starch, found that annealed samples compared to
native showed a more intense 9 nm scattering maximum,
suggesting a more efficient packing of crystallites in dense
lamellae. HMT, on the other hand, results in the development of a diffuse SAXS background, which becomes more
prominent for samples treated at higher temperatures, and
eventually replaces the 9 nm scattering maximum. The
stacked lamellae, present in native and annealed starches,
are thus clearly disrupted by the HMT process.
535
60 min
30 min
15 min
Native
5
15
10
20
25
30
Diffraction angle 2θ (ο)
Fig. 12. X-ray diffraction patterns of native corn starch and HMT corn
starch treated at 120 °C after various treatment times.
4. Conclusion
Corn starch was used for the comparative study of HMT
and OPT methods. In OPT, gelatinization temperature (To)
together with Tp and Tc of starch increased significantly
with increase in treatment time, whereas only Tp and Tc
of HMT starch increased with treatment time. The biphasic
broadening of the peaks (high Tc–To) can be explained by
an inhomogeneous heat transfer during HMT of starch.
Narrow peak of DSC curve can be used as an indication
of improved homogeneity of OPT samples. However, both
methods provided similar decreased pattern of gelatinization enthalpy, indicating a partial loss of crystallinity of
the starch granules during treatment. The RVA viscograms
for OPT exhibited a decrease of PKV, BDV, and FNV with
treatment time, which is in agreement with the patterns of
RVA viscograms for HMT starch. It is also observed that
only PT of OPT starch increased with treatment time,
whereas the PT of HMT starch remained unchanged. As
a result, these pasting properties confirm the similarity of
the pasting characteristics of both HMT and OPT starch
except for PT. OPT of starch provided a uniform heat
distribution in the starch suspension, thus allowing OPT
modified starch to be produced in large scale.
Acknowledgements
60 min
This research is supported by the Center for Agriculture
Biotechnology under the Higher Education Development
Project, Commission on Higher Education, the Ministry
of Education and Research Assistantship (RA).
30 min
References
15 min
Native
5
10
15
20
Diffraction angle 2θ (ο)
25
30
Fig. 11. X-ray diffraction pattern of native corn starch and OPT corn
starch treated at 120 °C after various treatment times.
Abraham, T. E. (1993). Stabilization of paste viscosity of cassava starch
by heat moisture treatment. Starch, 45, 131–135.
Ahmad, F. B., & Williams, P. A. (1999). Effect of salts on the
gelatinization and rheological properties of sago starch. Journal of
Agricultural and Food Chemistry, 47, 3359–3366.
AOAC (1990a). Official method of analysis, ash and moisture content
(15th ed.). Association of official analytical chemistry (pp. 777).
Arlington, USA.
536
C. Pukkahuta et al. / Carbohydrate Polymers 72 (2008) 527–536
AOAC (1990b). Official method of analysis, fat (15th ed.). Association of
official analytical chemistry (pp. 780). Arlington, USA.
AOAC (1990c). Official method of analysis, protein (15th ed.). Association
of official analytical chemistry (pp. 781). Arlington, USA.
Collado, L. S., & Corke, H. (1999). Heat moisture treatment effects on
sweet potato starches different in amylose content. Food Chemistry, 65,
339–346.
Donovan, J. W., Lorenz, K., & Kulp, K. (1983). Differential scanning
calorimeter of heat–moisture treated wheat and potato starches. Cereal
Chemistry, 60, 381–387.
Eliasson, A.-C., & Gudmundsson, M. (1996). Starch: Physicochemical and
functional aspects. In A.-C. Eliasson (Ed.), Carbohydrates in foods
(pp. 431–504). New York: Marcel Dekker.
Hoover, R., & Manuel, H. (1996). The effect of heat moisture treatment on
the structure and physicochemical properties of native maize, waxy
maize, dull waxy maize & amylomaize V starches. Journal of Cereal
Science, 23, 153–162.
Hoover, R., Swamidas, G., & Vasanthan, T. (1993). Studies on the
physicochemical properties of native, defatted, and heat moisture
treated pigeon pea (Cijanus cajan T) starch. Carbohydrate Research,
246, 185–203.
Hoover, R., & Vasanthan, T. (1994). Effect of heat–moisture treatment on
the structure and physicochemical properties of cereal, legume, and
tuber starches. Carbohydrate Research, 252, 33–52.
Jane, J. (1993). Mechanism of starch gelatinization in neutral salt
solutions. Starch, 45, 161–166.
Knutson, C. A. (1986). A simplified colorimetric procedure for determination of amylose in maize starches. Cereal Chemistry, 63(2), 89–92.
Kulp, K., & Lorenz, K. (1981). Heat moisture treatment of starches, I.
Physicochemical properties. Cereal Chemistry, 58, 46–48.
Lim, S.-T., Chang, E.-H., & Chung, H.-J. (2001). Thermal transition
characteristics of heat–moisture treated corn and potato starches.
Carbohydrate Polymers, 46, 107–115.
Lorenz, K., & Kulp, K. (1982). Cereal and root starches modification by
heat–moisture treatment. Starch, 34, 76–81.
Lorenz, K., & Kulp, K. (1983). Physicochemical properties of defatted
heat-moisture treated starches. Starch, 35, 123–129.
Pukkahuta, C., Shobsngob, S., & Varavinit, S. (2007). Effect of osmotic
pressure on starch: New method of physical modification of starch.
Starch, 58, 78–90.
Schoch, T. J. (1964). Swelling power and solubility of granular starches:
Whole starches and modified starches. In R. L. Whistler (Ed.). Methods
in carbohydrate chemistry (Vol. 4, pp. 106). New York: Academic Press.
Stute, R. (1992). Hydrothermal modification of starches: The difference
between annealing and heat/moisture treatment. Starch, 44, 205–214.
Vermeylen, R., Goderis, B., & Delcour, J. A. (2006). An X-ray study of
hydrothermal treated potato starch. Carbohydrate Polymers, 64,
364–375.