Effects of education on earnings the case of ben tre province
Bạn đang xem bản rút gọn của tài liệu. Xem và tải ngay bản đầy đủ của tài liệu tại đây (2.61 MB, 84 trang )
UNIVERSITY OF ECONOMICS
INSTITUTE OF SOCIAL STUDIES
HO CHI MINH CITY
THE HAGUE
VIETNAM
THE NETHERLANDS
************************
VIETNAM- NETHERLANDS PROGRAMME
FOR M.A. IN DEVELOPMENT ECONOMICS
EFFECTS OF EDUCATION ON EARNINGS:
THE CASE OF BEN TRE PROVINCE
By
Mr. NGUYEN MINH QUANG
A Thesis Submitted in Partial Fulfillment of the Requirements of the Degree of
MASTER OF ARTS IN DEVELOPMENT ECQNOMJGS--·----- _- _ ---- -l
F:D CV:: _---. :: :: :,.,;:·
I T:llJ.'(i'~Jt'; ~..,:- \ ~.... ~
~
I
~ ! .
. .. ' • .,_~,
, ; :\'
• ' ·: ·--
! 'IIIt.t
Academic Supervisor
Dr. NGUYEN HOANG BAO
HO CHI MINH CITY, 2010
'
.
;~-!~·>~
·:.·~= ·~·r"'_,y~·:r,}
. .
.
l....
•
•
'""
-
CERTIFICATION
I certify that the substance of this dissertation has not already been submitted for
any degree and is not being currently submitted for any other degree.
I certify that to the best of my knowledge any help received in preparing this
dissertation, and all sourced used, have been acknowledged in this dissertation.
NGUYEN MINH QUANG
Date: ........................ .
•
ACKNOWLEDGEMENT
To be able to complete this thesis, I have been received a great support from many
people. Firstly, I would like to express my appreciation and special thanks to Dr.
Nguyen Hoang Bao, the author's supervisor, who has been giving me very valuable
instruction, advising and comments for the successfulness of my thesis. Secondly, I
am indebted to all teachers and staffs of the Vietnam- Netherlands Program at the
University of Economics Ho Chi Minh city. Especially, Assoc. Prof. Karel Jansen,
Assoc. Prof. Nguyen Trong Hoai for their best supports and valuable comments.
Thirdly, I would like to express sincere thanks to Dr. Nguyen Huu Dung who has
provided valuable comments and instructions for completion of this thesis. Fourthly,
I am grateful to my manager and colleagues for their encouragement and support
during my study duration. Fifthly, I would like to express my special thanks to all
my friends, especially Mr. Le Cong Tam, and Mr. Tran Nam Quae having given me
a lot of valuable opinions and support in the process of my thesis completion.
Finally, I am indebted to my family and others who gives me great encouragement
and support for my study.
ii
---------------- - - - - - -
•
ABSTRACT
Education is considered as one of the main factors help people to find the job, break
out poverty and improve incomes of individuals and households. To understand how
the education levels effect on earnings and rates of return to education, Ben Tre
province in the Mekong Delta is chosen as a case study in this study. Data of 143
workers, aged from 15 to 60 years and having earnings are draw from Vietnam
household living standard survey (VHLSS) 2006. The theory of human capital and
Mincer earnings functions (1974) are employed in this research. Estimation results
show that among explanatory variables such as schooling years, education levels,
working hours, cultivated land size, gender, and sector have significant effects to
earnings. One more schooling year helps to increase earnings of workers by 5.63%.
Person, work in public sector, obtain higher education level and earnings than those
works in private sector. Similarly, higher education and earnings are found for male
workers than those of female workers. The fact that increases in working hours has
positive effects to earning are a reasonable result.
Meanwhile, region and
experience of workers have no significant effects to earnings. From the results of
this research, some policies will be suggested to increase individual income through
the improvement of individual education factors. Rates of return to education are
not linearly with education levels. Highest rate of return is found for secondary
school level. Findings from this research confirm the benefit of education on
earnings of workers, and rates of returns are not the same for levels of education,
which are similar to research results of their studies.
iii
-------,---- - - - - - - - - - - - - - - - - - - - - - - - - - - - - - - -
CONTENTS
Page
CERTIFICATION .................................................................................................. i
ACKNOWLEDGEMENTS ................................................................................... ii
ABSTRACT ........................................................................................................ iii
CONTENTS ........................................................................................................ iv
ABBREVIATION ................................................................................................ ix
LIST OF TABLES ................................................................................................. X
LIST OF FIGURES .............................................................................................. xi
Chapter 1: Introduction
1.1 Problem statement ...................................................................................... 1
1.2 Objectives of the thesis .............................................................................. 2
1.3 Research question and research hypothesis ............................................... 3
1.4 Data and methodology ............................................................................... 3
1.5 Organization of the research ...................................................................... 4
Chapter 2: Literature review
2.1 Theoretical framework ............................................................................... 5
2.1.1 Key definitions .................................................................................. 5
2.1.1.1 Human capital. .......................................................................... 5
2.1.1.2 Rate of return ............................................................................ 6
2.1.2 The link between education and farm productivity ........................... 6
2.1.3 The relationship between education and income .............................. 8
iv
2 .1.4 The theory for human capital .......................................................... 10
2.1.4.1 Measuring the cost .................................................................. 13
2.1.4.2 Measuring the benefits of education ....................................... 13
2.1.4.3 The internal rate ofreturn to schooling .................................. 14
2.1.5 Mincerian earnings function methods ............................................. 17
2.1.6 Other methods ................................................................................. 19
2.2 Review of empirical studies ..................................................................... 20
2.2.1 Impact of schooling and education levels to earning ...................... 20
2.2.2 Gender disparity on rate of return to education ............................... 21
2.2.3 Regional disparity on rate of return to education ............................ 22
2.2.4 Economic sector of employment disparity ...................................... 22
2.2.5 Impact of education on earnings Vietnam ....................................... 23
2.3 Chapter remarks ....................................................................................... 24
Chapter 3: Methodology and analysis framework
3.1 Model specification .................................................................................. 2 7
3.2 Definition of variables and measurement
3.2.1 Dependent variable ......................................................................... 29
3.2.2 Independent variable ....................................................................... 29
3.3 Data set and variable measurement.. ........................................................ 33
3.4 Steps to estimate parameter in regression model ..................................... 3 5
Chapter 4: Empirical analysis and research results and discussions
4.1 Overview of education on earning in Ben Tre province
v
.
------
4.1.1 Geographic ...................................................................................... 36
4.1.2 Educational level of workers .......................................................... 37
4.1.3 Human resource of Ben Tre province ............................................ 3 8
4.1.4 Labor force ..................................................................................... 39
4.1.5 Number of workers .......................................................................... 39
4.2 Descriptive analysis and hypothesis ........................................................ 39
4.2.1 Educational status and labor structure in Ben Tre province ............ 40
4.2.2 Others general information of workers ........................................... 41
4.3 Earnings of workers classified by categories
4.3.1 Earnings classified by education level ............................................ 41
·~
4.3.2 Earnings classified by gender .......................................................... 42
4.3.3 Earnings classified by regions ......................................................... 42
4.3.4 Earnings classified by sectors .......................................................... 42
4.4 Empirical results of effects of education on earnings
4.4.1 Estimation of rate of return with model 1 ....................................... 43
4.4.2 Estimation of rate of return with model 2 ....................................... 45
4.5 Chapter remarks ...................................................................................... 47
Chapter 5: Conclusions and policy recommendations
5.1 Main findings ........................................................................................... 49
5.2 Policy recommendations .......................................................................... 50
5.3 Limitations of the research and further study suggestions ...................... 52
REFERENCES .................................................................................................. 53
vi
APPENDICES
Appendix 4.1 Geographic of Ben Tre province, period 2004-2006 .................... 63
Appendix 4.2 Gini coefficients in the Mekong Delta .......................................... 63
Appendix 4.3 Region population of Ben Tre province, period 2005-2006 ......... 63
Appendix 4.4 Population structure of Ben Tre province, period 2004-2006 ...... 64
Appendix 4.5 Population density of Ben Tre province in 2005 in comparison with
other provinces of Mekong Delta ........................................................................ 64
Appendix 4.6 Working population and employment of Ben Tre province, period
2005-2006 .... ······································································································· 65
Appendix 4. 7 Frequencies classified by educationallevel.. ................................ 65
Appendix 4.8 Frequencies classified by sectors .................................................. 65
Appendix 4.9 Meaning of earnings classified by educational level.. .................. 65
Appendix 4.1 0 Meaning of earnings classified by gender .................................. 66
Appendix 4.11 Meaning of earnings classified by regions ................................. 67
Appendix 4.12 Meaning of earnings classified by sectors .................................. 67
Appendix 4.13 Estimation results of model 1 ..................................................... 67
Appendix 4.14 Estimation results ofmodel2 ..................................................... 68
Appendix 4.15 t-test year schooling and sectors ................................................. 68
Appendix 4.16 t-test experience and gender ....................................................... 69
Appendix 4.17 t-test year schooling and gender ................................................. 69
Appendix 4.18 t-test working time and sectors ................................................... 70
Appendix 4.19 t-test working time and regions .................................................. 70
vii
------------
Appendix 4.20 t-test working time and gender ................................................... 71
Appendix 4.21 t-test land cultivated size and regions ......................................... 71
Appendix 4.22 Oneway working time and educational level ............................. 72
•
viii
ABBREVIATION
BSO
Ben Tre Statistical Office
GDP
Gross Domestic Product
GSO
General Statistical Office
HCEF
Human Capital Earnings Function
OLS
Ordinary Least-Squared Estimation
ROR
Rate of return to education
VHLSS
Vietnam Household Living Standard Survey
VND
Vietnamese Dong
USD
United States Dollar
ix
LIST OF TABLES
Page
Table 2.1 Summarize the main results of the past studies ................................... 26
Table 3.1 Summary and defines dependent variable and all independent
variables ............................................................................................................. 32
Table 4.1 Means of per capita income classified by educational level ............... 41
Table 4.2 Means of per capita income classified by gender. ............................... 42
Table 4.3 Means of per capita income classified by regions ............................... 42
Table 4.4 Means of earnings per capita income classified by sectors ................. 43
Table 4.5 Estimation results of model 1 .............................................................. 43
Table 4.6 Estimation results ofmodel2 .............................................................. 46
Table 4. 7 Rate of return of earnings of each educationallevel ........................... 47
X
LIST OF FIGURES
Page
Figure 2.1 Effect of education on farm production ............................................... 8
Figure 2.2 Effect of year of schooling on earnings ............................................... 9
Figure 2.3 Stylized age-earnings profile of secondary and university
graduates ... ... ... ............. ............................................. .......................................... 15
Figure 2.4 Relationship between education and income level ............................ 16
Figure 4.1 The structure of educational level in Ben Tre province ..................... 40
xi
CHAPTER I
INTRODUCTION
1.1.
PROBLEM STATEMENT
Living standard level is different from everywhere, Knight and Sabot (1990) stated
that there was an inequality of income among households. In the rural areas, there is
a lot of households which are living in poor condition due to low income. Vietnam
is considered as one of the poor countries in the world. The average income level is
just about one dollar per head per day, and 20.0 percent of population living below
poverty line (GSO, 2006). Therefore, the improvement of income is very important,
especially for poor households to escape from present bad situation.
The benefits of formal education have been known for a long time. Mincer (1974)
showed that the benefits of formal education on individual earnings. Lucas (1988)
proved that benefits of education within a village known as the side effect.
Moreover, education can benefit the entire country at national level. In short,
education can benefit people from individual, household, local community, and
country level.
The positive relationship between education of a worker and his/her earnings and
productivity has been witnessed in many countries (Schultz, 1988). In addition,
educational attainment and earnings inequality still prevails between men and
women, rural and urban areas, and between the public and private sectors as well.
These issues require further understanding and examine the linkage between
education and earnings.
Ben Tre province, located at the downstream of the Mekong River's basin, is known
for agriculture-based society. This is one of the smallest inland area 2,315 squared
kilometres among Mekong Delta region, but its population density ranks at the
fourth place. GDP growth rate in 2001-2005 is of 9.22 percent. The income per
capita is of 4.5 million in 2001, 7.5 million in 2005, 8.5 million in 2006 and 950
USD in 2010.
In terms of education level, the literacy ratio of Ben Tre province's population is of
----------
97.4 percent (BSO, 2006). The labor force accounts for 72.73 percent of the
population (BSO, 2006). However, the quality of this labor force is poor in terms of
education and in terms of working skills. In 2006, 60 percent of the labor force is
unskilled labor. Only 30 percent of the workers get vocational certificates (BSO,
2006). Although there is high literacy (97.4 percent), the general education level of
population is still at low rate (52 percent) household heads under primary school. In
addition, the numbers of poor households accounted for 18 percent of the total
households in Ben Tre province and reduce to less than 10 percent in 2010 (BSO,
2006).
The opening of Rach Mieu's bridge in 2008, connecting Ben Tre province to other
provinces, and socio-economic conditions of human capital, and comparative
advantage to reduce the poverty rate and improve income of its people in Ben Tre
province. Thus, how to raise people's income is a big concern. While the benefit of
education has been generally demonstrated, the benefit of education to income is not
clearly explored. This socio-economic context inspired researcher to conduct a
study on the effects of education on earnings in Ben Tre province.
1.2.
OBJECTIVES OF THE THESIS
The purpose of this study is to analyze the effects of education on earnings of
workers, and to examine the rates of return to education levels. Especially, it also
takes into account the differences in returns to education by controlling wage
differences, geographical regions, economic sectors, and gender in order to draw
out policy implication for education development in Ben Tre province. To fulfill
these objectives, rates of return to education are used as an instrument to measure
educational effects on earnings. It is commonly recognized that higher education is
tantamount to higher earnings, or in another words earnings positively relate to
education. This research justifies the importance of the education level by
examining the effects of education on earnings in Ben Tre province by showing how
the change in each year of schooling corresponding with the change in earnings.
2
1.3 RESEARCH QUESTIONS AND HYPOTHESES
To match the above objectives, the research focuses on the following questions as:
•
Whether years of schooling effect on earnings or not?
•
Do education levels significantly determine earnings of wage earners?
•
Is earnings differential between experienced and inexperienced workers
significant?
•
Do public sector workers earn higher return in comparison with private sector?
•
Is there any gender and regional disparity in return to education?
In the context of significant market reform towards to more market-oriented
economy and with further educational and employment reforms, this research is
expected to find out factors affect the rates of return to education in 2006. The main
research hypotheses are to test whether there are positive effects of education on
earnings and rate of returns, classified in different levels of schooling in Ben Tre
provmce.
1.4 DATA AND METHODOLOGY
The main data set is drawn from VHLSS 2006. In addition secondary data are
collects from various sources including, academic textbooks, publications and
policy documents, General Statistic Office (GSO), Ben Tre province Statistic Office
(BSO), the World Bank, and Asia Development Bank. Both descriptive and
multivariate analysis is employed to answer the research questions. Data collected
from VHLSS 2006 replies on descriptive analysis on general information relating to
education in Ben Tre province, and the econometric analysis applied the OLS
method to examine the impact of education and earnings. This analytical approach
is popularity used in is the study of human capital earnings functions conducted by
Mincer (1974). The approach helps calculating the rates of return to year of general
schooling and to year of schooling at different levels of education.
Our sample is comprised of only the wage earners aged from 15 years to 60 years
and above whom having job as their primary and main activity during the past 7
days prior to the survey. As a result, the size of the sample is 143 observations in 8
3
districts and 24 communes. Data will be extracted by Stata software. Standard
statistical tests and estimation of the model parameters are done using SPSS and
Stata softwares.
1.5 ORGANIZATION OF THE RESEARCH
The thesis is divided into five chapters. The first chapter provides and overview of
the research and the research methods used. The second chapter presents for many
conceptual frameworks, theories and empirical studies will be reviewed. In that, first
section is definitions/concepts of factors effecting education and earnings; describes
the theoretical framework analyze education-earnings relation in next section; and a
review of empirical studies in education-earning relation and rate of return to
education is followed discussing similar issues in other countries. The third chapter
presents the specification model, which shows the determinants of education on
earnings. Data sources of the analysis will be introduced in this part. The chapter
four presents overview of economic reforms in Ben Tre province in 2006, and use
regression model to provide empirical support for testing the hypothesis. Finally, the
chapter five is for main findings from study, which to draw useful policy
implications, limitations of the research, and recommendations for further study in
Vietnam.
4
CHAPTER2
LITERATURE REVIEW
This chapter presents theoretical, analytical framework and related empirical studies
on the effect of education on earnings. The chapter begins with some key definitions
that are frequently used in theories. Then, the second section presents relevant
theories on the links of education and income, human capital, the Mincerian earning
function method, and others. The third section is to review empirical studies on the
relationship between education and earnings conducted in developing countries,
countries in transition, and Vietnam in particular. The final section is for chapter
remarks.
2.1 Theoretical framework
2.1.1 Key definitions
First, some key definitions on human capital and education are reviewed to bring
about the understanding of academic terms used through out the thesis. The pioneers
of the human capital theory include Becker (1967, 1989), Mincer (1974). They have
significantly affected the development of the literature on the economics of
education. The details human capital theory will present in this part.
2.1.1.1 Human capital: As defined by (Rosen, 1987:681 ), human capital refers to
"the productive capacities of human beings as income producing agents in the
economy". The building up of human capital can work through education and
training as well as through improvements in health and nutritional status. Education
and training provides knowledge and skills so as to enhance the efficiency at works;
better health and nutritional status assure greater physical strength, and thus ability
to provide more hours of labor.
The definition used by (Husz, 1998:9) is as follow: "By human capital we mean the
time, experience, knowledge and abilities of an individual household or a
generation, which can be used in the production process".
Gillis, et al (1996:256) broadly defined 'education' as all forms of human learning,
or more narrowly, is the process of learning in specialized institutions frequently
5
called 'school'. It is without a doubt that people can accumulate knowledge from
wherever they are: at home, at school, at a working place or on the job, and in the
community. Basically, there are three types of education that has drawn from the
channels that educational services come to people.
The first type is formal education, which implies the process of learning in
institutions and schools. It usually targets official school-age population who has not
yet started working for an income. Formal education normally includes primary,
secondary, and tertiary education. In Vietnam, secondary education is divided into
two stages. The first stage is called lower secondary education. At the second stage,
pupils can enter upper secondary education, technical secondary education, or
secondary vocational education. Primary and lower secondary education forms basic
education. Following secondary education is tertiary education, which includes
college, university education and higher (World Bank, 1996:9).
The second type is non-formal education, which involves an organized programmed
of learning which takes place outside of schools in the short period of time, often
providing occupational skills and application of knowledge rather than theoretical
subjects that pupils are taught in formal education.
The third type, (Gillis et a/, 1996:255) defines as "informal education is learning
that takes place outside any institutional framework or organized program. People
learn many important things at home, on the job, and in the community".
The definitions, therefore, are consistent with the traditional concept that
expenditure on education, training, medical care are investment in capital (Becker,
1993). Specifically in education sector, expenditure on education whether by the
state or the households have been treated as investment flows that build-up human
capital (Schultz, 1961 ).
2.1.1.2 Rate of return
The fundamental insight of human capital investment is the rate of return. Rate of
return refers to the compensatory nature of earnings on investment in human capital
(Eatwell eta/, 1991). A person who contemplates entering one of the occupations or
6
profession must look forward to a long period of training and costly investment
before any income is generated. Consequently, income must compensate for the cost
and effort required to practice this occupation or profession.
2.1.2 The link between education and farm productivity.
To point out the benefits of education in terms of earnings, several aspects of
schooling benefit will be mentioned. In that, education helps farmers adapt to
technical change, improving knowledge which lead to raise the farm household
income. In rural areas, education has an important influence on farm income. Thus,
we should focus on relationship between farm production and education as higher
productivity household will bring higher farm income. To examine the effect of
education on household income, we can examine the effect of education on farm
mcome.
Several theories has researched and proved that farmer education is more important
for modem agricultural practices than for traditional ones. As by Weir (1999:4)
"Increasing literacy and numeric may help farmers to acquire and understand
information and to calculate appropriate input quantities in a modernizing or rapidly
changing environment". Mellor (1976) showed that farmer education in rural areas
should be a key ingredient of any strategy and policy to improve agricultural
productivity, which will bring to raise total household income through higher farm
income. Especially, the education level of household head play great role in
efficiency. As Russian and Byerlee (1995), education brings about both monetary
and non-monetary benefits to individuals and to society as a whole. We know that
education provides skills and knowledge that can help to increase labor productivity
and income. Moreover, high education level will help farmers to apply and to use
technology efficiently, allocate resources more proficiently and increase farm
productivity. These effects can be illustrated by the following figure 2.1.
7
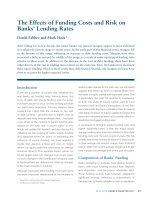
Figure 2.1: Effects of education on farm production.
Output Y
Y=ftXz)
I
~~~~=~----=~~r=====Y:=ftXt)
B
•
Input X
Source: Hussain and Byerlee (1995)
Those farmers endowed with less knowledge on technical and allocative efficiency
started at point B. If they have knowledge about technical the efficient point will
move from B to T, and afterwards shift to A which represents the allocative
efficiency, and further move to the higher production frontier, at point I as a result
of applying new technology and attain higher output and profit.
From the above theory, it is seen that the education level affects strongly to
technical efficiency and productivity. The raises in technical efficiency and
productivity help to increase the farm output and income of farmers. In summary,
higher education will lead to higher farm income.
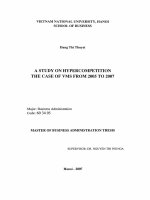
2.1.3 The relationship between education and income.
In literature, the positive relationship between education level and income are well
documented. This relation is presented in the below diagram (Knight and Sabot,
1990). The figure 2.2 shows the relationship between earnings, years of education,
personal ability, and human capital.
8
Figure 2.2: Effects of Years of Schooling on Earnings
Human capital
acquired in school
Years of education
Ability
Source: Knight and Sabot (1990)
The diagram shows six links between elements in which the link B is the most
important for representing the influence of years of education on earnings; and this
link causes directly effect to earnings. Years of education also have other two direct
effect on earnings through link F and link A, where F represents the human capital
acquired in school. The different value of human capital leads to the results of
different earnings. Thus, years of education have actually positive effects on
earnings. The effect of personal ability on earnings can be directed by link C, or/and
undirected by link E where personal ability correlated with years of education. Link
D shows the effect of A on human capital through cognitive skill. In sum, we can
conclude that education can effect to income direct in wage sector and indirect
through technical efficiency to raise productivity as well as the relationship between
income and formal education is positive.
9
2.1.4 The theory of human capital
This theory presents the effect of human capital on earning, employment and other
economic variables which can be extended to explain the effects of other kinds of
investment in human being especially schooling and education.
The treatment of education as a form of investment that could increase the
productive capacity of manpower was first considered by Smith (1776), a Classical
economist, in his great book "The Wealth of Nations". However, it was since 1960s
and due to the significant contributions of Schultz (1961), Becker (1962) and
Mincer (1974) that the concept of human capital and the human capital theory have
been formally analyzed and developed.
Education plays an important role in improving the quality of human resource
(Gillis et a!, 1996). It helps people to get better job opportunities, improve health
and reduce fertility.
Knight and Sabot (1987) argue that persons who have a high number of schooling
years will get more cognitive skills than the others. This cognitive is a crucial
element in engaging the labor market with a hope of better-paid wages.
Evans ( 1991) states that educated persons can be successful in both their business
and job finding than the others who has less or non education. This means those
households who obtain higher education will both succeed in self-employment
activities or in wage and salary activities.
According to Schultz (1993) well-educated people are easier to get better jobs than
ill-educated ones. An educated person commonly has a good background of
knowledge, when learn something; he/she can easily understand and obtain issue
quicker than the non-educated person can.
In order to find out clearly about rate of return to education based on the analysis of
investment in human capital written by Becker ( 1993) and Gillis et a! ( 1996) which
have general method to measuring the cost, the benefit of the education and the rate
of return to schooling. According to Gillis eta!. (1996:263), the net present value of
lifetime incremental benefits of university education is measured as:
10
m-1
PVE =
I
(1:~)'
[2.1]
1=0
where, PVE is the discounted present value of incremental benefits of the
investment in university education; E1 is the incremental benefits a university
graduate can get. As we consider monetary benefits only; E1 is a earnings (after-tax)
of a university graduate over the earnings of a secondary graduate at year t (E1 also
refers to the incremental earnings a university graduate obtains during his/her
learning time at university); m is the number of years of the working life of a
secondary graduate plus the learning time at university. In this particular case, m is
47 (m = 65- 18); r is the discount rate; and tis indices.
It is here assumed that the individuals choose the educational level that maximizes
his utility. And, both secondary and university graduates enter the labor market
immediately after the graduation. The discount rate is constant over the whole
his/her working life. The individual knows in advance the age-earnings profiles
associated with different levels of education.
The net present value of the costs of university education is defined as
n-1
PViC -- ""'
L..J
c,
[2.2]
(1+r) 1
t=O
where, PVC is the discounted present value of the cost of the investment m
university education; C1 is his/her educational costs at year t (explicit and implicit
costs); n is the number of years of learning at the university level (n
=
4, in this
case); r is discount rate; and t is indices.
The private rate of return to university education is, thus, the discount rate that
equates the discounted present value of lifetime incremental earnings of a university
graduate and the discounted present value of costs of university education so as the
net present value of the investment equals zero. Therefore, the equation to estimate
the rate of return to schooling is
m-1
""' _E_, _
L..J (1+r) 1
n-1
""'
t=O
t=O
L..J
_c_, _ 0
(l+r)
1
[2.3]
-
11
Where r is the discount rate, which also is the internal rate of return to the
investment in university education. The estimated rate of return is now ready to be
compared with the rates of return of other forms of investments the individual might
make. If it is higher, it is worth for him or her making the investment in university
education.
The benefit of an educational investment is measured as the average additional
earnings received by (for example) the graduates of secondary school, over and
above the graduates of primary school. The cost of the investment comprises direct
and indirect costs. The direct costs for the individual include all expenditures related
to school attendance, and for society, the full resource costs of providing the
educational service, including any subsidized costs not borne by the individual or
the individual's family. The indirect costs are the average earnings foregone as a
result of the investment.
This method, while straightforward and requiring fewer 'as if assumptions than
other, more elegant methods used to estimate rates of return to educational
investments, is data demanding. One must have sufficient numbers of observations
in all age-education level cells to be able to construct well-behaved age-earnings
profiles (that is, profiles that are non-crossing and concave to the horizontal axis).
The private rates of return to other levels of education such as secondary and
primary education can be calculated in the same way. However, calculating the
private rate of return to primary education is a different from calculating the private
rates of return to other levels of education. We know that children of primary
education are mainly of ages from 6 to 12. As most of these children are not
qualified to participate in the labor market, their opportunity costs of learning are
zero. In other words, they do not forego earnings for all their school time. However,
from the fact that many children of 11 or 12 years old helped in agricultural works
in developing countries, two or three years of foregone earnings have often been
taken into account in measuring the private rate of return to primary education
(Psacharopoulos, 1995:4).
12
The estimation of the social rate of return to schooling uses resource costs and
benefits to society as a whole. The social rate of return to schooling can be used to
set investment priorities for future educational investments.
2.1.4.1 Measuring the costs of education
Economic analysis of investment in education tries to measure the total cost
including opportunity cost rather than the simply monetary expenditures on
schooling. Regarding private rate of return to education investment, from the point
of view of individual students or families, opportunity costs of pupils or students
need taking into account. One of the most important resources devoted to education
is the time of student. The wages and salaries that students must forgo in order to
enroll in education often represent a large part of private cost to education. Another
major part of the private cost that is often regarded as direct cost includes tuition
fees and expenditure on book in general.
2.1.4.2 Measuring the benefits of education
Education brings about both monetary and non-monetary benefits to individuals and
to society as a whole. We know that education provides skills and knowledge that
can help to increase labor productivity and income. This is monetary benefit of
education. According to Haveman and Wolfe (1984), private non-monetary benefits
of education can include: i) Better health for learners themselves and their family.
The World Bank has showed that "child mortality declines and nutritional status
rises with increased parental education, contributing greatly to children's welfare
and development" (World Bank, 1980). ii) Better household management.
Knowledge, ideas and skills obtained through education allow individuals to make
choices concerning consumption, fertility and family size more efficiently. iii)
Higher productivity in knowledge production. According to Haveman and Wolfe
'
(1984:382), there is evidence that "schooling increases the productivity in the
production of additional human capital". iv) Education brings us more enjoyments
of life as music, art.
13