The Effects of Funding Costs and Risk on Banks’ Lending Rates pot
Bạn đang xem bản rút gọn của tài liệu. Xem và tải ngay bản đầy đủ của tài liệu tại đây (225.6 KB, 8 trang )
35BULLETIN | march quarter 2011
The Effects of Funding Costs and Risk on
Banks’ Lending Rates
Introduction
There are a number of factors that influence the
way banks set lending rates. Among these, the
costs of debt and equity funding and the losses
that banks expect to incur on their lending activities
are particularly important. Previous Reserve Bank
research has noted that the increase in the cost
of debt funding – primarily due to higher costs of
deposits and long-term wholesale debt – has been
a key driver of the increase in banks’ lending rates
relative to the cash rate in recent years.
1
In this
article, we update this research and also discuss the
influence on loan pricing of banks’ equity funding
and expected losses on loans. In estimating the
influence of equity funding, we have applied a
model that assumes a fixed unit cost, or ‘target
return’, for equity (with the cost based on average
historical returns). This assumes banks’ return on
equity targets have not changed over recent years.
As such, changes in the contribution of equity costs
in funding loans are determined solely by changes
in the share of equity in funding.
Although increased debt funding costs have been
the most important determinant of the increase in
1 See Brown et al (2010) for details.
lending rates relative to the cash rate, our estimates
suggest that there has been a material effect from
increases in equity capital and expected losses. This
is particularly the case for lending to businesses,
as both the share of equity capital used to fund
business loans and banks’ perceptions of the risks
associated with this form of lending have increased
noticeably. Increases in equity capital and expected
losses are estimated to have had a smaller effect on
residential mortgage lending rates.
A consequence of higher equity funding costs and
higher expected losses is that the major banks’
average lending rates have risen relative to their debt
funding costs over the past couple of years. This has
contributed to the increase of around 15 basis points
in their average net interest margin from historical
lows in 2008. The current average margin of 2.35 per
cent is around its average level of the past fiveyears.
Composition of Banks’ Funding
Banks operating in Australia have diverse funding
bases, with most funding sourced from deposits
and short-term and long-term wholesale debt.
These funding sources have, however, undergone
significant change, reflecting a reassessment of
funding risks by banks globally as well as regulatory
Daniel Fabbro and Mark Hack*
After falling for over a decade, the major banks’ net interest margins appear to have stabilised
in a relatively narrow range in recent years. In the early part of the nancial crisis, margins fell
to the bottom of this range, reecting an increase in debt funding costs. Margins have since
recovered a little, to around the middle of the range, as a result of some repricing of lending rates
relative to these costs. In addition to the increase in the cost of debt funding, there have been
other drivers of the rise in lending rates relative to the cash rate. First, the banks have increased
their equity funding, which is more costly than debt nance. Second, risk margins on loans have
risen to account for higher expected losses.
* The authors are from Domestic Markets Department.
RESERVE BANK OF AUSTRALIA36
THE EFFECTS OF FUNDING COSTS AND RISK ON BANKS’ LENDING RATES
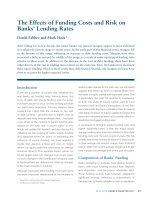
and market pressures. In particular, banks in Australia
have increased their use of deposits (particularly
term deposits) and long-term debt, as these funding
sources are perceived to be relatively stable (Graph 1).
The increases in deposit and long-term debt funding
have facilitated a decline in the share of funding
sourced from short-term wholesale debt (domestic
and foreign). The share of securitisation has also
fallen since the onset of the financial crisis, as the
amortisation of the outstanding stock of residential
mortgage-backed securities (RMBS) has exceeded
new issuance.
Furthermore, Australian banks have bolstered
their balance sheets by raising equity, through
a combination of retained earnings and share
placements. This has led to an increase of nearly
1 percentage point, to 7½ per cent, in the share of
equity in the major banks’ funding liabilities since
mi d 2007.
2
2 For more details on banks’ capital, see Gorajek and Turner (2010).
Cost of Debt Funding
Australian banks’ cost of debt funding has
increased materially over the past few years. This
has reflected both increases in the costs of some of
the components of debt funding as well as the shift
towards more expensive sources of debt.
Deposits
Competition for deposits in Australia has intensified
since around mid 2008, resulting in a significant
increase in deposit rates relative to market
benchmark rates. The average cost of the major
banks’ new deposits has risen noticeably relative
to the cash rate; currently it is estimated to be only
slightly below the cash rate, whereas prior to the
onset of the financial crisis, it was about 150 basis
points below the cash rate.
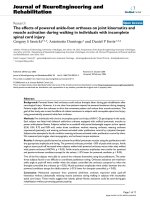
Within the deposit market, competition has been
most pronounced for term deposits. The average
spread above market rates of equivalent maturity
on banks’ term deposit ‘specials’ – the most relevant
rate for term deposit pricing – has increased by
around 150basis points since the onset of the crisis
(Graph 2). This average spread is currently a little
below 100 basis points. For example, 6-month
term deposit rates are currently around 6 per cent,
compared to bank bill rates of about 5 per cent. Rates
Graph 1
Graph 2
0
25
50
0
25
50
25
50
25
50
Funding Composition of Banks in Australia*
Per cent of funding
*Foreign liabilities are adjusted for movements in exchange rates
** Data for Suncorp are prior to recent restructure
*** Includes deposits and intragroup funding from non-residents
Sources: APRA; RBA
Deposits
Major banks
%
Regional banks**
Foreign banks
25
50
25
50
%
%%
%%
ST debt***
LT debt Securitisation Equity
Loans
January 2011 June 2007
-200
-100
0
100
-200
-100
0
100
Major Banks’ Deposit Rates
Spreads over money market rates of equivalent maturity
Term deposit ‘specials’*
Bp
sB
ps
At-call deposits**
2007 2008 2010 20112009
*Spreads to bank bill and swap rates
** Spread to cash rate. Existing customers only. Excludes temporary
bonus rates.
Sources: Bloomberg; RBA
BULLETIN | march quarter 2011 37
THE EFFECTS OF FUNDING COSTS AND RISK ON BANKS’ LENDING RATES
on new issuance remain steady, this would imply an
increase in total funding costs from this source of just
under 5basis points over the next year.
The regional banks, which have lower credit ratings
than the major banks, have experienced an even
larger increase in the cost of long-term wholesale
debt, though it is a smaller share of their total
funding.
Short-term wholesale debt accounts for about
one-fifth of banks’ funding, and is priced mainly off
1-month and 3-month bank bill rates. Prior to mid
2007, bank bill rates closely tracked the market’s
expectation for the cash rate with the spread
between 3-month bank bills and overnight indexed
swaps (OIS) around 10basis points. While the onset
of the global financial crisis saw bank bill rates rise
well above OIS rates, the sizeable risk premium has
now largely dissipated. Hence, the major banks’
short-term capital market debt is currently only
about 10 basis points more costly relative to the
expected cash rate than it was in mid 2007.
RMBS account for a negligible share of the major
banks’ funding, but are more important for the
smaller financial institutions. The cost of new
securitisation funding is roughly 100 basis points
higher than before the onset of the global financial
on at-call savings deposits – including bonus saver,
cash management and online savings accounts –
are currently estimated to be around 35basis points
below the cash rate compared with 100basis points
below in mid 2007. Overall, the average deposit cost
for the regional banks is likely to have increased by
slightly more than for the major banks, reflecting
the regional banks’ greater use of (relatively more
expensive) term deposits.
Wholesale debt
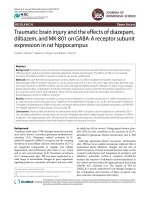
The cost of issuing long-term bonds increased
significantly during the crisis.
3
For example, yields
on 3-year bonds increased from around 50 basis
points over Commonwealth Government Securities
(CGS) in the years leading up to the crisis, to a peak
in late 2008 of about 220basis points for debt issued
in Australia and at about 280 basis points for debt
issued offshore (Graph 3). Improved capital market
conditions have seen the cost of issuing new 3-year
debt onshore fall to a little over 100 basis points
recently. However, this decline in the cost has been
offset to some extent as the major banks have
lengthened the average maturity of their bond
funding by issuing at longer tenors. Issuance over
the past year has been at an average tenor of just
over 4½ years, compared with 3years in 2008.
Reflecting these developments, there has been a
marked increase in long-term wholesale funding
costs, with these costs estimated to have risen
by about 110 basis points relative to the market’s
expectation of the cash rate. The cost of long-term
wholesale debt continues to place upward pressure
on banks’ funding costs, as still nearly one-fifth of
bonds outstanding were issued at lower spreads
prior to mid 2008. As the repricing of maturing bonds
continues, it is estimated that the average spread on
banks’ outstanding long-term debt will increase by
about 15basis points over the next year. If the share
of long-term debt in overall funding were to remain
at its current share of around 25 per cent, and spreads
3 See Brown et al (2010) and RBA (2010).
Graph 3
0
50
100
150
200
250
0
50
100
150
200
250
Major Banks’ Wholesale Funding Spreads
A$ debt; spreads to OIS and CGS
Sources: Bloomberg; RBA; Tullet Prebon; UBS AG, Australia Branch
Crisis (peak)
Bp
sB
ps
Maturity
Pre-crisis
Current
1m 1yr3m 6m 5yr 7yr 10yr2yr 3yr 4yr
RESERVE BANK OF AUSTRALIA38
THE EFFECTS OF FUNDING COSTS AND RISK ON BANKS’ LENDING RATES
pre-crisis are rolled over at higher spreads, together
with a small increase in the cost of term deposits,
has been broadly offset by a decline in the spread to
the cash rate on funding sources that have relatively
fixed rates.
The available evidence suggests that the overall
increase in the regional banks’ debt funding costs
since the onset of the financial crisis has been
larger than that experienced by the major banks.
This mainly reflects the larger rises in the costs of
the regional banks’ deposits and wholesale debt
funding, and the large switch in their funding mix
from securitisation to deposits, currently a relatively
expensive source of funding.
Cost of Equity Capital
While equity is a non-interest bearing source of
funds, banks aim to earn a return on this capital.
4
The cost of equity reflects the bank’s total amount
of equity funding and the return the bank seeks
on this funding source. In our calculations the
target return on equity is assumed to be constant
at a historical average pre-tax rate of 20 per cent,
and does not vary as the share of equity in funding
changes. Furthermore, different types of loans will
have different amounts of equity allocated to them
determined by their riskiness. Given equity is a more
expensive source of funds than debt, variation in the
share of equity used to fund different types of loans
will be one factor leading to different lending rates.
For example, the higher level of risk associated with
business lending than with residential mortgage
lending means a greater share of equity capital
needs to be set aside to fund these loans. As such,
equity capital contributes more to the cost of
funding business loans than residential mortgages
(Graph 5).
4 While banks do not typically disclose the equity return targets that are
used in their loan pricing decisions, the cost of equity is greater than
that of debt. This reflects the greater risk borne by shareholders (who
only have a residual claim on the income and assets of the bank).
crisis. Given spreads on RMBS are similar for the
different types of banks (and also for non-banks),
securitisation has remained a relatively more cost
effective funding source for the smaller banks.
Overall cost of debt funding
Since mid 2007, the higher cost of deposits has
made the largest contribution to the overall
increase in debt funding costs, reflecting their
large weight in total funding and the 130 basis
point rise in average deposit rates relative to the
cash rate. Long-term wholesale debt has also
made a substantial contribution to the increase
in the major banks’ debt funding costs. While the
cost of short-term wholesale debt initially rose
relative to the cash rate, it is now much closer to
pre-crisis levels. In aggregate, it is estimated that
the average cost of the major banks’ debt funding
is about 90 to 100 basis points higher relative to the
cash rate, than it was in mid 2007 (Graph 4).
Most of the increase in the major banks’ debt
funding costs occurred during 2008 and early 2009,
at the peak of the dislocation in markets. Since then
the major banks’ debt funding costs are estimated
to have moved broadly in line with the cash rate,
reflecting offsetting factors. The continued upward
pressure on long-term funding, as bonds issued
llll
-0.5
0.0
0.5
1.0
1.5
llll
-0.5
0.0
0.5
1.0
1.5
0.0
0.5
1.0
1.5
0.0
0.5
1.0
1.5
Major Banks’ Average Debt Funding Costs*
Cumulative change in spreads to the cash rate since June 2007
*RBA estimates
** Weighted-average spread to cash rate and CGS for long-term variable
rate and fixed-rate debt, respectively. Includes foreign currency hedging
costs.
Sources: Bloomberg; RBA; UBS AG, Australia Branch
Deposits
(excluding CDs)
%
Total
%
%%
Long-term debt**
2009
Short-term debt
(including CDs)
2009 20112011
Graph 4
BULLETIN | march quarter 2011 39
THE EFFECTS OF FUNDING COSTS AND RISK ON BANKS’ LENDING RATES
Graph 5
The following analysis focuses on two broad
categories of lending for which it is possible to
compare interest rates and credit risk (or expected
loss) information under the current capital standards
(referred to as Basel II).
6
The two categories are:
• residential mortgage lending (predominantly
loans to households, but also includes
residentially secured loans under $1 million to
small businesses); and
• all other business lending.
Residential mortgage lending
In the decade prior to the crisis, indicator rates on
banks’ residential mortgage lending tended to
move closely with the cash rate. This reflected that
banks’ debt funding costs also generally followed
movements in the cash rate, in conjunction with
little change in equity capital or expected losses.
In addition, competitive pressures meant that it
became commonplace for lenders to offer most
household borrowers a discount, which gradually
increased to around 60 to 70 basis points on the
indicator rate (Graph 6).
Banks also typically reduced risk margins on
residentially secured lending to small businesses
in the lead-up to the crisis. This reduction in risk
margins, combined with an increase in the use
of residential property as security (i.e. reduced
unsecured lending), contributed to the overall
reduction in average risk margins on the stock of
small business lending.
Since mid 2007, the major banks’ average interest
rates on housing loans and residentially secured
small business loans have each risen relative to the
cash rate. Overall, it is estimated that the increase
in the major banks’ interest rates on residential
mortgage lending, which is heavily weighted
towards housing loans, has been about 120 basis
points relative to the cash rate. Only a small part of
6 The expected loss information reported by the major banks is based
on the probability that borrowers will default, and the amount that
the banks expect to lose in the event of default.
Based on our assumptions noted above, as well as
the increase in credit risk (measured using the major
banks’ reported risk weights), there has been an
increase in the contribution of equity to total funding
costs, especially for business loans. For residential
mortgage lending, it is estimated that about 2 per
cent of the value of these loans is now funded from
equity, up from around 1½ per cent in early 2008.
This would have increased the equity cost of funding
these loans by as much as 10 basis points, from
around 30 basis points to just over 40 basis points.
5
In comparison, equity funding for business loans is
estimated to have risen from about 6 per cent to
8 per cent of the value of these loans. As a result,
this would have increased the equity cost of funding
business loans by as much as 40 basis points, from
around 120 basis points to 160 basis points.
Banks’ Lending Rates and Pricing
for Risk
In addition to the costs of debt and equity funding,
lending rates include a risk margin designed to cover
the expected losses from making that particular
type of loan.
5 The equity cost of funding a loan is calculated by multiplying the
share of equity used to fund the loan (e.g. currently 2 per cent for
residential mortgages) by the target return on equity, which is
assumed to be 20 per cent.
Equity Funding Costs
20
30
40
50
100
120
140
160
*Includes small business loans less than $1 million secured by residential
property
Sources: APRA; RBA
2010
Bps
Business loans
Residential mortgages*
2008 200920102008 2009
Bps
Contribution to total funding costs; by loan type
RESERVE BANK OF AUSTRALIA40
THE EFFECTS OF FUNDING COSTS AND RISK ON BANKS’ LENDING RATES
is estimated to have risen by about 120 basis points
relative to the cash rate since mid 2007.
For business lending, debt funding costs have also
been the largest individual driver of the increase in
lending rates relative to the cash rate, though there
have also been significant contributions from the
cost of equity and from higher risk margins to cover
expected losses. The expected loss rate reported by
the major banks has increased from around 45basis
points to about 75 basis points. This has been
mainly due to the banks’ perceptions of a higher
chance of default across borrowers, and implies an
increase in risk margins of around 30 basis points.
The significantly larger increase in the expected
loss rate for business lending (relative to residential
mortgage lending) appears broadly consistent with
developments in actual loss rates experienced by
the major banks.
this increase appears to reflect an increase in risk
margins to account for higher expected losses, as
the major banks reported that the expected loss rate
for this type of lending rose by only about 5basis
points from March 2008 to a peak in March 2010.
The major factor behind the increase in residential
mortgage lending rates relative to the cash rate
has been the increase in debt funding costs, with a
modest contribution of about 10 basis points from
the cost of equity funding.
Business lending
There can be considerable variation in interest rates
across business loans, as banks base their pricing
on the characteristics of the individual borrower
and the quality of collateral (such as commercial
property or equipment). The available evidence
suggests that the average spread to the cash rate
on new term loans to large businesses increased by
about 200basis points, from around 150basis points
in mid 2007 to a peak of around 350basis points in
mid 2009. Since then, spreads on new loans have
declined, and are now closer to the average margin
on existing loans. As such, the average margin on
outstanding business lending facilities appears
to have broadly stabilised (Graph 7). Overall, the
average interest rate on outstanding business loans
Graph 6
Spread to cash rate
Residentially Secured Variable
Lending Rates
Sources: ABS; APRA; Perpetual; RBA
2011
Indicator rate
Housing
Bps
150
300
450
150
300
450
0
200
400
600
0
200
400
600
Small business
Bps
Bps
Bps
2007200319991995
Average outstanding rate
Graph 7
1
2
3
4
5
1
2
3
4
5
Variable Rates on Outstanding
Business Loans
Spread to cash rate
%
Sources: APRA; RBA
%
2002 2006 20101998
Lending rates and net interest margins
Australian banks’ net interest margins are largely
driven by movements in interest rates on loans
relative to debt funding costs. There is also an
influence from other asset holdings, such as
holdings of liquid assets, and other factors, such as
net interest earnings from interest rate derivatives.
An additional factor that influences the calculation
BULLETIN | march quarter 2011 41
THE EFFECTS OF FUNDING COSTS AND RISK ON BANKS’ LENDING RATES
References
Brown A, M Davies, D Fabbro and T Hanrick (2010),
‘Recent Developments in Banks’ Funding Costs and
Lending Rates’, RBA Bulletin, March, pp 35–44.
Gorajek A and G Turner (2010), ‘Australian Bank Capital
and the Regulatory Framework’, RBA Bulletin, September,
pp 43–50.
RBA (Reserve Bank of Australia) (2010), ‘Submission to
the Inquiry into Competition in the Australian Banking
Sector’, Submission to the Senate Economics References
Committee Inquiry into Competition in the Australian
Banking Sector, 30 November. Available at: <http://www.
rba.gov.au/publications/submissions/inquiry-comp-aus-
ba nk- se ct-1110. pd f>.
of banks’ margins is the amount of equity in funding,
which is treated as having zero interest cost (i.e. non
interest-bearing). However, as noted above, for the
purposes of loan pricing, banks apply a cost to these
funds.
While the net interest margins of the individual
major banks differ, the average margin for these
banks has fluctuated within a fairly narrow range
between about 2¼per cent and 2½per cent over
the past fewyears (Graph 8). After falling to historical
lows in 2008 as funding costs rose early in the global
financial crisis, the major banks’ margins recovered
a little, as lending rates increased by a little more
than debt funding costs. Currently they are around
the average level of the past five years. The above
analysis broadly demonstrates that some of the
increase in lending rates relative to debt funding
costs can be explained by the banks passing on the
higher costs of equity capital and the increase in
expected losses. Consequently, some of the increase
in the major banks’ margins from their recent lows is
also largely a reflection of these factors.
The regional banks’ net interest margins lie below
the major banks’ margins, primarily reflecting more
expensive deposit and long-term wholesale debt
funding costs and a greater share of lower margin
household lending. In contrast to the major banks,
the regional banks’ margins remain below their
level in mid 2007. This reflects the regional banks’
overall funding costs having risen by more than the
major banks, and their overall lending rates having
risen by a little less, reflecting differences in their
lendingmix.
R
1.0
1.5
2.0
2.5
3.0
1.0
1.5
2.0
2.5
3.0
1.0
1.5
2.0
2.5
3.0
1.0
1.5
2.0
2.5
3.0
Banks’ Net Interest Margin*
*From 2006 data are on an IFRS basis; prior years are on an AGAAP basis
Sources: RBA; banks' financial reports
2010
%%
2008
2006
20042002
Major banks
Regional banks
Domestic operations, half-yearly
Graph 8
RESERVE BANK OF AUSTRALIA42