ẢNH HƯỞNG của DÒNG TIỀN, rủi RO hệ THỐNG, rủi RO PHI hệ THỐNG và TÍNH THANH KHOẢN CHỨNG KHOÁN đến đầu tư của các DOANH NGHIỆP VIỆT NAM astract
Bạn đang xem bản rút gọn của tài liệu. Xem và tải ngay bản đầy đủ của tài liệu tại đây (1.22 MB, 26 trang )
1
PHD SYNOPSIS THESIS:
THE EFFECTS OF CASH FLOW, SYSTEMATIC RISK
IDIOSYNCRATIC RISK, AND STOCK LIQUIDITY ON
FIRMS’ INVESTMENT DECISIONS IN VIET NAM
Koontz and Weihrich (2010) said that, the decision is a
process of selecting one of the actions given. The decision is the core
of a plan and a plan can not be said to exist unless there is a decision.
In corporate finance, there are many decisions such as investment
decisions, financing decisions, production decisions ... Among those
decisions, investment decisions is one of the important decisions,
because it is closely linked with the financing plan, production plan,
plans to buy raw materials .... Because of important features of
investment decisions, it has attracted many studies which analyse the
effect of financial factors on investment. Up to now, a wide range of
theoretical foundation of research study about the relationship
between investment and financial factors. Studies have indicated
some financial factors affecting on investment decisions, such as the
effect of internal cash flow on investment, uncertainty on investment.
However, not many studies have shown the relationship between
firm investment and stock liquidity. Therefore, I summarizes the
empirical study about the impact of internal cash flow, systematic
risk, idiosyncratic risk and stock liquidity to firm investment and
introduce related theoretical background to explain the link of this
research . From the empirical results, I found research gaps in these
study to guide research for my PhD thesis.
2
CHAPTER 1: LITERATURE REVIEW
1.1.
The research related to cash flow and investment:
- For full data, cash flow is positively related to firm investment
(Fazzari et al., 1988; Kaplan and Zingales, 1997; Bhagat et al.,
2005; Bloom et al., 2007; Firth et al., 2012…). However, the
effect of cashflow on investment of financially distressed firms is
ambiguous: some research suggest a positive relationship between
cash flow and investment, others suggest a negative relationship
(Bhagat et al., 2005; Almeida and Campello, 2007; Cleary et al.,
2007).
- The excess investment-cash flow sensitivity to financing
constraints, there are two conflicting conclusions. At the one
hand, firm as most financially constrained, investment is more
sensitivities to cash flow than firms as less financially constrained
(Fazzari et al., 1988; Hoshi et al., 1991; Alti, 2003; Bhagat et al.,
2005…). At the other hand, firms as that appear less financially
constrained exhibit signicantly greater sensitivities than firms that
appear more financially constrained (Kaplan and Zingales, 1997;
Cleary, 1999; Moyen, 2004; Hovakimian and Titman, 2006;
Cleary et al., 2007… ). Levels of investment-cash flow sensitivity
are different from each other, and depend on respect that proxy
for financial constraints.
- The effect of cash flow on investment of government controlled
firms versus privately controlled companies was found in studies
in China. These studies provide evidence that government
controlled listed firms have greater investment–cash flow
sensitivities than do privately controlled listed companies (Firth et
al., 2012). It is explained that besides profit targets, government
3
controlled firms have to achieve multiple socio-economic
objectives of the Government. Moreover, the agency cost of stateowned firms is higher than that of non state-owned firms (Huang
et al., 2011), state-owned firms are more willing to invest in
accordance with policies (Wang và cộng sự, 2014)
1.2.
The research related to uncertainty and investment:
- The sign of the effect of uncertainty on investment depend on
respect that proxy for uncertainty. However, the negative effects
of uncertainty on investment was found more than positive effects
from empirical researchs, especially in the real options theory
(Leahy and Whited, 1996; Catherine Pattillo, 1998; Guiso and
Parigi, 1999; Bond and Cummins, 2004; Bulan, 2005; Bloom et
al., 2007; Panousi and Papanikolaou, 2012…).
- Stulz (1999), Ghosal and Loungani (2000), Panousi and
Papanikolaou (2012), Koetse et al., (2006) found that, there is a
difference between the sign and the level of the effect of
uncertainty on investment of financially constrained firms. This
difference can arise from respect that proxy for financial
constraints or uncertainty and financial characteristics of firm.
- Xu et al., (2010), Wang et al., (2014), argued that the effect of
uncertainty on investment of government controlled firms and
privately controlled companies are difference between the sign
and level.
1.3.
The research related to stock liquidity and investment::
- Becker-Blease and Paul (2006), Muñoz Francisco (2013)
concluded that, there are a positive relationship between liquidity
and investment, because firms with higher liquidity can take
4
advantage of external financing. When financing of investment is
conditional on the rise, investment will increase.
- Muñoz Francisco (2013) found that, positive effect is greater for
firms with bigger financial constraints. This is consistent with the
fact that increasing liquidity can encourage investment, as it
improves the conditions for external financing.
- When it comes to the effect of stock liquidity on investment of
government controlled firms, I have not found empirical evidence
before. However, related studies such as the study of Firth, Lin
and Wong (2008), Lesmond et al., (2008), Lipson and Mortal
(2009), Muñoz (2013) take me expect that investment of
government controlled firms will be less sensitivities to cash flow
than investment of private controlled firms.
CHAPTER 2: RESEARCH METHODS.
2.1. Research models
Dependent variable (I/K): is defined as investment (I) in net fixed
assets (K) in year.
Main independent variable:
-
Internal cash flow ratio (CF/K): Internal cash flow is
estimated as
net profit plus depreciation. From the results of
previous empirical studies, I expect regression coefficient of CF/K to
be significantly positive.
- Systematic risk (Sysrisk): is estimated the following CAPM
model
(Ri,t - Rf,t)= β0 + β*(Rm,t – Rf,t)+ εit
- Idiosyncratic risk (Idiorisk):
deviation of the residuals from (1) model.
Idiorisk = √𝑉𝑎𝑟(𝜀𝑖,𝑡 )
(1)
is defined as the standard
5
- Stock liquidity (Liquid): is defined as
∑𝑄
Traded Shares𝑡
𝐿𝑖𝑞𝑢𝑖𝑑 = 𝑡=1
𝐷𝑄 ∗ Total Shares
The estimation period is one year. I predict that the effect of
stock liquidity on investment is positive.
Control variables:
- Q: is measured as the sum of market value of tradable shares,
book value of nontradable shares, and liabilities, divided by book
value of total assets. Basing on empirical studies, I expect regression
coefficient of Q to be significantly positive.
- Lev: is the ratio of total liabilities to total assets. Data which
I am studying, has overinvestment firms more than underinvestment
firms, hence I expect the positive regression coefficient when
estimating model.
- Sale: The proportion of change in sales from year t to year
t−1. I predict the effect of sale on investment is positive.
- Size: The natural logarithm of beginning book total assets. I
expect a positive relation between size with firm investment.
- Return: is the stock price return of a firm. The estimation
period is one year. Return is measured as the difference between the
closing price and opening price at day t, divided by opening price. I
expect a positive relation between Return with firm investment.
- Age: The natural logarithm of the number of years since
establishment of stock company. I expect a negative relation between
Age with firm investment.
6
Dummy variables and interactive variables
-
DumGov: Dummy variable, coded 1 for firm-years that have
a government institution as the controlling shareholder and 0
otherwise.
-
RateGov: The proportion of shares owned by state
shareholders
-
Interactive
variables
as
CFDumGov,
SysDumGov,
IdioDumGov, LiquidDumGov, CFRateGov, SysDumGov,
IdioRateGov, LiquidRateGov.
2.2. Financial constraint Firms
2.2.1. Choosing representatives to determine the financially
constraint firms
Due to financially constraints are not directly measurable, it is
represented by many different factors. It can be represented by a
factor or a composite index, but that proxy must reflect the ability to
access external finance of firm. For my thesis, I choose KZ index
(1997) by Kaplan và Zingales, to determine the financial constraint
firms.
2.2.2. Identify the financially constraint firms
KZ index (1997) by Kaplan và Zingales as equation (2):
KZ (1997) = 0,283*M/B + 3,139*Debt/TA – 39,368*DIV/NFA –
1,315* CashHoldings/NFA – 1,002* CF/NFA
(2)
Which, CF is internal cash flow, is defined as net profit plus
depreciation; NFA is Net Fixed Asset; M/B is measured as the
market value total assets divided by book value of total assets; DEBT
is total liabilities; DIV is dividend; CashHoldings is cash and cash
equivalents. KZ index has been used to identify firms that are more
7
likely to face financially constraints. Higher levels of KZ index
indicate higher likelihood that a firm is financially constrained.
2.3. Identify government controlled firms
To make sure that a decision is adopted by one shareholder,
the shareholder must own 51% of shares with voting rights.
However, under regulations corporate law with a percentage of
shareholders voting shares less than 51% still capable of governing a
decision. Specifically, if a decision is adopted at the 1st meeting of
shareholders, it required number of shareholders representing at least
65% X65% = 42.25% of the total votes of all shareholders attending
the meeting. In the case of the second meeting occurred, just the
percentage of shares of 33.15% (= 51% X 65% ) is required to accept
a decision of the shareholders meeting. When a shareholder holding
33.15% of shares with voting rights, they should calculate to make
the second meeting aims to adopt a decision. So, the first I am based
on the percentage 33.15% to determine the goverment controlled
firms. The firm has proportion of shares owned by state shareholders
greater than or equal 33.15%, it is defined as firms with the control
of the state. The firm has proportion of shares owned by state
shareholders less than 33.15%, it is determined that the firm does not
have the control of the state. With defining government control firms
as above, I use DumGov variable representing the control of the
State. DumGov is dummy variable, code 1 for firm-years that have a
government controlling shareholder and 0 otherwise.
More certainly, I use the extra ratio 42.25% and 51% to
determine the government controlled firms.
8
2.4. Model research
Model research as equation (3):
𝑰
( ) = 𝜶𝟎 + 𝜶𝟏 𝑪𝑭/𝑲𝒊𝒕 + 𝜶𝟐 𝑺𝒚𝒔𝒓𝒊𝒔𝒌𝒊𝒕 + 𝜶𝟑 𝑰𝒅𝒊𝒐𝒓𝒊𝒔𝒌𝒊𝒕 + 𝜶𝟒 𝑳𝒊𝒒𝒖𝒊𝒅𝒊𝒕 +
𝑲 𝒊𝒕
+ 𝜶𝟓.𝟏 (𝑪𝑭𝑫𝒖𝒎𝑮𝒐𝒗)𝒊𝒕 +𝜶𝟓.𝟐 (𝑺𝒚𝒔𝑫𝒖𝒎𝑮𝒐𝒗)𝒊𝒕 + 𝜶𝟓.𝟑 (𝑰𝒅𝒊𝒐𝑫𝒖𝒎𝑮𝒐𝒗)𝒊𝒕 + 𝜶𝟓.𝟒 (𝑪𝑭𝑫𝒖𝒎𝑮𝒐𝒗)𝒊𝒕
+ 𝜶𝟓.𝟓 (𝑪𝑭𝑹𝒂𝒕𝒆𝑮𝒐𝒗)𝒊𝒕 + 𝜶𝟓.𝟔 (𝑺𝒚𝒔𝑹𝒂𝒕𝒆𝑮𝒐𝒗)𝒊𝒕 + 𝜶𝟓.𝟕 (𝑰𝒅𝒊𝒐𝑹𝒂𝒕𝒆𝑮𝒐𝒗)𝒊𝒕 +𝜶𝟓.𝟖 (𝑳𝒊𝒒𝒖𝒊𝒅𝑹𝒂𝒕𝒆𝑮𝒐𝒗)𝒊𝒕
+ 𝜶𝟔 𝑸𝒊𝒕 + 𝜶𝟕 𝑺𝒊𝒛𝒆𝒊𝒕 + 𝜶𝟖 𝑳𝒆𝒗𝒊𝒕 + 𝜶𝟗 𝑺𝒂𝒍𝒆𝒊𝒕 + 𝜶𝟏𝟎 𝑹𝒆𝒕𝒖𝒓𝒏𝒊𝒕 + 𝜶𝟏𝟏 𝑨𝒈𝒆𝒊𝒕 + 𝝁𝒊𝒕 (3)
Which is error term.
2.5. Data research
Data research were collected from the financial statements of
companies listed on the stock market in Vietnam with the criteria of
the largest observations and enough data to satisfy research model.
With this criterion, I used data of 211 firms from 2007 to 2013. The
data is the form of unbalanced panel data.
2.6. Method research
The thesis use GARCH (p,q) (Generalized Autoregressive
Conditional Heteroscedasticity) to estimate β from equation (1) and
the standard deviation of the residuals from (1) model estimated.
Two proxies are systematic risk variable and idiosyncratic risk
variable in (3) model . For (3) model, the thesis use GMM
(Generalized method of moments). GMM has two commonly
estimates as Dif-GMM and Sys-GMM, I choice Sys-GMM estimate.
9
CHAPTER 3: OVERVIEW OF INVESTMENT, CASH FLOW,
SYSTEMATIC RISK, IDIOSYNCRATIC RISK AND STOCK
LIQUIDITY OF VIETNAM FIRMS FROM 2007 TO 2013.
3.1. Investment of Vietnam firms is overinvestment or
underinvestment?
Model identified overinvestment or underinvestment
INEW,t = + 1SaleGrt-1 + 2Leveraget-1 + 3Casht-1 + 4Aget +
5Sizet-1 + 6StockReturnst-1 +6INEW,t-1 + Year Indicator +
Industry Indicator + i,t
(3.1)
i,t = INEW,t ( + 1SaleGrt-1 + 2Leveraget-1 + 3Casht-1 + 4Aget +
5Sizet-1 + 6StockReturnst-1 + 6INEW,t-1 + Year Indicator +
Industry Indicator)
(3.2)
Which, INEW is new investment; SaleGr is the proportion of change in
sales; Leverage is debt ratio; Cash is casholding ratio; Age is the
number of years since establishment of stock company; Size is scale
of total assets; StockReturns is the stock price return of firm
Investment
of
Vietnam
firms
is
overinvestment
or
underinvestment?
After estimate (3.1) model, I analyze residual of model. The
residue analysis results have shown that in the year 1235 observers
firms, 526 firms have overinvestment, overinvestment rate was
8.36%. The number underinvestment firms were 709 firms, and
underinvestment rate was 6.20%. So, the number of overinvestment
firms is less than the number of underinvestment firms, but
overinvestment rate is more than underinvestment rate. For this
result, I note that, whole Viet Nam firms market, firms was
overinvestment from 2008 to 2013. This characteristic will explain
the research results in chapter 4.
10
3.2. Characteristics of financially constraint firms
- Operational efficiency of more financially constraint firms by
ROE, EPS was lower than mean of sample, and much lower than less
financially constraint firms.
- More financially constraint firms had low investment rate,
weak cash flow, high debt ratio, the percentage revenue growth less.
- When the market go down, stock prices of more financially
constraint firms decrease more than the ones of less financially
constraint firms, leading market value of more financially constraint
firms are below their book value.
- More financially constraint firms are more idosyncaratic than
less financially constraint firms.
- More financially constraint firms are overinvesting.
3.3. Characteristics of government controlled firms
Compared
non-government
controlled
firms,
government
controlled firms have characteristics as follows:
- Highly investment, strong cashflow, high sales growth rate,
big size, high performance.
- Easy to get bank loans, high debt, although internal funds are
higher than investment.
- When the market goes down, stock prices of government
controlled firms decrease a little.
- Overinvestment rate is higher.
3.4. Volatility of investment, cash flow, systematic risk,
idiosyncratic risk and stock liquidity.
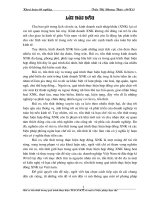
- Figure 3.4A has shown that the rate of investment on net fixed
assets tends to decrease from 2008 to 2013 as well as the decrease of
internal funds. However, internal funds are higher than investment. It
11
has shown that Vietnamese firms does not have many opportunities
to use all internal funds.
- Figure 3.4 B has shown that systematic risk increase at one
time but it decease at another time. After all, it tends to decrease over
time. The fluctuation is explained by policy government.
- Figure 3.4 C: The flunctuation of idiosyncratic risk every year
remain 42.99%.
-Figure 3.4 D: Stock liquidity fluctuates during 2008-2013.
12
Figure 3.4: Volatility investment, cash flow, systematic risk, idiosyncratic risk and liquidity
3.4A
3.4B
3.4C
Source: Statistics from research data
3.4D
13
CHAPTER 4: RESEARCH FINDINGS
4.1. The effect of cash flow, systematic risk, idiosyncratic risk
and stock liquidity on Vietnamese firms’ investment:
The result (as table 4.3) has shown that:
Cash flow, stock liquidity and idiosyncratic risk have a positive
impact on investment. Idiosyncratic risk has a negative impact in
investment.
The strongest factor that affects investment is cash flow (0.88%),
the second strongest one is stock liquidity (0.35%), the third one
is idiosyncratic risk (0.29%) and the fourth one is systematic risk
(0.16%). This results are appropriate to the order pecking theory:
internal funds are used first, and then capital from issuing shares
is used.
The impact of systematic risk and idiosyncratic risk on
investment are opposite, and the impact level of systematic risk
is over the impact level of idiosyncratic risk. The increase of
systematic risk lead to reduce investment while investment
increase when idiosyncratic risk goes up. The impact of
uncertainty on investment has shown that Vietnamese firms get
growth investment opportunities and trade-off higher risk. It is
explained that these firms are overinvesting and use debt to
invest.
14
Table 4.3: Results estimate the impact of cash flow - systematic risk – idiosyncratic risk - stock
liquidity to investment
Dependent variable: I/K
(1)
(2)
(3)
(4)
0,0905***
0,0993***
0,1063***
0,0462
L1.I/K
(0,001)
(0,002)
(0,003)
(0,139)
0,5797***
0,5249***
0,6732***
0,4428***
CF/K
(0,006)
(0,003)
(0,001)
(0,001)
0,1751*
0,1806*
-0,1795*
Sysrisk
(0,091)
(0,097)
(0,098)
1.9893**
0,9993*
Idiorisk
(0,036)
(0,091)
28,6592***
Liquid
(0,001)
-0,1493
-0,2895
-0,0826
-0,0550
Q
(0,453)
(0,218)
(0,652)
0,592
-0,3444*
-0,3039**
-0,0047
0,3020***
Size
(0,066)
(0,033)
(0,973)
(0,009)
1,9367***
1,9390***
1,8892**
0,7473*
Lev
(0,008)
(0,002)
(0,017)
(0,063)
0,0003
0,0156
-0,0334
-0,0145
Sale
(0,997)
(0,853)
(0,763)
(0,835)
0,0004
0,0206
-0,1010
-0,1086**
Return
(0,994)
(0,737)
(0,123)
(0,037)
-0,0063
-0,1187
0,1541
-0,1196
Age
(0,980)
(0,605)
(0,555)
(0,561)
15
Table 4.5: Results estimate the impact of cash flow - systematic risk – idiosyncratic risk - stock
liquidity to investment: More financially constraint firms vs less financially constraint firms.
More financially
Less financially
Dependent variable I/K
Full sample
constraint firms
constraint firms
FC
(PFC+NFC)
0,0462
0,0706
0,1252**
L1.I/K
(0,139)
(0,136)
(0,049)
0,4428***
0,4585**
0,0808*
CF/K
(0,001)
(0,032)
(0,053)
-0,1795*
-0,2646**
-0,4608**
Sysrisk
(0,098)
(0,041)
(0,032)
0,9993*
0,8352*
-1,5457**
Idiorisk
(0,091)
(0,071)
(0,039)
28,6592***
36,4623**
25,2528*
Liquid
(0,001)
(0,024)
(0,064)
-0,0550
-0,2640
-0,0018
Q
(0,592)
(0,317)
(0,994)
0,3020***
0,2726**
-0,1284
Size
(0,009)
(0,037)
(0,560)
0,7473*
0,6154*
1,6811**
Lev
(0,063)
(0,053)
(0,025)
-0,0145
0,2491
0,9961***
Sale
(0,835)
(0,225)
(0,003)
-0,1086**
-0,0759
0,1934
Return
(0,037)
(0,236)
(0,319)
-0,1196
-0,1008
-0,0391
Age
(0,561)
(0,627)
(0,943)
16
4.2. The comparison between more financially constraint firms
and less financially constraint firms
The study made a comparison of the impact of cash flow, systematic
risk, idiosyncratic risk and stock liquidity on investment between
more financially constraint firms and less financially constraint firms
from 2008 to 2013 (as the results of table 4.5 and table 4.7 shown).
- When cash flow increase, investment of both groups increase too.
However, the level of impacts of cash flow on investment are
different. In other words, investment by more financially constraint
firms is more sensitive to cash flow than investment by less
financially constraint firms. It is explained by the different
characteristics of both groups.
Systematic risk has an negative effect on investment of both
groups. When systematic risk increase, investment by more
financially constraint firms are decrease less than investment by
less financially constraint firms. This result has proven that more
financially constraint firms are ‘less afraid of’ risk than less
financially constraint firms.
The effect of idiosyncratic risk on investment in both groups is
opposite. Result of research showed that, when idiosyncratic risk
increase, investment by more financially constraint firms increase
too; While, investment by less financially constraint firms
decrease when idiosyncratic risk increase. The changes of
investment by more/less financially constraint firms when
systematic risk and idiosyncratic risk have volatilities showed
that, more financially constraint firms are less afraid of risk than
less financially constraint firms. This is because more financially
17
constraint firms use debt to overinvest, and they choose projects
with high return but high risk. These decisions help them
overcome their current financial distress.
Stock liquidity affect investment both groups in a positive
correlation. Though investment by both groups increase, it seems
that investment by more financially constraint firms is dominated.
In other words, investment by more financially constraint firms is
more sensitive to stock liquidity than investment by less
financially constraint firms.
To less financially constraints firms, uncertainty is the strongest
one factors affecting investment (0,37%+0.45%). It has proven
that these firms are cautious about investment decisions. When
uncertainty increases, they cut down investment, and exercise
waiting options.
Investment by more financially constraints firms is strongly
affected by financial funds more than uncertainty. Because
uncertainty is not as important as internal funds, they can choose
growth opportunity investment and high risk. Also, they continue
to invest more even when idiosyncratic risk increases.
- To more financially constraint firms, cash flow is the strongest
factor affecting their investment decisions, and stock liquidity is the
second one. Systematic risk and idiosyncratic risk are factors which
affect less than the two previous ones. While the former affect their
investment in a negative way, the latter affect their investment in a
positive way. Additionally, the levels of the two affecting factors are
nearly the same.
18
- When it comes to less financially constraints firms, the result
changes in a different way. Specifically, uncertainty is the strongest
affecting factor, and the second one is internal funds. Therefore,
investment decisions by less financially constraints firms are
different from more financially constraints ones.
Table 4.7: Summary results estimate: More financially constraint
firms vs Less financially constraint firms
Changes in investment
Volotilities
Full
sample
More
financially
constraint
firms
Less
financially
constraint
firms
One standard
deviation
increase of
cash flow
volatility
0,88%
0,62%
0,19%
One standard
deviation
increase of
systematic
volatility
-0,16%
-0,26%
-0,37%
One standard
deviation
increase of
idiosyncratic
volatility
0,29%
0,25%
-0,45%
One standard
deviation
increase of
stock
liquidity
volatility
0,35%
0,48%
0,27%
Conclusion of the thesis
Investment
by
more
financially constraint firms is
more sensitive to cash flow
than investment by less
financially constraint firms.
The same level of increase
systematic risk, investment by
more financially constraint
firms decrease less than
investment by less financially
constraint firms.
The
same
level
of
increaseidiosyncratic
risk,
investment
by
more
financially constraint firms
increase, but investment by
less financially constraint
firms decrease
Investment
by
more
financially constraint firms is
more sensitive to stock
liquidity than investment by
less financially constraint
firms.
19
4.4 Comparison between non-government controlled firms and
government controlled firms
The study has resulted as below:
The affect of cash flow on investment by government
controlled firms is stronger than investment by non-government
controlled firms. In other words, investment by government
controlled firms is more sensitive to cash flow than investment
by non-government controlled firms. When government
controlled firms have
big funds, their investment decisions
primarily depend on economic and social goals of the
government. They can do so because agency cost of government
controlled firms are much more than that one of nongovernment controlled firms. Therefore, non-government
controlled firms are more willing to complete the command of
the government.
Systematic risk affects investment decisions by government
controlled firms in a positive way, but it affect investment
decisions by non-government controlled firms in a negative
way. The reasons explaining the effect of systematic risk on
government firms’ decisions is the same the ones the effect of
cash flow on government firms’ decisions. The negative
correlation between systematic risk and investment decisions of
non-government controlled firms has proven that they care
much more about the fluctuation of markets. Therefore, they cut
down investment and wait for good news from markets in order
to make informed decisions.
20
Idiosyncratic risk affects government controlled firms’
investment decisions in a negative way, but it affects nongovernment controlled firms’s investment decisions in a
positive way. It is explained that with high performance,
government controlled firms’ market value are much more than
ones’ book value, therefore, they don’t choose to invest in
projects which have idiosyncratic risk. Conversely, like more
financially constraints firms, non-government firms decide to
choose growth opportunity investment and accept high risk.
The effect of stock liquidity of investment decisions of
government controlled firms is less than the one of nongovernment controlled firms. In another words, investment by
government controlled firms is less sensitive than one by nongovernment firms. This is because government controlled firms
with high productivity have strong cash flow and are easy to get
bank loans.
To non-government controlled firms, cash flow is the
strongest factors affecting their investment decisions, and the
second one is stock liquidity. Systematic risk and idiosincratic
risk are less affecting factors. While the former affects their
investment decisions in a negative way, the latter affects their
investment decisions in a positive way. To sum up, investment
by non-government controlled firms is more sensitive to
financial funds. Additionally, they accept risk to choose growth
opportunity investment. Their decisions are nearly the same
with the ones making by more financially contraints firms.
21
Government controlled firms’ investment decisions are
affected in a different way. In particular, cash flow is the
strongest affecting factor, the second one is systematic risk, the
third one is idiosyncratic risk, and the fourth one is stock
liquidity. This has been explained that investment decions made
by government controlled firms primarily depend on economic
and social goal of the government.
* Robust check (Using RateGov variable)
This section, I use interacting variables between the main
independent variables with the proportion of shares owned by state
shareholders variable (RateGov variable) as robust check for result
estimates by using DumGov variable.
The study by testing of
RateGov variable has the same result with one by testing with
dummy variables, as table 4.13.
22
Bảng 4.8: Results estimate the impact of cash flow - systematic risk – idiosyncratic risk - stock liquidity to
investment: Research in government control firms
Using dummy variable (The proportion of shares owned by state
Dependent variable
shareholders 35,15%33,15%)
I/K
(1)
(2)
(3)
(4)
(5)
0,0765***
0,1245***
0,0553*
0,0534*
0,0865***
L1.I/K
(0,009)
(0,001)
(0,055)
(0,074)
(0,002)
0,3264*
0,2267*
0,5399***
0,4481***
0,3811**
CF/K
(0,094)
(0,096)
(0,000)
(0,005)
(0,031)
CFDumGov
Sysrisk
0,4690**
(0,049)
-0,1964*
(0,080)
0,9455*
(0,082)
-0,4194**
(0,013)
0,2821*
(0,085)
0,7799*
(0,076)
34.7963***
(0,003)
45.0035***
(0,004)
SysDumGov
Idiorisk
IdioDumGov
Liquid
LiquidDumGov
-0,2096**
(0,047)
-0,2514*
(0,092)
0,9148*
(0,098)
-0,7036*
(0,057)
17,4793*
(0,069)
1,1089*
(0,073)
49,8332***
(0,002)
-47,4202*
(0,088)
0,6194*
(0,075)
-0,3757*
(0,078)
0,5785*
(0,063)
1,0850*
(0,077)
-1,0272**
(0,043)
42,5763**
(0,014)
-39,1304*
(0,099)
23
Table 4.10: Results estimate the impact of cash flow - systematic risk – idiosyncratic risk - stock liquidity
to investment: Research in government control firms (using dummy variables)
The proportion of
The proportion of
The proportion of
shares owned by
shares owned by
shares owned by
Dependent variable I/K
state shareholders
state shareholders
state shareholders
35,15%
42,25%
51%
0,0865***
0,0650***
0,0522*
L1.I/K
(0,002)
(0,040)
(0,098)
0,3811**
0,2783*
0,3063**
CF/K
(0,031)
(0,093)
(0,041)
0,6194*
0,5963*
0,7675*
CFDumGov
(0,075)
(0,095)
0,095
-0,3757*
-0,3129*
-0,3030**
Sysrisk
(0,078)
(0,062)
(0,038)
0,5785*
0,5589**
0,3107*
SysDumGov
(0,063)
(0,033)
(0,098)
1,0850*
1,1394*
0,5779*
Idiorisk
(0,077)
(0,098)
(0,100)
-1,0272**
-1,2282***
-0,8969**
IdioDumGov
(0,043)
(0,009)
(0,029)
42,5763**
36,0285**
37,0487***
Liquid
(0,014)
(0,028)
(0,007)
-39,1304*
-45,1944*
-7,0526
LiquidDumGov
(0,099)
(0,095)
(0,758)
24
Volatilities
One standard deviation
increase of cash flow
volatility
One standard deviation
increase of systematic
volatility
One standard deviation
increase of idiosyncratic
volatility
One standard deviation
increase of stock
liquidity volatility
Bảng 4.11: Summary results estimate (using dummy variables)
Changes in investment
The proportion of shares
The proportion of shares
The proportion of shares
owned by state
owned by state
owned by state
shareholders 33,15%
shareholders 42,25%
shareholders 51%
NonNonNonGovernment
Government
Government
Government
Government
Government
controlled
controlled
controlled
controlled
controlled
controlled
firms
firms
firms
firms
firms
firms
0,76%
1,60%
0,55%
1,31%
0,61%
1,51%
-0,34%
0,39%
-0,29%
0,40%
-0,28%
0,08%
0,32%
-0,25%
0,34%
-0,32%
0,17%
-0,28%
0,53%
0,22%
0,44%
0,12%
0,46%
25
Table 4.13: Robust check for results estimate the impact of cash flow - systematic risk – idiosyncratic
risk - stock liquidity to investment: Government control firms vs Government does not control firms
Using RateGov variable
Dependent variable I/K
(1)
(2)
(3)
(4)
(5)
0,0538*
0,1318***
0,0548*
0,0648**
0,0972***
L1.I/K
(0,084)
(0,001)
(0,070)
(0,023)
(0,006)
0,2992*
0,2014*
0,5397***
0,4267***
0,2891*
CF/K
(0,082)
(0,069)
(0,000)
0,003
(0,094)
0,0084*
0,0121*
CFRateGov
(0,088)
(0,091)
Sysrisk
-0,1788*
(0,093)
0,8286*
(0,094)
-0,4652***
(0,019)
0,0070*
(0,070)
0,9824**
(0,041)
30.5126***
(0,003)
43,5996***
(0,003)
SysRateGov
Idiorisk
IdioRateGov
Liquid
LiquidRateGov
-0,2482**
(0,033)
-0,2528*
0,098
1,0602*
(0,088)
-0,0174*
(0,065)
18,8998*
(0,059)
1,0753*
0,100
50,0881***
0,002
-0,6229*
(0,070)
-0,6724***
(0,009)
0,0177**
(0,018)
1,7971**
(0.011)
-0,0358***
(0,002)
55,8534**
(0,014)
-1,0936*
(0,091)