Factors affecting the satisfaction of festival visitors evidence from vietnam
Bạn đang xem bản rút gọn của tài liệu. Xem và tải ngay bản đầy đủ của tài liệu tại đây (1.14 MB, 82 trang )
UNIVERSITY OF ECONOMICS HO CHI MINH CITY
International School of Business
------------------------------
Nguyen Van Tho
FACTORS AFFECTING THE SATISFACTION
OF FESTIVAL VISITORS: EVIDENCE FROM VIETNAM
MASTER OF BUSINESS (Honours)
SUPERVISOR: DR. CAO HAO THI
Ho Chi Minh City – Year 2014
UNIVERSITY OF ECONOMICS HO CHI MINH CITY
International School of Business
------------------------------
Nguyen Van Tho
FACTORS AFFECTING THE SATISFACTION
OF FESTIVAL VISITORS: EVIDENCE FROM VIETNAM
MASTER OF BUSINESS (Honours)
SUPERVISOR: DR. CAO HAO THI
Ho Chi Minh City – Year 2014
ACKNOWLEGEMENTS
I do personal believe that I would not have been successful in completing my thesis without
the conscientious support, guidance and advice of many people.
First of all, I would like to express my gratitude to Dr. Cao Hao Thi for his quiet leadership,
generous guidance and encouragement. Although faced many difficulties, his enthusiastic
guidance provided me the useful knowledge which helped me to have directions for my
study.
Secondly, I want the supervisory board know how much I appreciate them for providing
me with their available advices helped me to gain a better understanding of the subject and
creating favorable conditions for me during period of the thesis.
Furthermore, I would also like to express my deep gratitude to administrative offices of
International School of Business – University of Economics Ho Chi Minh City for their
administrative support, creating favorable conditions for me during the MBA course as
well as during the time I do this research.
Besides, I would like to give my sincere thanks to people who helped me to complete the
survey and sincere sharing my study topic.
Last but not least, I would like to send the most special thanks to my family, who are my
motivation, they supported me by their love and faith in my abilities which have helped me
in my efforts to become a better researcher.
i
ABSTRACT
The main purpose of this study is to investigate key factors that affecting the satisfaction
of festival visitors in Vietnam. Based on the literature reviews, this study proposes a
conceptual framework.
A quantitative study is applied via survey method by questionnaire with sample size
investigated is 162 visitors who have ever attended festival in Vietnam to test theory,
including their feeling and comments. Multiple linear regression analysis is chosen to find
the relationship between the satisfaction of visitors at festival with festivalscape factors
such as program content, staff, facility, food, souvenir, convenience and information.
The results suggest that in order to have the satisfaction of tourists, it must focus on factors
such as program content, facility, food, staff, souvenir, convenience. These findings
complement theory about behavior of visitors attending festival, providing planners as well
as administrators the way to design a festival effectively.
Keywords: festivalscape, visitors’ satisfaction, Vietnam.
ii
TABLE OF CONTENTS
ACKNOWLEGEMENTS .................................................................................................... i
ABSTRACT ........................................................................................................................ ii
TABLE OF CONTENTS ................................................................................................... iii
LIST OF ABBREVIATIONS ............................................................................................. v
LIST OF FIGURES ............................................................................................................ vi
LIST OF TABLES............................................................................................................. vii
CHAPTER 1:
INTRODUCTION .................................................................................... 1
1.1
Problem statement .................................................................................................. 1
1.2
Research objectives ................................................................................................ 3
1.3
Research questions ................................................................................................. 3
1.4
Research scope ....................................................................................................... 4
1.5
Research contribution ............................................................................................ 4
1.6
Research structure .................................................................................................. 4
CHAPTER 2:
LITERATURE REVIEWS ....................................................................... 6
2.1
Festivalscape .......................................................................................................... 6
2.2
Satisfaction ............................................................................................................. 9
2.3
Previous studies about festivalscape .................................................................... 10
2.4
Research model .................................................................................................... 11
2.4.1
Hypothesis ..................................................................................................... 11
2.4.2
Conceptual framework .................................................................................. 15
CHAPTER 3:
RESEARCH METHODOLOGY ........................................................... 17
3.1
Item generation step ............................................................................................. 18
3.2
Quantitative pilot study ........................................................................................ 18
3.3
Quantitative main study ....................................................................................... 21
3.3.1
Data collection............................................................................................... 21
3.3.1.1
Sample size ............................................................................................. 21
3.3.1.2
Sampling method .................................................................................... 22
iii
3.3.2
Methods of data analysis ............................................................................... 23
3.3.2.1
Reliability measure by Cronbach’s Alpha analysis ................................ 23
3.3.2.2
Validity measure by EFA ....................................................................... 23
3.3.2.3
Multiple regression analysis ................................................................... 24
CHAPTER 4:
4.1
DATA ANALYSIS ................................................................................ 27
Data collection ..................................................................................................... 27
4.1.1
Filter the data ................................................................................................. 27
4.1.2
Coding ........................................................................................................... 27
4.2
Descriptive statistics ............................................................................................ 27
4.3
Reliability analysis ............................................................................................... 30
4.4
Exploratory Factor Analysis ................................................................................ 33
4.4.1
System of testing for EFA ............................................................................. 33
4.4.2
The results of EFA model ............................................................................. 33
4.5
Regression analysis .............................................................................................. 36
4.5.1
Testing of the fit level of model .................................................................... 36
4.5.2
Testing of regression coefficient ................................................................... 41
4.6
The hypothesis testing .......................................................................................... 41
4.6.1
Unstandardized regression coefficient .......................................................... 41
4.6.2
Standardized regression coefficient .............................................................. 43
CHAPTER 5:
CONCLUSIONS AND RECOMMENDATIONS ................................. 45
5.1
Conclusions .......................................................................................................... 45
5.2
Recommendations ................................................................................................ 47
5.3
Implications of the study ...................................................................................... 48
5.4
Limitation and further research ............................................................................ 49
REFERENCES .................................................................................................................. 50
APPENDIX 1: QUESTIONAIRE – ENGLISH VERSION ............................................. 55
APPENDIX 2: QUESTIONAIRE – VIETNAMESE VERSION ..................................... 59
APPENDIX 3: THE DATA ANALYSIS RESULTS ....................................................... 64
iv
LIST OF ABBREVIATIONS
KMO:
Kaiser–Meyer–Olkin
EFA:
Exploratory Factor Analysis
SPSS:
Statistical Package Software for Social Science
v
LIST OF FIGURES
Figure 2.1: Framework for Understanding Environment-User Relationships in Service
Organizations ................................................................................................... 7
Figure 2.2: Program content and festival visitors’ satisfaction ........................................ 12
Figure 2.3: Staff and festival visitors’ satisfaction ........................................................... 12
Figure 2.4: Facility and festival visitors’ satisfaction....................................................... 13
Figure 2.5: Food and festival visitors’ satisfaction........................................................... 14
Figure 2.6: Souvenirs and festival visitors’ satisfaction ................................................... 14
Figure 2.7: Convenience and festival visitors’ satisfaction .............................................. 15
Figure 2.8: Information and festival visitors’ satisfaction ................................................ 15
Figure 2.9: Research model .............................................................................................. 16
Figure 3.1: Research process ............................................................................................ 17
Figure 4.1: Model fit ......................................................................................................... 32
Figure 4.2: Scatterplot ...................................................................................................... 39
Figure 4.3: Normal P-P plot of regression standardized residual ..................................... 40
vi
LIST OF TABLES
Table 3.1: Factors and items summary ............................................................................. 20
Table 4.1: Coding the items of festivalscape factors ........................................................ 28
Table 4.2: The profile of respondents ............................................................................... 29
Table 4.3: Reliability statistics .......................................................................................... 31
Table 4.4: KMO and Bartlett’s test ................................................................................... 33
Table 4.5: Rotated component matrixa ............................................................................. 34
Table 4.6: The retest of reliability analysis....................................................................... 35
Table 4.7: Model adjusted through reliability analysis and EFA ..................................... 36
Table 4.8: Casewise diagnosticsa ...................................................................................... 37
Table 4.9: Model summaryb .............................................................................................. 37
Table 4.10: ANOVAa ........................................................................................................ 38
Table 4.11: Correlations.................................................................................................... 38
Table 4.12: Coefficientsa ................................................................................................... 41
Table 4.13: Hypothesis testing .......................................................................................... 42
Table 4.14: The importance level of factors ..................................................................... 43
vii
CHAPTER 1: INTRODUCTION
The first part of this chapter is the statement of tourism problem as well as the satisfaction
of festival visitors. Then, this chapter shows the aims of the study in research objectives
part and identifies the research questions. And finally, in turn, this chapter provides scope,
contribution and structure of this research.
1.1
Problem statement
Nowadays, world tourism industry begins to have the sign of prosperity and its recovery
speed is faster than any other economic industry. In developing countries, tourism has been
recognized as a motivation for economic development and contribute to poverty reduction
and employment creation.
Tourism means not only enjoying the scenic, the world natural heritage but also finding
out, exploring indigenous cultures via famous festivals filled with cultural particularities
of each region, each country. Besides, organizing festival is a method of tourist’s returning
because it is the top attention of countries which are focusing on promoting the
development of “smokeless industry”. To have that returning decision, the tourists, first of
all, must feel satisfied with that festival. Therefore, studying about factors affecting the
satisfaction of festival tourists has been researched by many researchers in around the
world for many years such as Lee et al. (2008), Özdemir & Çulha (2009), Yoon et al.
(2010), Grappi & Montanari (2011), Anil (2012), Mensah (2013).
In Vietnam, we cannot deny that “smokeless industry” has been confirmed its important
position in the national economy. However, overall Vietnam tourism industry is still not
competitive enough on the international market, many visitors admired the beautiful
landscape in Vietnam but just a few of them return the second time. According to recent
interviews, almost tourists need something more than just scenic, we only exploit the
natural what available in Vietnam but not do anything to make them more beautiful, more
attractive. Therefore, besides traditional tourism elements such as scenic spots, world
natural heritage, Vietnam’s tourism industry has organized many festivals which contain
1
cultural characteristics of each regions of the country for tourists to explore the culture of
the indigenous people. In Online Conference for summarizing the management and
organization of the festivals in 2013, Ministry of Culture and Information of Vietnam
mentions that every year, there are more than 8000 festivals in Vietnam. They include:
traditional folk festivals, religious festivals and many festivals imported from abroad.
Among these diverse festivals, there are many festivals attracted a lot of tourists across the
country as well as oversea such as Hue Festival, Da Lat Flower Festival, Ha Long Tourism
Festival, Da Nang International Fireworks Festival... The festivals contained
characteristics of each locality not only introduce to foreign visitors a Vietnam which is
dynamic, modern but rich in cultural traditions, diversifying the types of tourism products
but also help Vietnamese tourists learn more about the abundant and diversity cultural of
their hometown.
Besides positives, festivals in Vietnam still exist the obvious weakness, which is about the
quality of performance organization, products sold in festivals as well as service demands
of tourists. In fact, the plans of organizing festivals are too widespread, lack of
government’s management, lead to the triteness for the sense of festivals. Moreover,
although the infrastructure system has been invested to upgrade, it is still lack of uniformity
among regions, and tourist sites. The labor resources are numerous but still have weak
constraint qualification. Besides, there are many other problems caused by the shortage of
profession in all preparing steps, inconsistence in organizing. Those problems certainly
make tourists afraid to visit and return because the factors about the profession in
performance organization, staffs’ qualification as well as quality of products have direct or
indirect effects on the satisfaction of tourists. With the actual situation stated above,
remedies are necessary for the development of Vietnam’s tourism. In other words, finding
out the factors affecting the satisfaction of domestic tourists is extremely important,
because before making the tourists all over the world impressed, the background of history,
the diversity and richness of the culture have to be judged perfectly by Vietnamese.
Therefore, government and the representative of functional departments have been
2
proposed a series of measures to improve those problems, they urged businesses to invest,
build, manage and train the friendly, professional organizing staff of the festival to attract
tourists.
These actions has proved that government and tourism investors really care and desire to
improve dispensable problems and therefore they can impulse Vietnam tourism through
the festivals which are deeply imbued with the national identity. However, there is none
(or very few) researches focus on discovering factors that effect on the attitude related to
satisfaction of domestic tourists to the cultural festival.
1.2
Research objectives
To help planners and tourism enterprises to have more basis to set out the strategic plan for
the tourism market as well as implement the theories in this field, the aim of this study is
to:
Determine factors which affecting to the visitors’ satisfaction when enjoying festivals
in Vietnam.
Determine strength of relationship between these factors and the visitors’ satisfaction.
1.3
Research questions
Basing on above analyzed issues, to clarify factors affecting the satisfaction of festival
tourists, this study will try to answer the questions:
What are the factors impact to the visitors’ satisfaction when enjoying festivals in
Vietnam?
How do those factors effect on the visitors’ satisfaction when enjoying festivals in
Vietnam?
3
1.4
Research scope
Vietnam is a multi-nationality country with 54 ethnic groups so there are many festivals
filled with cultural particularities of each region organized every years. This means it is
completely unfeasible to survey tourists’ comments at all festivals all over the country.
Therefore, the surveyed object is tourists attended the most famous festivals of Vietnam
such as Hue Festival, Da Lat Flower Festival, Nha Trang Sea Festival, Ha Long Tourism
Festival, Da Nang International Fireworks Festival and some other festivals.
1.5
Research contribution
Basically, this study demonstrates that factors affecting the satisfaction of festival tourists
has been recognized as an important motivation for tourism market development of our
country because of its several benefits. The analysis of the tourists’ satisfaction at festivals
will help investors and tourism enterprises to arrange as well as redefine their portfolio
then have more basis to set out the strategic plan for the tourism market, the contribution
to the field is threefold. The first one is, determine factors which affecting to the visitors’
satisfaction at festival, this may help tourism marketers to understand their customers’
demand. Second, analyzing the influences of these factors as well as discovering the
relationship between the policy elements of festivals with the visitors’ satisfaction can help
tourism planners to propose organization plans to overcome the shortcomings which affect
demand of domestic tourists. And finally, the recommendations are suggested to improve
the visitors’ satisfaction when enjoying festivals in Vietnam.
In addition, this study implements theories in this field-satisfaction research. The findings
should strengthen knowledge about tourist’s standard requirements about festivals they
enjoyed in Vietnam.
1.6
Research structure
This study includes five chapters:
4
The first chapter is “Introduction” which includes comprising problem statement,
research objectives, research questions, research scope, research contribution and
structure of research.
The second is “Literature reviews”, this chapter summarizes concepts, theories,
experiences and previous researches about the elements that affect to the satisfaction of
festival visitors in Vietnam then gives research model includes hypotheses and
conceptual framework used for the research.
The next chapter is “Research methodology” which introduces about the research
process, data collection and the methods of data analysis.
The fourth is “Data analysis” chapter which reports the analysis results from collected
data via the surveys.
Finally, the last chapter is “Conclusions and recommendations” discussing about
research results from “data analysis” chapter and giving the recommendations.
5
CHAPTER 2: LITERATURE REVIEWS
This chapter introduces about (1) festivalscape concept, the theories about (2) satisfaction.
Next, it mentions to (3) the previous studies about festivalscape as well as the results about
the influence of factors which the previous researchers proposed from their studies, impact
to the visitors’ satisfaction at festivals. And finally is the (4) model of the research which
concludes the hypotheses and the conceptual framework.
2.1
Festivalscape
The concept about “festivalscapes” is mentioned firstly by Lee et al. (2008). According to
Lee et al. (2008), this concept based on the environmental psychology theory that statement
tangible environment is a factor impact to emotion of customer in an environment, for
example, retail environments or physical environments (Mehrabian & Russell, 1974).
There are many cues build a festiavalscape, in which retail environments and service
quality as well as customers’ satisfaction is typical cues (Lee et al., 2008).
With the retail environments, Lee et al. (2008) defines that it similar a type of customer
patronage while the physical environments influence to the service quality as well as
customer’s satisfaction in a service is called servicescape (Bitner, 1990).
Booms & Bitner (1982) states servicescape is an environment that seller and buyer interact
together through tangible commodities to take place a service, so the tangible influence
internal responses and behaviors of customer (Baker et al., 1994). Next, Bitner (1992) gives
the objective physical factors such as noise, quality, equipment, signage, lighting, color,
style...which is called physical surroundings influence to customer’s satisfaction and
purchasing intentions. And Bitner (1992) also states that every company can improve
above objective physical factors to impact customer reactions.
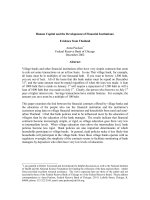
The servicescape includes three composite dimensions (see in Figure 2.1), these are (1)
ambient conditions, (2) spatial layout and functionality (3) signs, symbols and artifacts
(Bitner, 1992).
6
ENVIRONMENTAL
DIMENSIONS
HOLISTIC
ENVIRONMENTAL
Cognitive
. beliefs
. categorization
. symbolic
meaning
Ambient Conditions
. temperature
. air quality
. noise
. music
. odor
. etc.
Space/Function
. layout
. equipment
. furnishings
. etc.
Signs. Symbols
& Artifacts
. signage
. personal artifacts
. style of decor
. etc.
INTERNAL
RESPONSES
MODERATORS
Employee
Response
Moderators
Emotional
. mood
. Attitude
BEHAVIOR
Physiological
. paint
. comfort
. movement
. physical
fit
Approach
. affiliation
. exploration
. stay longer
. commitment
. carry out plan
Avoid
(opposite
of approach)
Employee
Response
Social Interactions
Between and
Among Customers
and Employees
Perceived
Servicescape
Customer
Response
Moderators
Customer
Response
Cognitive
. beliefs
. categorization
. symbolic
meaning
Emotional
. mood
. Attitude
Physiological
. paint
. comfort
. movement
. physical
fit
Approach
. affiliation
. exploration
. stay longer
. commitment
. carry out plan
Avoid
(opposite
of approach)
Figure 2.1: Framework for Understanding Environment-User Relationships in Service Organizations
7
Some researchers define that ambient conditions are a factor impacts perceptions of human
responses to the environment (Baker, 1987). Ambient conditions generally is influenced
by five main senses of the environment, they are temperature, lighting, noise, music and
scent. Besides, some imperceptible dimensions such as gases, infrasound and chemicals
may be profound effects (Russell & Snodgrass, 1987). The second dimension is spatial
layout and functionality is an important physical surroundings particularly. According to
Bitner (1992) “spatial layout refers to the ways in which machinery, equipment, and
furnishings are arranged, the size and shape of those items, and the spatial relationships
among them. And functionality refers to the ability of the same items to facilitate
performance and the accomplishment of goals”. And the last dimension is signs, symbols
and artifacts. The signs can be the labels such as name of firm or department, the directional
purposes such as entrances, exits and the behavior rules such as no smoking, children have
to been accompanied by adult, so on (Bitner, 1992). Signs may decrease perceived
crowding and stress (Wener & Kaminoff, 1982). The communicating symbolic such as
quality of materials, artwork, floor coverings, etc. is displayed in the environment can
create an overall aes-thetic impression (Bitner, 1992). So, can consider this symbol
environmental objects impact less directly than signs. For example, the restaurant image
with plastic furnishings as well as bright lighting can symbolize the normal service and
lower prices (Bitner, 1992).
Come back with the festivalscape, Lee et al. (2008) define that cannot cite the entire list of
festivalscape cues, for example, the relationship between the service environment in the
retail stores and the restaurants is different (Yang et al., 2011). Therefore, basing on the
background theory is servicescape, Lee et al. (2008) states that the festivalscape is also
having three basic background dimension, similar the servicescape, that is ambient
conditions with temperature, air quality, noise, music, odors, etc. (2) spatial layout and
functionality with layout, equipment, furnishings, etc. (3) signs, symbols and artifacts with
signage, personal artifacts, style of décor, etc. And expand more than with the retail
atmosphere, specific, Lee et al. (2008) define that the festivalscape includes seven
8
dimensions may influence satisfaction of visitors at festivals, these are: “program content,
staff demeanor, facility availability and quality, food perceptions, souvenir availability and
quality, convenience, and information availability”.
2.2
Satisfaction
The satisfaction of customer is their evaluation, which is about extent of product or service
respond their wants and needs (Czepiel et al., 1974). In other definition, the satisfaction of
customer is a pleasure or disappointment feeling when a performance or outcome of
product is different or same likely his or her expectation (Kotler & Keller, 2006).
There are two type of satisfaction, the overall satisfaction and the attribute satisfaction. The
overall satisfaction is evaluation through purchasing and experience in goods and service
(Anderson et al., 1994), is holistic evaluation after purchasing (Fornell, 1992). The attribute
satisfaction is subjective evaluation of the customer from observations of attribute (Oliver,
1993). An attribute analysis has higher diagnostic value than an overall analysis because
each question is respective with each attribute (Griffin & Hauser, 1993). The overall
satisfaction and attribute satisfaction is suitable in the hospitality and tourism industry
(Hughes, 1991). Therefore, with the festival in particular, the festival satisfaction is “a sum
of the experiences the attendees had at the festival” (McDowall, 2011) or “overall festival
value evaluated by the composite of quality dimensions” (Yoon et al., 2010).
In addition, there is a problem which may influence to the satisfaction, that is demographic
factors such as gender, age, education and income (Mensah, 2013). For example, women
tourists evaluate about overall satisfaction with the intangible factor higher than men
tourists (Ekinci et al., 2003). The age is also an important factor influence to the overall
satisfaction, (Terry & Israel, 2004). However, the age and the marital status do not
influence perception of tourists about the overall satisfaction (MacKay & Fesenmaier,
1997). Therefore, gender, age or marital status in particularly or the demographic in
generally is not important factor in the overall satisfaction (Schofield & Thompson, 2007).
9
2.3
Previous studies about festivalscape
To examine how festivalscape cues influence patron emotions, satisfaction, Lee et al.
(2008) gives seven dimensions representing, these are convenience, staff, information,
program content, facilities, souvenirs, and food quality. The results show that festival
program content is strong in driving positive emotion and patron satisfaction. Next is
facility quality dimension and finally is food quality also influences positive although the
effect is not much.
Whereas Özdemir & Çulha (2009) suppose that the dimensions such as festival area, staff,
food, souvenirs, information, and convenience may have an effect on the visitors’
satisfaction level. So to identify positive perception of the dimensions that constitute
festival performance, multivariate data analysis gave the results is the “festival area”
dimension affects satisfaction more strongly than other cues. Besides, author also
concludes that other independent variables have indirect positive effects on visitors’
satisfaction, in addition, when each independent variable is eliminated in sequence, the
result is occur positive effect directly on visitors’ satisfaction.
Next, Yoon et al. (2010) claims that except for informational service, all the quality
dimensions such as program, souvenirs, food, and facilities were positively related to
festival value, improved festival satisfaction indirectly. In which, the festival program is
the dimension most strongly associated with value, like previous study of Lee et al. (2008),
while souvenirs, food, and facilities also influenced but less than. “Since festival value is a
starting point in affecting satisfaction, these four quality dimensions are presumed to be
major contributors to festival satisfaction” Yoon et al. (2010).
Similarly, Grappi & Montanari (2011) state that environment of a festival keeps an
important role in affecting visitors’ re-patronizing intention. This study mentions six
dimensions representing festivalscape cues: program content, staffs’ behaviors, places and
atmosphere, information and facilities, hotel and restaurant offers, and souvenir
availability. The result shows that the program content of festival is the most important
among the other dimensions. The staff behaviors also impact although less clear while
10
places and atmosphere, hotel and restaurant offers, souvenir availability tend to affect the
emotions. Remaining, the information and facilities cue seem not affect.
Finally, to identify factors related to the festivalscape that affect visitors’ satisfaction, Anil
(2012) examines some variables such as the antecedents of the festival visitors’ satisfaction
such as staff, festival area, food, souvenir, informational adequacy, and convenience.
Author finds three main dimensions impact to the festivalscape, these are the food, festival
area and convenience. In which food dimension is the strongest factor for visitors’
satisfaction, this is not in line with previous studies. Other dimensions such as souvenir,
staff, and informational adequacy, unexpectedly, do not influence the satisfaction. The
author explains that “the city and festival venue are small, more explicit information,
guides and staff are either low or are regarded as unnecessary”.
2.4
Research model
2.4.1
Hypothesis
From the theoretical background above with previous studies, to test the elements such as
program content, staff, facility, food, souvenirs, convenience, information affect festival
visitors’ satisfaction or not, this study poses following hypotheses as following:
Firstly, festival program content is strong in driving positive emotion and patron
satisfaction (Lee et al., 2008). Like the claim of this research, the festival program is also
stated that it is the dimension most strongly associated with value (Yoon et al., 2010).
Therefore,
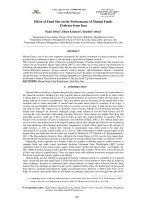
Hypothesis 1: There is a positive relationship between program content and festival
visitors’ satisfaction.
Hypothesis H1 is presented in Figure 2.2
11
PROGRAM CONTENT
-
Performance program
-
Experiential program
-
Interesting festival
-
Variety of events
-
Interpretation program
-
Well organized management and operation
-
Exhibition program
H1+
VISITORS’
SATISFACTION
Figure 2.2: Program content and festival visitors’ satisfaction
Secondly, it is supposes that staff is one of dimensions have an effect on the visitors’
satisfaction level (Özdemir & Çulha, 2009). Although effects are less pronounced than
others, staff behavior also appears to affect hedonism as well as satisfaction of attendees’
festival (Grappi & Montanari, 2011). Consequently,
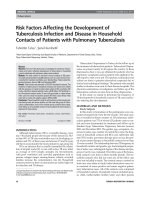
Hypothesis 2: There is a positive relationship between staff and festival visitors’
satisfaction.
Hypothesis H2 is presented in Figure 2.3
STAFF
-
Kind guides and staff
-
Quick responsiveness on request
-
Willingness to help
-
Enough knowledge about the festival
-
Courteous guides and staff
-
Number of event guides and staff
H2+
VISITORS’
SATISFACTION
Figure 2.3: Staff and festival visitors’ satisfaction
12
Thirdly, facility quality is the second strong dimension which effect on satisfaction of
tourist (Lee et al., 2008). The “festival area”, which is consisted of not only program
content but also facility is dimension affects satisfaction more strongly than other cues
(Özdemir & Çulha, 2009). As a result,
Hypothesis 3: There is a positive relationship between facility and festival visitors’
satisfaction.
Hypothesis H3 is presented in Figure 2.4
FACILITY
-
Comfortable festival site
-
Facilities of festival site
-
Space/size of festival site
-
Cleanness of festival site
-
Atmosphere of festival site
-
Layout of festival site
H3+
VISITORS’
SATISFACTION
Figure 2.4: Facility and festival visitors’ satisfaction
Fourthly, although the effect is not much, food quality also influences positive to the
emotion of attendees’ festival (Lee et al., 2008). Specially, it is not in line with previous
studies, food dimension is the strongest factor for visitors’ satisfaction at festival (Anil,
2012). Hence,
Hypothesis 4: There is a positive relationship between food and festival visitors’
satisfaction.
Hypothesis H4 is presented in Figure 2.5
13
FOOD
-
Quality of food
-
Price of food
-
Available traditional food
-
Variety of foods
H4+
VISITORS’
SATISFACTION
Figure 2.5: Food and festival visitors’ satisfaction
Fifthly, souvenir is one of elements have effect on satisfaction of tourists (Özdemir &
Çulha, 2009). Moreover, it is also stated that souvenir is one of four quality dimensions
which are presumed to be major contributors to festival satisfaction (Yoon et al., 2010).
Accordingly,
Hypothesis 5: There is a positive relationship between souvenirs and festival visitors’
satisfaction.
Hypothesis H5 is presented in Figure 2.6
SOUVENIRS
-
Variety of souvenirs
-
Quality of souvenirs
-
Price of souvenirs
H5+
VISITORS’
SATISFACTION
Figure 2.6: Souvenirs and festival visitors’ satisfaction
Sixthly, convenience availability tend to affect the emotions of tourists (Grappi &
Montanari, 2011). The convenience dimension which concludes convenient restrooms,
adequate parking lots, and seating for events such as fashion shows, concerts, and resting
directly has effect on satisfaction of tourists (Anil, 2012). Therefore,
14
Hypothesis 6: There is a positive relationship between convenience and festival visitors’
satisfaction.
Hypothesis H6 is presented in Figure 2.7
CONVENIENCE
-
Restroom
-
Parking lot
-
Rest area
H6+
VISITORS’
SATISFACTION
Figure 2.7: Convenience and festival visitors’ satisfaction
Last but not least, information is also one dimension of satisfaction were derived from the
factors (Özdemir & Çulha, 2009). As a result,
Hypothesis 7: There is a positive relationship between information and festival visitors’
satisfaction.
Hypothesis H7 is presented in Figure 2.8
INFORMATION
-
Installed signboards
-
Prepared pamphlets
H7+
VISITORS’
SATISFACTION
Figure 2.8: Information and festival visitors’ satisfaction
2.4.2
Conceptual framework
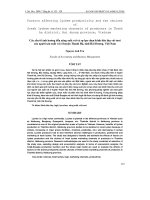
Also from theoretical background as well as hypotheses were gave, this study proposes a
conceptual framework (see in Figure 2.9) including seven factors affect the festival
visitors’ satisfaction: program content, staff, facility, food, souvenir, convenience and
information.
15
H1+
PROGRAM CONTENT
H2+
STAFF
H3+
FACILITY
H4+
FOOD
VISITORS’
SATISFACTION
H5+
SOUVENIRS
H6+
CONVENIENCE
H7+
INFORMATION
Figure 2.9: Research model
In summary, after mentioning theories about festivalscape, satisfaction which basing on
the previous studies, this study proposes that the visitors’ satisfaction at festival is
positively affected by program content, staff, facility, food, souvenir, convenience and
information. Henceforth, this study develops a research model including seven hypotheses
between the festivalscape factors and visitors’ satisfaction.
16