Effect of rd on the productivity of construction enterprises in vietnam
Bạn đang xem bản rút gọn của tài liệu. Xem và tải ngay bản đầy đủ của tài liệu tại đây (1.88 MB, 57 trang )
UNIVERSITY OF ECONOMICS
INSTITUTE OF SOCIAL STUDIES
HO CHI MINH CITY
THE HAGUE
VIETNAM
THE
~~ETHERLANDS
VIETNAM -NETHERLANDS PROGRAMME FOR M.A.
IN DEVELOPMENT ECONOMICS
EFFECT OF R&D ON THE PRODUCTIVITY
OF CONSTRUCTION ENTERPRISES IN VIETNAM
IN PARTIAL FULFILMENT OF THE REQUIREMENT FOR THE
DEGREE OF MASTER OF ARTS IN DEVELOPMENT ECONOMICS
BY
DO KHAC THANH
•
SUPERVISOR
Dr. NGUYEN HUU DUNG
Ho Chi Minh City, December 2011
---------
CERTIFICATION
I certify that the substance of this thesis has not already been submitted for any
degree and is not being currently submitted for any other degrees.
I also certify that, to the best of my knowledge, any help received in preparing this
thesis, and all sources used, have been acknowledged in the thesis.
Signature
Do Khac Thanh
•
•
2
- -
----------
ACKNOWLEDGMENT
I am indebted to numerous individuals but I cannot name them here all. First of all,
I would like to thank all the teachers and staff of the Project for their valuable
suggestion, good learning facilities and warm attitudes during my school time. My
deepest gratitude goes to my supervisors, Dr. Nguyen Hu Dung, and Dr. Nguyen
Trong Hoai for their valuable comments and instructions concerning my thesis.
Finally, I would like to thank my friends, my family who have been always behind
me, given me moral support, encouragement, and sympathy that have helped me
gain more strength to complete this work.
•
.
3
ABSTRACT
The study aims to examine the link and relationship between productivity of construction
enterprises in Vietnam and R&D expenditure. R&D capital is measured in a simple way by
using available R&D expenditure in the survey and ignoring the accumulation of R&D
expenditure in the past, its deflation and obsolescence. A sample of 264 construction firms
was drawn from the data set of Vietnam Enterprise Survey conducted by the General
Statistics Office in 2005 for analysis. A regression model is estimated based on the CobbDouglas production function and the R&D capital model with three main independent
variables: physical capital, dummy and R&D capital, and labor variables reflecting type of
ownership and size of labor.
Research findings show that a positive and significant impact of R&D expenditure on
productivity is found with the elasticity of productivity with respect to R&D expenditure
per labor is about 0.1 0. Moreover, the effects of physical capital and labor on productivity
are also positively and statistically significant. The elasticity of productivity with respect to
physical capital per labor and total labor are around 0.35 and 0.15, respectively.
4
ACRONYMS
EU
European Union
CBO
Congressional Budget Office
GDP
Gross Domestic Product
MFP
Multifactor Productivity
MOST
Ministry of Science and Technology
NACE
Classification of Economic Activities in the European Community
NISTPASS
National Institute for Science and Technology Policy & Strategy
Studies
OECD
Organization for Economic Cooperation and Development
OSTP
Office of Science and Technology Policy
R&D
Research & Development
SME
Small and Medium Enterprise
YES
Vietnam Enterprise Survey
VND
Vietnamese Dong
n.d.
No Date
VIF
Variance Inflation Factors
5
--- -
-----------------------------------------------
CHAPTER 1
INTRODUCTION
1.1.
RATIONALE OF THE RESEARCH
Research and Development (R&D) is widely regarded as the core of technological advance,
and innovative capacity of firms are reliably indicated by levels and rates of R&D
expenditures growth. Countries belonging to the Organization for Economic Cooperation and
Development (OECD) spend significant amounts on R&D activities. Progress of technology
has a quite central role in the modem economy today. It contributes importantly to growth of
economy and is a key factor to determine the competitiveness of firms in both national and
international marketplace. On average, OECD countries have spent more than 2 percent of
GDP on annual public and private R&D investments during the last two decades (OSTP 1,
1997).
Those stocks of knowledge can be increased by formal investment in R&D activities. In the
public and private sectors, the allocation of resources toward the investment to generate new
knowledge must be decided carefully. There are many sources for productivity
improvements, but one strategy for enhancing productivity growth which is widely
acknowledged is increasing the stock of knowledge.
Following the assessment of the Ministry of Industry is that the labor currently lack of
necessary skills to support technological upgrading and there are very little R&D activities
appropriate for such upgrading. Indeed, only a small fraction of the country's R&D scientists
and engineers are working in industrial enterprises. The rest are working in national centers
for R&D, ministries and government agencies, universities or other institutions that perform
research. Another reason is the most important reason for a little investment in R&D
activities of Vietnamese enterprises may be their limitations in financial resources.
Moreover, that there is little market-oriented relationship between firms, R&D institutions
and universities (Bezanson et al., 2000).
6
If R&D has any relationship with productivity of construction finns, the case of Vietnam will
increase a doubt.
Specially, Role of knowledge or technological capital for productivity
growth is emphasized by some empirical research at enterprise level. Those studies only
focused on investment of R&D and appeared that in many countries. It proved that R&D has
a contribution to productivity growth significantly, pm1icularly in the cross sectional
dimension. However, the conclusion is not suitable for Vietnam.
Those R&D activities have not been taken into consideration for much investment in
Vietnam, especially in business sector. While most OECD countries and China devoted
around 2% of their GDP to R&D activities, Vietnam spent only 0.5% of its GDP for this
purpose. Neve11heless, the technology level across the SME sector in Vietnam is generally
assessed as being two, three or even more times lower than both world and regional levels
(Bezanson et al., 2000). R&D expenditure of Vietnamese enterprises accounted for only
about 20% of the total R&D expenditure of the country in 2002. Whereas, according to
OSTP (1997), companies in OECD countries finance more than 50% of all R&D expenditure
and they conduct two-thirds of all R&D activities. SMEs make up the vast majority of
registered companies in Vietnam, namely 96.5%.
1.2.
OBJECTIVE OF THE RESEARCH
(R&D) investment has been regarded as an important factor in the improvement of
productivity levels of firms. For exainple, the average annual rates ofR&D expenditure
relative to gross domestic product in the US and Japan are around 2.64 per cent and 3.04 per
cent, respectively (National Science Council, 2001: 195). This has been proved true by many
empirical studies for many countries but neglected for Vietnainese case.
From 1960s, investment of R&D has played an important role in improvement of
productivity levels. Creation and accumulation of that knowledge is rationale factors via the
R&D efforts of a firm or industry. , this will be available to the production process or product
innovation (Mansfield, 1965; 1969). Those investments will lead to promotion of nationwide
economic development. Therefore, many the advanced countries based on this rationale to
invest expenditure on R&D activities. This study sets out to estimate the relationship between
R&D activities and productivity growth of construction firms in Vietnam to answer the
following questions:
7
Is there a positive relationship between R&D and productivity m Vietnamese
construction firms?
What should those finns do to increase their productivities? and
What policies should be recommended to support them in improving productivity by
increasing R&D expenditure?
1.3.
RESEARCH METHODOLOGY
The thesis used such methods as descriptive statistics, quantitative analysis and OLS
regression to deal with the research questions. The thesis studied the impacts of R&D
expenditure to productivity growth of Vietnamese construction firms by using data from the
Vietnam Enterprise Survey 2005.
1.4 Thesis organization
There are five chapters in this thesis. Introduction is the first chapter is which presents
the rationale of the research, the objective of the research, research hypothesis as well
as methodology, and the thesis structure. Literature Review is the next one is. This
chapter examines theories and empirical studies relating to the impact of R&D
expenditure on productivity growth of construction firms. R&D activities of tirms are
discussed in the chapter 3: Overview of R&D and firm performance in Vietnam.
•
Chapter 4: Research Jvfethodology focuses on model specification and variables
choices justification. Chapter 5 is the practical results are analyzed via descriptive
statistics and regression analysis: Result Analysis. Finally, conclusions and policy
recommendations are provided in Conclusions and Recommendations chapter.
8
CHATPER2
LITERATURE REVIEW
This chapter will make sure that the research is conducted based on a scientific
background. Through this chapter, impact of R&D expenditure on productivity
growth is generally figured out on the basis of economic theories and empirical
studies. The chapter will be presented in four main parts. In the part one, key concepts
related to the topic such as R&D, productivity as well as construction will be
discussed. Economic theories supporting for the study are found out and stated in the
next part. At the end of this part, a research model which represents factors affecting
productivity is suggested. Finally, there will have empirical studies regarding effect of
R&D on productivity growth of construction firms in some countries are discussed in
the last part.
2.1.
CONCEPTS
2.1.1
Research and experimental development (R&D)
R&D has been divided into three categories: basic research, applied research and
experimental development. OECD (1994) defined that "Research and experimental
development (R&D) comprise creative work undertaken on a systematic basis in order to
increase the stock of knowledge, including knowledge of man, culture and society, and the
use of this stock of knowledge to devise new applications".
>-
Experimental development is defined as systematic work that usmg current
knowledge. That current knowledge gained from practical and research experience.
These research and experience is directed producing new products and devices,
materials; installing new processes, systems or services; or substantially improving at
the future in which they has been produced or installed in the past.
o
Basic research is an experimental or theoretical jobs which ensured not to gain benefits
in long-term. However, they must be advance the state of knowledge (CBO, 2005). In
those researches, characteristics, structures and relationships are analyzed with a view
9
to test and formulate theories and laws. Moreover,
outcome of basic research are not
for buy or sale, however usually for publishing in usage of interested people scientific
journals. Sometimes, it may be kept secret for security reasons.
o
Applied research is also original work that is unde1iaken to acquire new knowledge
with a specific application in view. Its' aims are determining possible uses for results of
basic research or determining new ways to achieve specific objectives. Results of
applied research are mainly valid for a limited number of products, operations, methods
or systems. The knowledge or information resulting from applied research is often
applied for patent or may be kept secret.
Applied research is the investigation that is performed for the development of government
policy. Basic research is the theoretical investigation of factors which have influence on
regional variations in economic growth. Experimental development is the development of
operational models based on laws with the purpose of modifying regional variations.
The measurement of such two kinds of R&D expenditures is so complicated with many
costs should be included or excluded. "Expenditure on R&D may be made within the
statistical unit or outside it" (OECD, 1994, page 20) However, in this thesis, R&D
expenditure used to examine its effects on productivity growth of Vietnamese construction
firms is available in the Vietnam Enterprise Survey.
There are different meanings in different contexts for the word "innovation" depending on
certain objectives of measurement or analysis. Scientific and technological innovation is
known as the transformation of an idea into a new or improved product, a new or improved
operational process or a new approach toward a social service. New products or processes
and significant technological changes in products or processes are considered as
technological innovations. An innovation is performed if it is brought out to the market or
used in a production process. Thus, innovations include dozens of activities relating to
science, technology, organization, finance and commerce. R&D is one of such activities and
it may be done at different stages of the innovation process 2• R&D can act as the origin of
2
See Appendix 1 for explanation of innovation process.
10
inventive ideas or a form of problem-solving (OECD, 1994). According to Rogers (1998),
R&D is an important input measure of innovation.
2.1.2
Productivity
OECD (2001, page 11) defines "productivity is commonly defined as a ratio of a volume
measure of output to a volume measure of input use". This general concept has received no
disagreement and can be applied in many different ways. That means there are many
purposes and many ways to measure productivity.
The objectives of productivity
measurement can be stated as follows:
Productivity growth is also calculated to identify changes in efficiency that is basic
different from technical change. Full efficiency in an engineering level means that
with given a fixed amount of inputs and physically achievable with cunent
technology a production process has achieved the maximum amount of output.
In the industries of business economics, comparisons of productivity measures for
specific
A regularly stated objective of measuring productivity growth is to monitor technical
change.
There is a real way to show the essence of measured productivity change is to identify
real cost savings in production.
In the industries of business economics, comparisons of productivity measures for
specific production processes can help to identify inefficiencies.
Measurement of productivity is a key factor to estimate the standard of living.
Productivity is measured in many different methods that depend on the purpose of
productivity measurement or the availability of data. Calculation of productivity can be
divided into two ways: single factor productivity measures and multifactor productivity
measures. Multifactor productivity relates a measure of output to a bundle of inputs, whereas,
Single factor productivity relates a measure of output to a single measure of output. At the
industry or firm level, there is a distinction between productivity measures that relate some
measures of gross output to one or several inputs and those which use value-added to capture
output movements.
11
Table 2.1: Overview of main productivity measures
Type of input measure
Capital, labor and
Type of
output
measure
Capital and
Labor
Capital
I
labor
intermediate
inputs (energy,
materials,
services)
Labor
Capital
Gross
productivity
productivity
output
(based on gross
(based on gross
output)
output)
Labor
Capital
Value
productivity
productivity
added
(based on value
(based on value
added)
added)
Capital-labor
KLEMS
MFP (based on
multifactor
gross output)
productivity
Capital-labor
MFP (based on
value added)
Single factor productivity
Multifactor productivity (MFP)
measures
measures
Source: OECD, 2001
In this thesis, labor productivity is used to measure because it will relate to the most
important factor of production labor and is relatively easy to measure. Gross-output based
labor productivity, which is a ratio of quantity index of gross output to quantity index of
labor input, is used to measure productivity.
2.1.3
Definition of Construction sector
Construction sector is the process by which material, equipment, machinery are assembled
into a permanent facility
It reacts rapidly to external economic pressures, tight money or national recesswn.
Widerange of activities, methods and manufacture, remote site with changing conditions.
12
Construction contractor often enjoys high incomes but due to the competitive nature, result in
a high bankruptcy rate. Persoru1el are not permanent and skilled workers earn high wages, but
due to interruption of season reduce the annual income of money. Compose of large number
of independent suppliers and contractor.
2.2.
ECONOMIC THEORIES
2.2.1 Production theories
Cobb-Douglas Production Function
Based on Pindyck and Rubinfeld (1992), the Cobb-Douglas production function is a widelyused approach to represent the relationship between inputs in microeconomics and an output.
Knut Wicksell (1851-1926) proposed the function in the period 1851-1926, and then in 1928
Paul Douglas and Charles Cobb tested it against statistical evidence. The production function
has the general form as follows:
Q = ALaxfJ
(2.1),
where:
•
Q denotes output, L: labor input, K: capital input
•
A is a constant depending on the units in which inputs and output are measured
• Band a
are the capital and output elasticity of labor, respectively. They are constants
and ordinarily smaller than one because the fact that the marginal product of each
input diminishes when that factor increases
For example, if a = 0.15, a 1% increase in labor would lead to approximately a 0.15%
increase in output. Furthermore, if a +
B=
1, the production function exhibits constant
returns to scale. If a + B< 1, there are decreasing returns to scale, and if a + B> 1, then there
are increasing returns to scale. For example, if L and K each are increased by 20%, Y
increases by 20% when a +
and a +
B<
B= 1. Y increases more than and less than 20% when a + B< 1
1, respectively. Output elasticity measures the responsiveness of output to a
change in levels of either labor or capital used in production, ceteris paribus. The CobbDouglas production function written in logarithmic form is as follow: log Q = log A + a log
13
L + ~ log K. This form is useful when performing a regression analysis by OLS (linear in log
form of parameters).
Pindyck and Rubinfeld (1992) stated that a general production function, Q = F(K, L), applies
to a given technology. This means a given state of knowledge might be used in the
transformation of inputs into output. When technology is improved and the production
function changes, a firm can obtain more output with a given number of inputs. For instance,
a new and faster computer chip may enable a hardware manufacturer to produce computers
with higher speed in a given period of time.
Here, the Cobb-Douglas production function will illustrate a way to measure production
functions. The possibility is that the firm's production process shows increasing returns at
low output levels, constant returns at intermediate output, and decreasing returns at high
output levels. However, it is often replaced by other more complex production functions in
industry studies for some reasons.
The Law of Diminishing Returns
When the labor input is small and capital input is fixed, a small increase in labor input will
lead to a substantial increase in output because workers are allowed to develop specialized
tasks Pindyck and Rubinfeld (1992, page 10) stated the law of diminishing returns that "as
the use of an input increases (with other input fixed), a point will eventually be reached at
which the resulting additions to output decrease". However, when too many workers are used
in the production, some of them become ineffective and therefore the marginal product of
labor falls. That is called the law of diminishing returns.
In the analysis of production, we have to assume that the quality of all labor input are the
same. Diminishing returns result from limitations on the use of other fixed inputs such as
machinery, not from declines in worker quality. Moreover, we should not confuse
diminishing returns with negative returns. In the law of diminishing return, a declining
marginal product is described, not a negative one. The law of diminishing returns is often
applied in short-run analyses because according to the definition, at least one input is fixed.
However, it sometimes can be applied to long-run analyses. There is one point needed to pay
attention to is that the law of diminishing returns differs from decrease in output due to
14
--
.
-
-------
-- ----------------
changes in the quality of labor when labor input are increased. For instance, when the most
qualified workers are hired first, the output will increase much accordingly. However, the
output may not go up or go up at a low level when the least qualified workers are hired last.
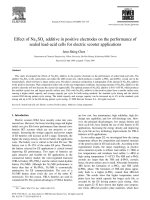
Although any given production process has diminishing returns to labor, labor productivity
can increase if there are improvements in the technology. According to the figure 2.1,
improvements in technology may allow the output curve to shift upward from 0 1 to 0 2 and
then 0 3 . In this law, a given production technology is also assumed. However, over time,
inventions and technology improvements may allow the entire total product curve to shift
upward, thus, more output can be obtained with the same inputs.
Figure 2.1: The effect of technology improvement
c
Output
per
time
period
Labor per time
Source: Pindyck and Rubinfeld, 1992 (Page 10)
2.2.2. R&D Capital Model
We can study many different forms of R&D capital such as private, public, and R&D done
by neighboring firms or industries. According to Griliches (2000), the R&D capital model is
still the most important research method today in estimating the effects of R&D on
productivity growth, in spite of its many weaknesses. It is a simple and easily-applied model
that enables us to estimate the rate of return to R&D and then to measure its contribution to
15
productivity growth. Most of applied studies are based on it. The first, direct approach is
represented by the equation as follows:
Log Y = a(t) + fJ log X + y log K + u
(2.2)
Y denotes some measures of output at the firm, industry, or national level;
X is a vector of standard economic inputs such as man-hours, structures and
equipment, energy use, and so on;
K is one or more measures of cumulated research effort or "knowledge capital";
a(t) indicates other factors that affect output and change systematically over time;
u reflects all other random fluctuations in output.
It is the first approximation to represent a potentially much more complex relationship. This
equation is taken in logarithmic form from the Cobb-Douglas production function. In this
first equation, y, the elasticity of output with respect to research capital, is focused to be
estimated. R&D capital is often calculated by a weighted sum of past R&D expenditures with
the weights reflecting both the potential delays in the impact of R&D on output and its
possible eventual depreciation.
Growth rates are used to replace levels and the above equation in the second approach
becomes as follows:
L\Log Y = a(t) + fJ L\log X + p (R/Y) + L\u
(2.3),
where
p is interpreted as the gross rate of retum to investment in K, gross of depreciation
and obsolescence;
In this form, the growth rate of output or productivity is related to the intensity (R/Y)
of the investment in R&D or some more general measure of investment in science
and technology.
L\ denotes a time difference;
The term yL\log K is simplified as follows:
p = dY/dK = y(Y/K), L\log K = R/K, yL\log K = RIK*p*(KI}j
R is the net investment in K, net of the depreciation of the previously accumulated
R&D capital;
16
There are a number of conceptual difficulties in the application of this model. First, it is
difficult to measure output and output growth accurately in science and technology sectors
conceptually. Second, the construction of R&D capital variable may also face issues of
timing, depreciation and coverage and others. The biggest problem with this model may be
that it treats R&D and science as another kind of investment. However, investing in the
creation of knowledge is not similar to buying a machine or building a plant. It is quite
difficult to measure the results of such activities. Nevertheless, this simple model is
conveniently a starting point to examine empirical works in this area and applicable to our
problem if we are able to consider their conceptual and data problems.
Griliches (2000, page 70) stated that there is simultaneity problem referring to possible
confusion in causality: "future output and its profitability depend on past R&D, while R&D,
in turn, depends on both past output and able to build a system of equations in which current
output depends on past R&D, and past R&D depends on past output". However, with crosssectional data, it is much more difficult to make such distinctions.
2.2.3. Suggested research model from economic theories
The relationship between firm productivity and its detem1inants can be described in a
function with dependent and independent variables based on the above economic theories, as
follows:
Y = f [L, K, R, CHAR(SIZE, OWNERSHIP)]
(2.4)
Y denotes measures of output of firms. It is expressed in the form that representing
labor productivity of firm.
L denotes labor input of firm
K is physical capital of firm
R denotes measures of R&D capital
CHAR is considered as some characteristics of firm which affect its productivity such
as size of labor or type of ownership.
17
. - -
2.3.
---- ----------------------------------------------------
REVIEWS OF EMPIRICAL STUDIES
2.3.1. Overview
Mairesse and Sassenou (1991) executed a research which surveys econometric studies
examining the relationship between R&D and productivity at the firm level and assesses the
results as well as problems encountered. In addition to such usual factors of production as
labor, physical capital, materials and so on, a measure of R&D capital is also included in the
function as explanatory variable. Following to those authors, the Cobb-Douglas production
function is the basic analytical framework used by most econometric studies that estimate the
contribution of R&D on productivity growth. The Cobb-Douglas production function has an
advantage that it can be estimated as a linear regression if all variables are transformed into
logarithmic forms.
There are many empirical studies estimating the impact of R&D investment on such
influence. According to CBO (2005) and (Economic Inquiry, vol. 29 (April), pp. 203-228),
the results of such relationship spread a wide range. So being aware of the importance of
research and development, many analysts have examined the relationship between R&D
expenditure and productivity growth at firm level. Some researchers have found that R&D
virtually has no effect on productivity. Whereas, other studies have discovered that R&D's
effect is substantial and larger than effect of other kinds of investment. However, most of the
estimates lie somewhere between the two extremes, therefore, there is an agreement with the
view that the relationship between R&D spending and productivity growth is significant
positively.
CBO (2005) and Mairesse and Sassenou (1991) found out when reviewing and synthesizing
related studies. However, the three case studies below will help to investigate further the
relationship between R&D and productivity in practice.
Maire sse and Sassenou 1991 (pp 346) said that econometricians try to simplify phenomena
which are often complex ones on viewing problems encountered as mentioned above highly;
this is especially true with R&D activities and their effects on productivity. They talk that
"R&D effects are intrinsically uncertain, they often happen with long lags, they may vary
significantly from one firm or sector to another and change over time". The impacts of other
18
factors of productivity that happen simultaneously and have domination may make R&D
effects to be hidden. It is difficult to build up a production function between R&D and
productivity if serious problems in measuring variables and collecting good data are ignored.
Therefore, the authors were surprised to find out that in most studies, estimates of the R&D
elasticity or R&D rate of return are statistically significant and frequently plausible.
2.3.2. The effect of R&D Capital on Danish Firm Productivity
This paper analyses the importance of R&D for Danish private firm productivity on the basis
of cross-section data. Unlike the two above studies using time series data on analysis, it was
conducted by Graversen and Mark (2005). This report aims to identify the return to R&D
capital rate and other related factors that have influence on firm productivity growth. The
data used in this research is drawn from the official Danish R&D Statistics 2001 conducted
by the Danish Centre for Studies in Research and Research Policy. The sample contains more
than 2200 firms with positive R&D among 18.381 firms in 2001 and it represents broadly all
Danish private sector firms with more than 9 employees. The analysis is based on a
logarithmic version of the Cobb-Douglas production function where production is estimated
as a function of dependent variables as follows:
Productivity = f (R&D Capital, Assets, Labor, Business Sector, Size)
Even though other variables are measured in 2001, R&D capital is calculated from the firms'
R&D cost in the past, and R&D costs are accumulated, deflated and depreciated. Like earlier
researches, the study also shows the major results that the return to R&D capital is highly and
positively significant and it increases when the firms have research educated employees. The
value added per employee of R&D active firms is 40 percent higher than that of R&D
inactive firms. Moreover, each 10 percent increase in R&D capital among the R&D active
firms leads to 1 percent increase in the value added.
2.3.3. R&D and Productivity in French construction firms
.
-
The sample including 182 firms is divided into two sub-samples: scientific firms which
belong to the R&D intensive industries such as chemicals, drugs, electronics and electrical
19
equipment and other firms in other construction industries. Cuneo and Mairesse (1983)
investigated if there is a significant relationship between R&D expenditures and productivity
performance at the firm level in French construction industry for the period 1972 - 1977. The
basic model used in this research is the simple extended Cobb-Douglas production function,
which can be written in as follows:
(2.5)
Where i, t refer to the firm and the current year; e is the error term in the equation; v, c, 1 and
k stand for production (value added), physical capital, labor, and R&D capital, respectively;
f.l = a +
0 + y is the coefficient of returns to scale; and A is the rate of disembodied technical
change.
In this study, production is measured by deflated value-added V rather than by deflated sales.
Labor L is measured by the number of employees, physical capital stock C by gross-plant
adjusted for inflation. R&D capital stock K is calculated by the weighted sum of past R&D
expenditure which uses a constant rate of obsolescence of 15 percent per year. Two variables,
labor and physical capital stock are corrected for the double counting because they are
already included in the R&D capital stock. Thus, the available number of R&D employees is
simply subtracted from the total number of employees. Whereas, the part of physical capital
stock used in R&D is calculated based on the average ratio of the physical investment
component of R&D expenditures to total R&D expenditures and is also subtracted. However,
in the practice of Vietnam, because having full financial statements of examined firms is very
difficult, it is impossible to separate the part of physical capital in R&D expenditure from the
total physical capital stock.
The authors finally come up with discrepancies between the total and within-firm estimates
of the two main parameters: the elasticity of physical capital stocks (a) and R&D capital
stocks (y). However, due to good measures of the variables, the problem is much less serious
than it could have been, and in general the estimates are statistically significant and likely
high. Besides, in order to tind out further results, the authors used sales instead of value
added and included and excluded materials M in tum in the production function. The total
estimates using sales and omitting materials do not differ much from those obtained with
20
value added. The within-firm estimates with sales instead of value added are also similar
when constant returns to scale is imposed. However, if constant returns to scale is not
imposed, large discrepancies between the total and \vithin-firm estimates occur. The withinfirm estimates are much improved when materials are taken into consideration. Hence, the
omission of materials in the sales specification affects especially the within-fi1ms estimates.
2.3.4. R&D and Productivity Growth in Japanese construction firms
The data used in this research is drawn from the Basic Survey of Business Structure and
Activities conducted by Japanese Ministry of Economy, Trade and Industry. From this data
set, the authors selected 3,830 firms in the construction sector which had positive R&D
expenditures from 1995 to 1998. Those firms all have no less than 50 employees and 30
million yen of capital and are grouped into 22 construction industries based on their main
business activities.
Kwon and Inui (2003) conducted a research to examine the relationship between the R&D
and the productivity improvement in Japanese construction firms. In this research, they
estimated a Cobb-Douglas production function with three inputs: labor, physical capital and
knowledge capital for more than 3,000 Japanese firms for the period 1995-1998.
On investigating the contribution of the R&D to the productivity growth of Japanese
construction finns, Kwon and Inui (2003) used two approaches: Production Function
Approach and The Rate of Return to R&D Approach. In the production function framework,
the disadvantage is that possible bias is allowed due to simultaneous output and input
decisions, and the advantage is that the assumptions of competitive factor markets, cost
minimization, and constant returns to scale are avoided. In this approach, the relationship
between R&D and productivity growth is
r~presented
differences as follows:
21
in the regression function using first-
Where: Y denotes the value added, K as the physical capital stock, L as the labor input, and
R as the knowledge capital stock.
}.t
is the time-specific variable and the rate of disembodied
technical change. The subscripts i and t denote the firm and the year respectively. Here, 1 - a
>
f3 is assumed to maintain a positive marginal product of labor.
y is a scale parameter. y
implies increasing returns to scale if it has a positive value, and decreasing returns to scale if
it has a negative value.
In the second approach, Kwon and Inui measured the contribution of R&D to productivity by
estimating the rate of return to the R&D They haven't measure the elasticity of value added
with respect to R&D. there is a advantage of this approach is that it can avoid the
measurement problem of the R&D capital stock. The relation between the level of R&D
intensity and the growth of labor productivity can be written as the following equation:
Where E is the R&D expenditures of firm i in period t.
In both approaches, the study found a positive and significant eflect of R&D expenditure on
productivity growth and this effect is diflerent by the firms' sizes and characteristics of
technology. The R&D elasticity are higher for the large sized and high-tech firms than they
are for other types of firms. Besides R&D capital, the physical capital stock also significantly
affects labor productivity growth. Moreover, an industry effect is found not important in
explaining productivity differences among firms.
2.4.
SUMMARY
It is a difficult task to formulate the relationship between R&D and productivity due to
problems in measuring variables and limitation of the data collected according to Mairesse
and Sassenou (1991 ). There are many analysts so far have attempted to assess the
contribution of R&D to firm productivity growth and their analytical framework is mainly
based on the Cobb-Douglas production function. However, a more complex equation in
which R&D capital and some characteristics regarding technology, size, ownership are added
as an explanatory variable and dummy variables, respectively is widely used. Nevertheless,
22
the result in most studies is quite surpnsmg that the impact of R&D expenditure on
productivity growth is positively and significant statistically.
This research is going to estimate the relationship between productivity of firms and its main
determinants such as labor, physical capital, R&D capital, and some characteristics of firm,
namely size of labor and type of ownership on the basis of economic theories. Like many
other studies, the regression equation in this research is mainly based on the Cobb-Douglas
production function and the R&D capital model. However, because limitation of data, I
base on functional form of the production function approach stated in the empirical
study of K won and Inui (2003) is also applied in this research with cross sectional
data.
23
CHAPTER3
OVERVIEW OF R&D AND FIRM PERFORMANCE IN VIETNAM
The purpose of this chapter is to present the overview of R&D activities in Vietnam in
general and R&D activities of firms in particular so that the research is analyzed based on a
reality background. This chapter consists of three main parts. First, part one talks about R&D
activities in Vietnam and compared with other countries. Structure of the R&D system in
Vietnam is stated in the next part. The final part will discuss how R&D institutions are linked
with the productive sector
3.1.
R&D ACTIVITIES IN VIETNAM
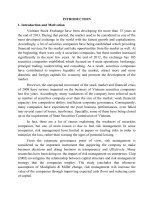
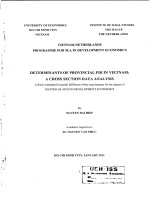
In 1996, Vietnam spent approximately 0.3% of its GDP on R&D and this number increased
to about 0.5% in 2003 (figure 3.1). Vietnam spent a rather little amount on R&D activities as
mentioned in. the rationale of the research, in comparison with OECD countries and
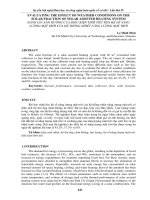
neighbors. But most of such expenditure was financed by the Government, namely 80% in
2002. This is different from OECD countries, where most of R&D expenditure was financed
by companies, say about 30% in 2002 (figure 3.2).
Figure 3.1: Percentage of GDP spent on R&D in 1996
Countries
Source: Nguyen (2006)
24
Figure 3.2: Expenditure on R&D by Government and Business sector in 2002
100%
80%
~
60%
~
40%
~"'
0..
20~~
Oo/o
Countries
Source: Nguyen (2006)
.·. . • · GOVERD: ~xpt:n~jture otl.R&Q financed by Government
, ,i·(. • ...· BJ!:RD: expenditure ~n R&D finanCed by B.usiness sector .
Figure 3.3: Sector-wise R&D Expenditure in Vietnam in 2002
Ell Direct Government
0 Hlgl-1er Eclucation
• Business enterprises o Funcls from nbroacl
• Private non-profit
D ott1ers
Source: Nguyen (2006)
According to Bezanson et al., (2000), NISTPASS 3 provided statistic numbers which show
that total R&D spending per full-time researcher has been declining sharply since reforms
3
NISTPASS is National Institute for Science and Technology Policy & Strategy Studies
25